Hello everyone,
After much tinkering with my main dashboard, I am satisfied with its current look. There are several improvements still to be made, but I’m mostly there.
If you only want to look at pretty pictures, you can do that here:
All screenshots at once
Integrations:
HACS:
Main Page:
Weather:
ACs:

Surveillance:
Power:
TVs:
3D Printers:
Wired Networking:
Wireless Networking:
Host Monitoring:
Pi-Hole Information:
Internet radios:
HA Host Troubleshooting Data:
HA System Logs AI Analyzer:

Before delving into details, here’s some general information about my Home Assistant setup:
Hardware:
Mini PC Asus NUC 14 Essential RNUC14MNK1500002 (SKU: 90AR00M2-M000F0), Intel N150, 16 GB DDR5 4800, 250 GB nVME SSD. It’s a dedicated machine.
Hardware Add-On: The laughably-named “USB2.0 DAB FM Radio DVB-T RTL2832U R820T2 RTL SDR TV Stick Dongle Digital USB TV HDTV Tuner Receiver IR Remote with Antenna” - which allows me to get data from my weather station.
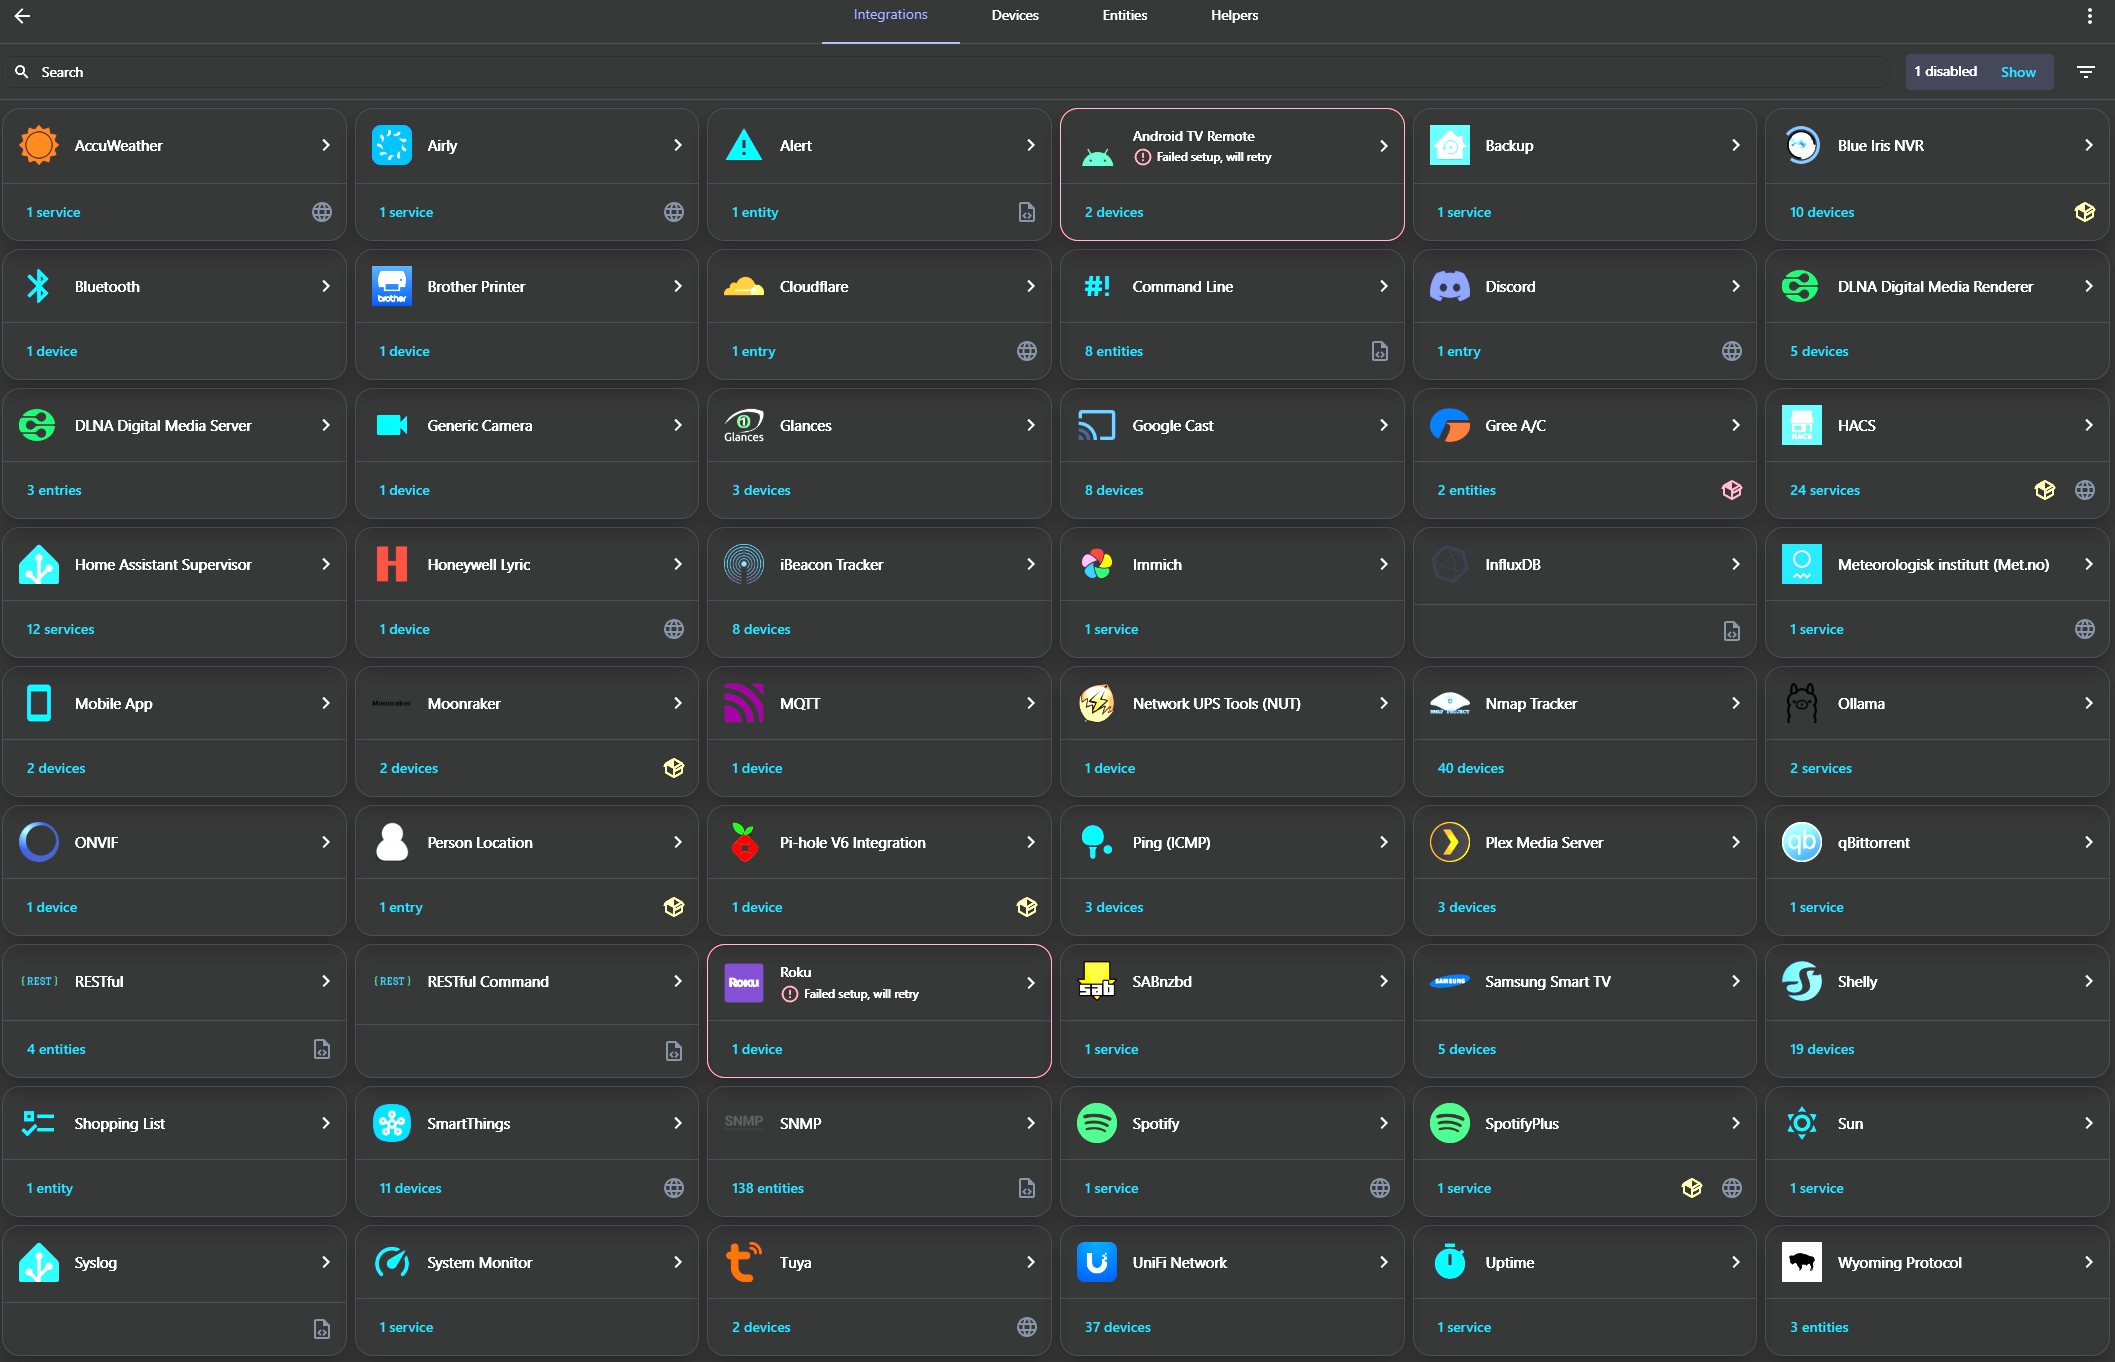
Integrations:
I decided to place a screenshot, rather than list them all. If you are curious about any of them, feel free to ask. Ignore the Android Remote and Roku errors, those are ignored on purpose ![]()
Add-Ons:
Advanced SSH & Web Terminal
Anycubic 3D Printer (for my Anycubic Mono X)
Glances
HassOS SSH port 22222 Configurator
Mosquitto broker
openWakeWord
rtl_433 (next)
SQLite Web
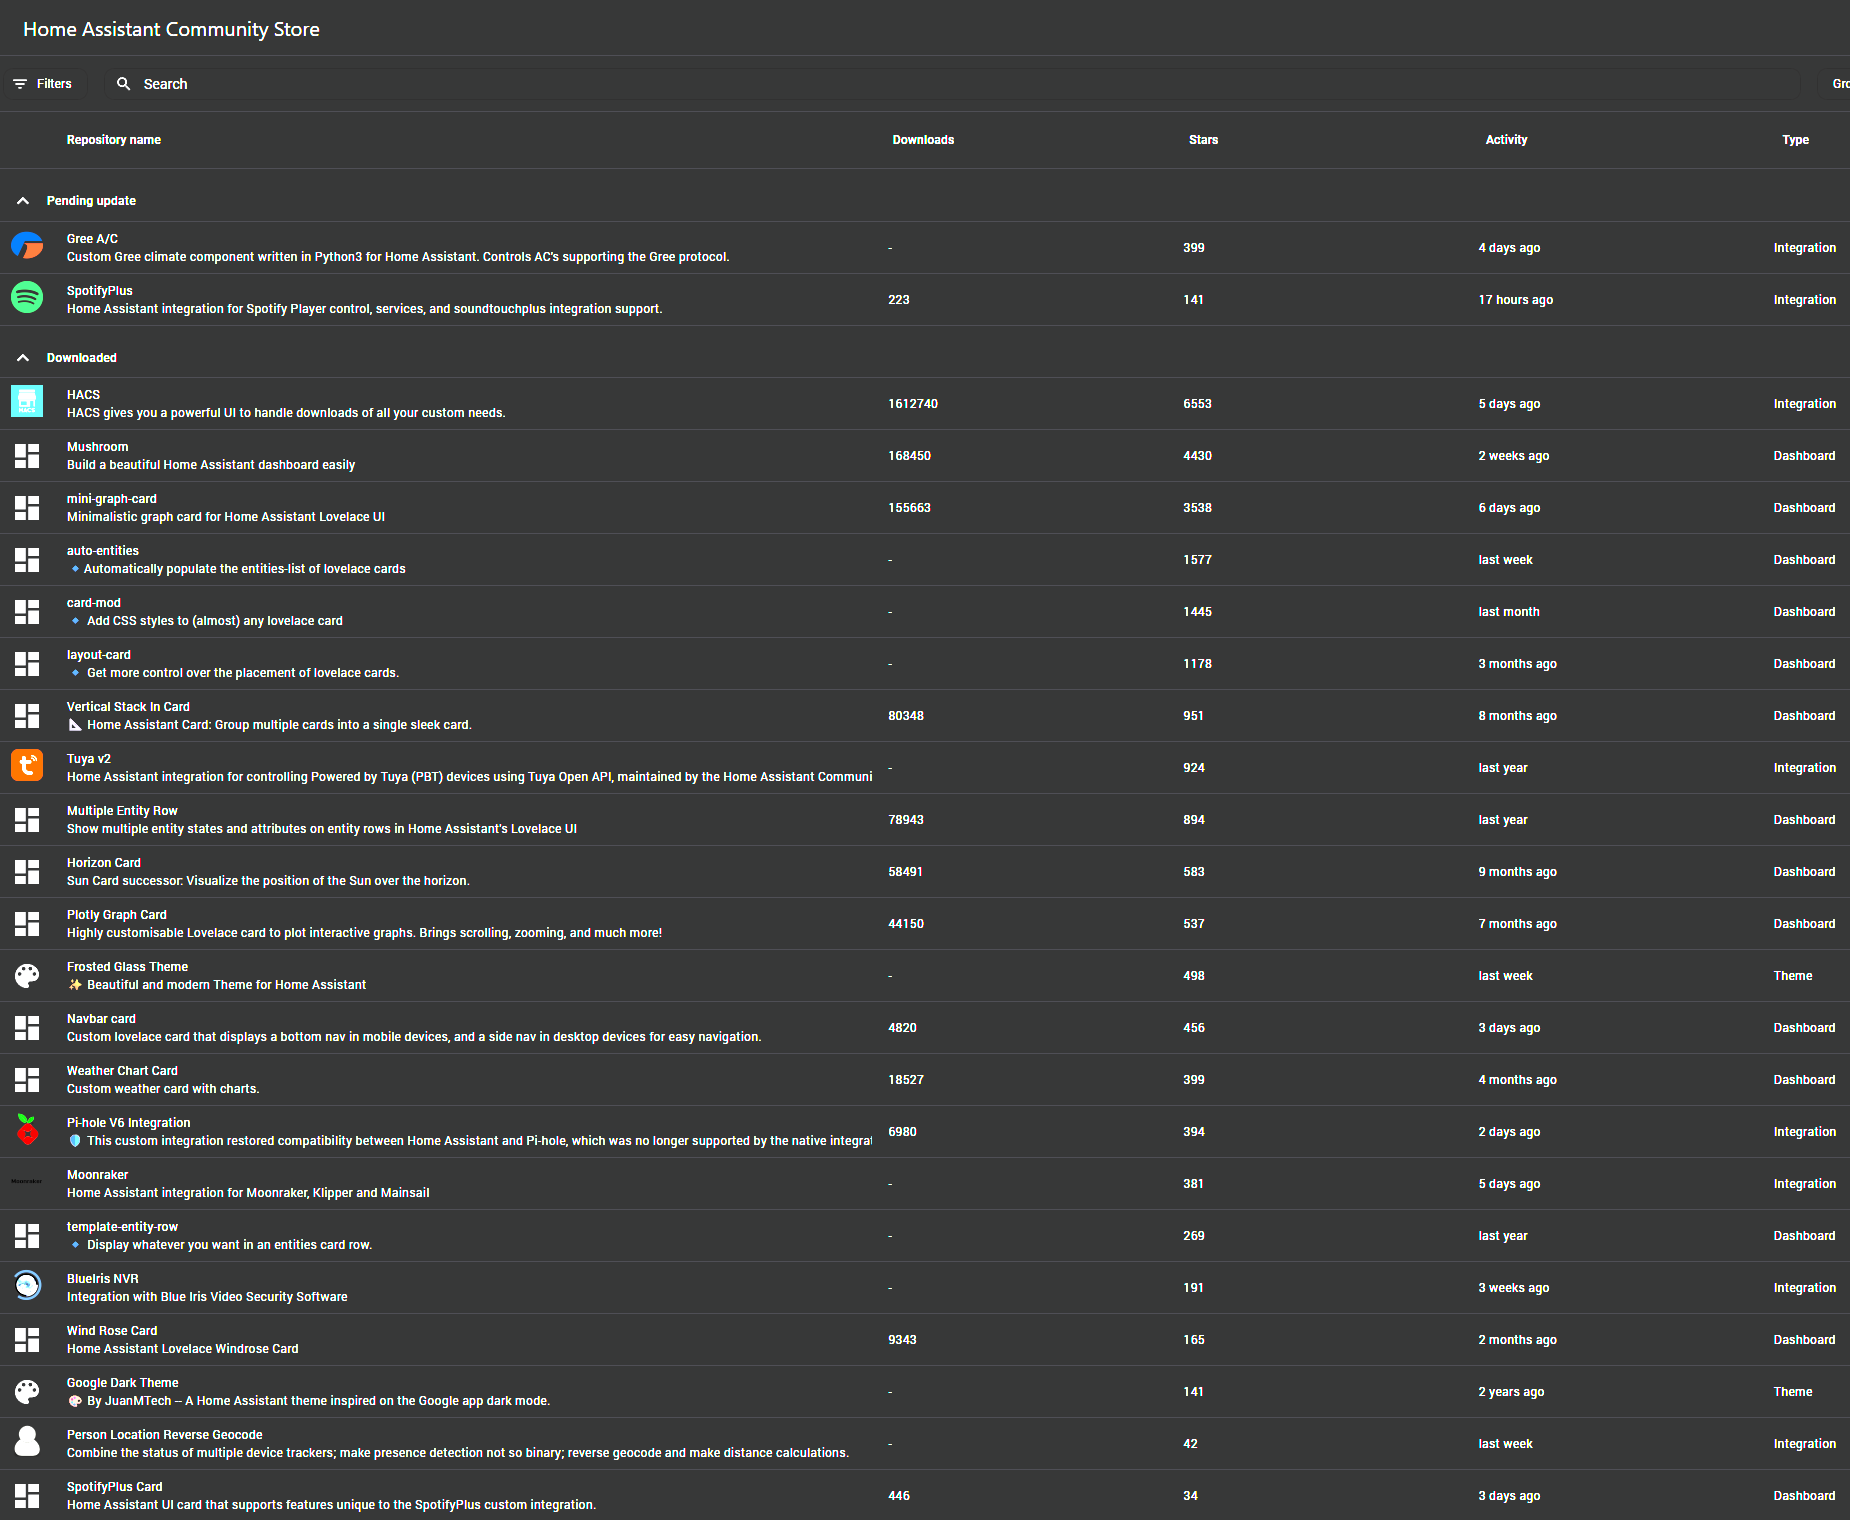
HACS stuff
A pretty long list, I have taken a screenshot and tried to mention the relevant item in the descriptions below, together with a link to its repository.
External resources
A non-exhaustive list of external software that works together with Home Assistant:
- InfluxDB: Home Assistant historical data goes there. This allows me to have long-term history outside of HA.
- Grafana: Nice graphs with historical and real-time data, leveraging InfluxDB
- Node-RED: Used to automate tasks such as remote LLMs
- Piper and faster-Whisper: Speech-To-Text (STT) and Text-To-Speech (TTS) used for Home Assistant’s Assist. These are installed in dockers on my Unraid server.
- Ollama with 3.2b - Squeezed in my Blue Iris surveillance dedicated machine, on a measly 5 GB of GPU VRAM.
Now, let me present you my current dashboard configuration:
Main View
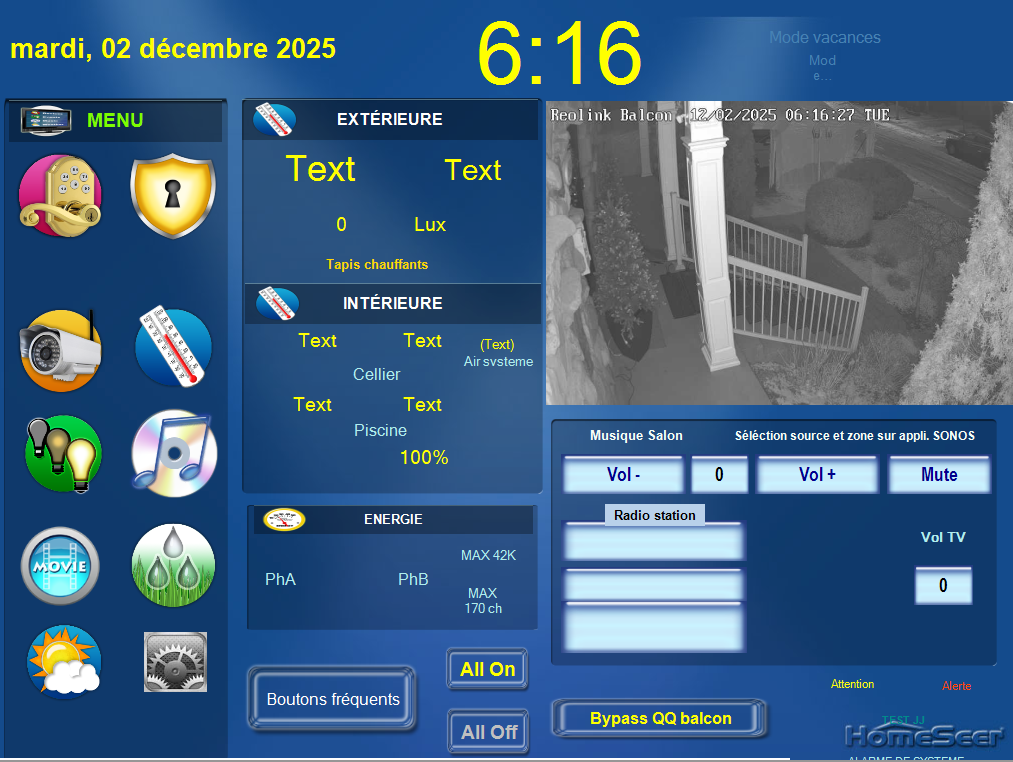
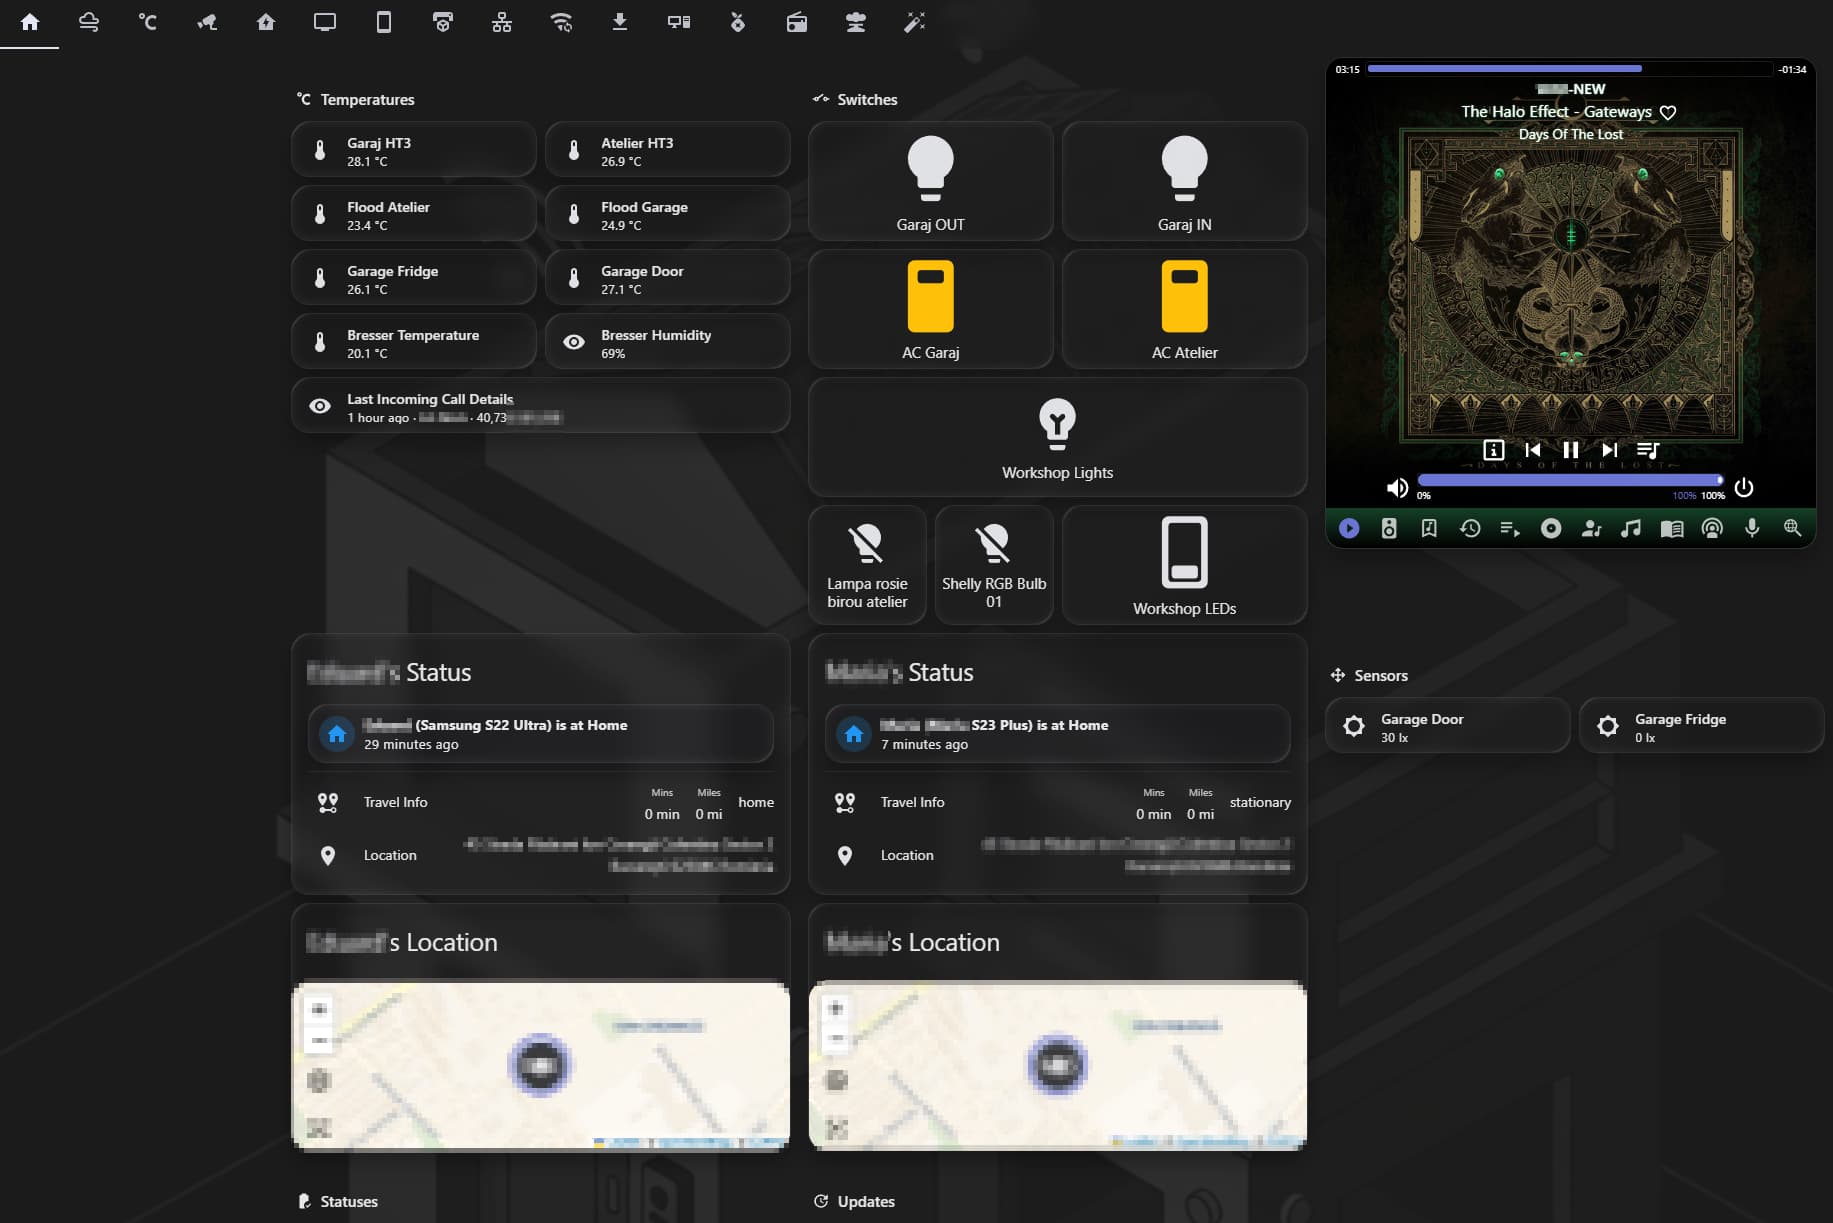
This is the main view, the default one that loads whenever I access Home Assistant.
Temperatures section
- Displays various data from sensors, mainly temperature sensors, that I want to know about most often. The bottom entry displays the last call I received on my phone, from whom, and the phone number of the caller.
TODO: Add an entry for last outgoing call
Switches
- This section allows me to turn on and off various lights that I use most, as well as see their statuses. The “Workshop Lights” entry triggers a template which turns on and off all three lights below it. “Workshop LEDs” is a smart plug which controls a LED strip.
TODO: *Add a smart plug and include configuration for another dumb LED strip that I already have installed
Spotify
- This is a HACS combo: SpotifyPlus Integration and SpotifyPlus Card.
Status Section
- These track my whereabouts, as well as my wife’s. Yes, she knows about it, before you ask
 We very rarely travel separately anywhere. This is yet another HACS integration, called Home Assistant Person Location Custom Integration.
Sensors section
- Not much here, just some light sensors from my Shelly DW2 devices, they allow me to make sure the lights are not left on in unautomated areas.
Statuses and Updates sections
- These contain several entities which display battery statuses (or toner load for my printer) and whether there are any updates available for various integrated devices. The entities are hidden or visible based on thresholds. If battery charges are e.g. less than 20%, the entity becomes visible. Same with Updates, if a component e.g. Pi-Hole or Ubiquiti devices has a firmware update, it will show here. Otherwise, they are hidden.
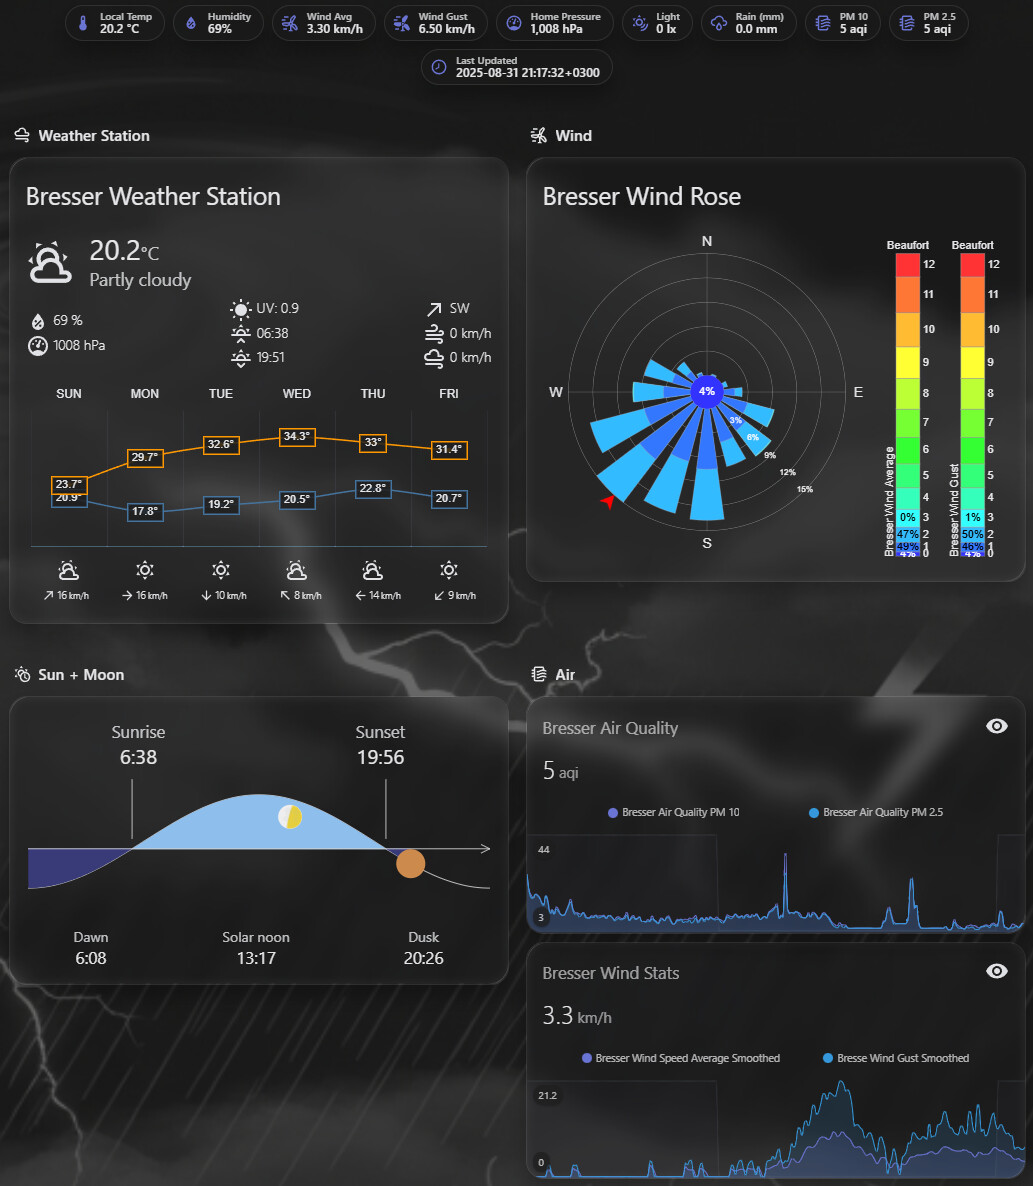
Weather View
This is, obviously, a weather-specific view.
Bresser Weather Station
- This is another HACS card, called Weather Chart Card. It displays data coming from my Bresser weather station, which I integrated with Home Assistant using this useful tutorial, with some modifications (I also have a Bresser PM2.5 and PM10 add-on which I integrated using the same method).
Bresser Wind Rose
- Another HACS Card, called Lovelace Windrose card. It allows me to see wind direction and intensity.
Sun + Moon
- Yes, you guessed right, one more HACS card. This is actually the very first HACS component I ever installed: Lovelace Horizon Card. I kept the simpler variant in the dashboard.
Air
- This section leverages Air Quality and Wind data coming off my Bresser Weather Station. I didn’t like the value spikes displayed in the standard view, so I used some templating to smooth out the values for wind, wind gust, PM2.5 and PM10. Another change was the display units for wind. They are originally shown in m/s, and I converted those values to km/h. The card used for displaying the data is mini-graph-card, with an extra day/night layer.
TODO: Add a graph for temperature. It’s easy, but I don’t really need historical data in the dashboard, I use Grafana for that.
NOTE: Sometimes, there are flat periods in the graphs. This is due to poor radio receiver antenna quality. I will eventually change it.
AC View
This is a simple and straightforward view, containing my AC controls, thermostat control and the garage average temperature (based on several sensors placed in various areas). really, nothing special going on in this view that is worth mentioning.
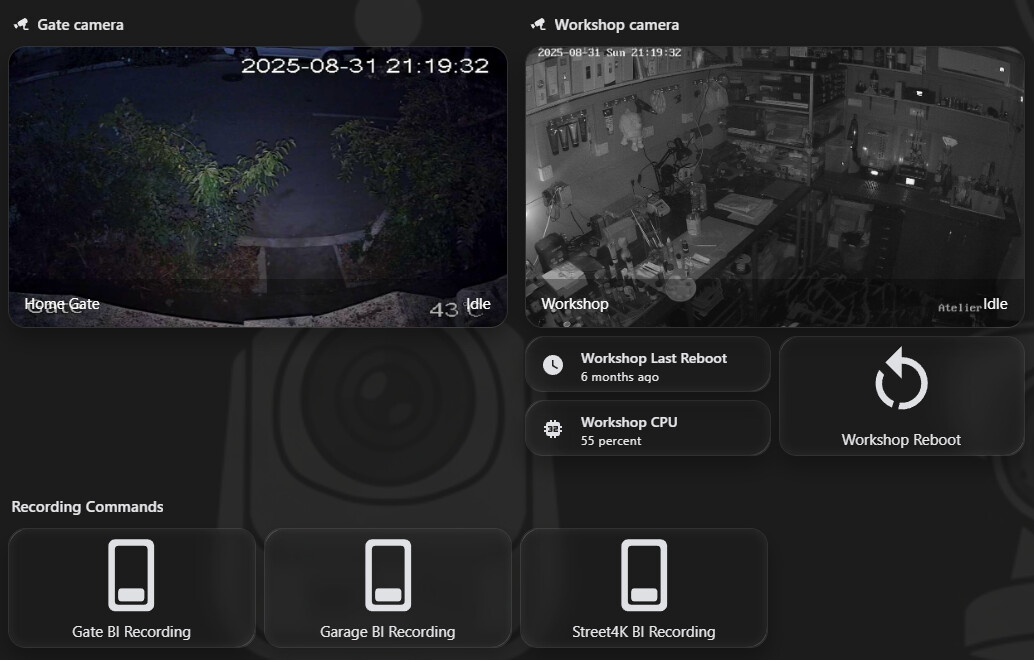
Camera View
Again, a pretty simple dashboard view. I am not using this much, because I have a dedicated Blue Iris surveillance machine. However, the three buttons at the bottom allow me to manually start recording with any of those cameras. They are commands which are sent to the Blue Iris server.
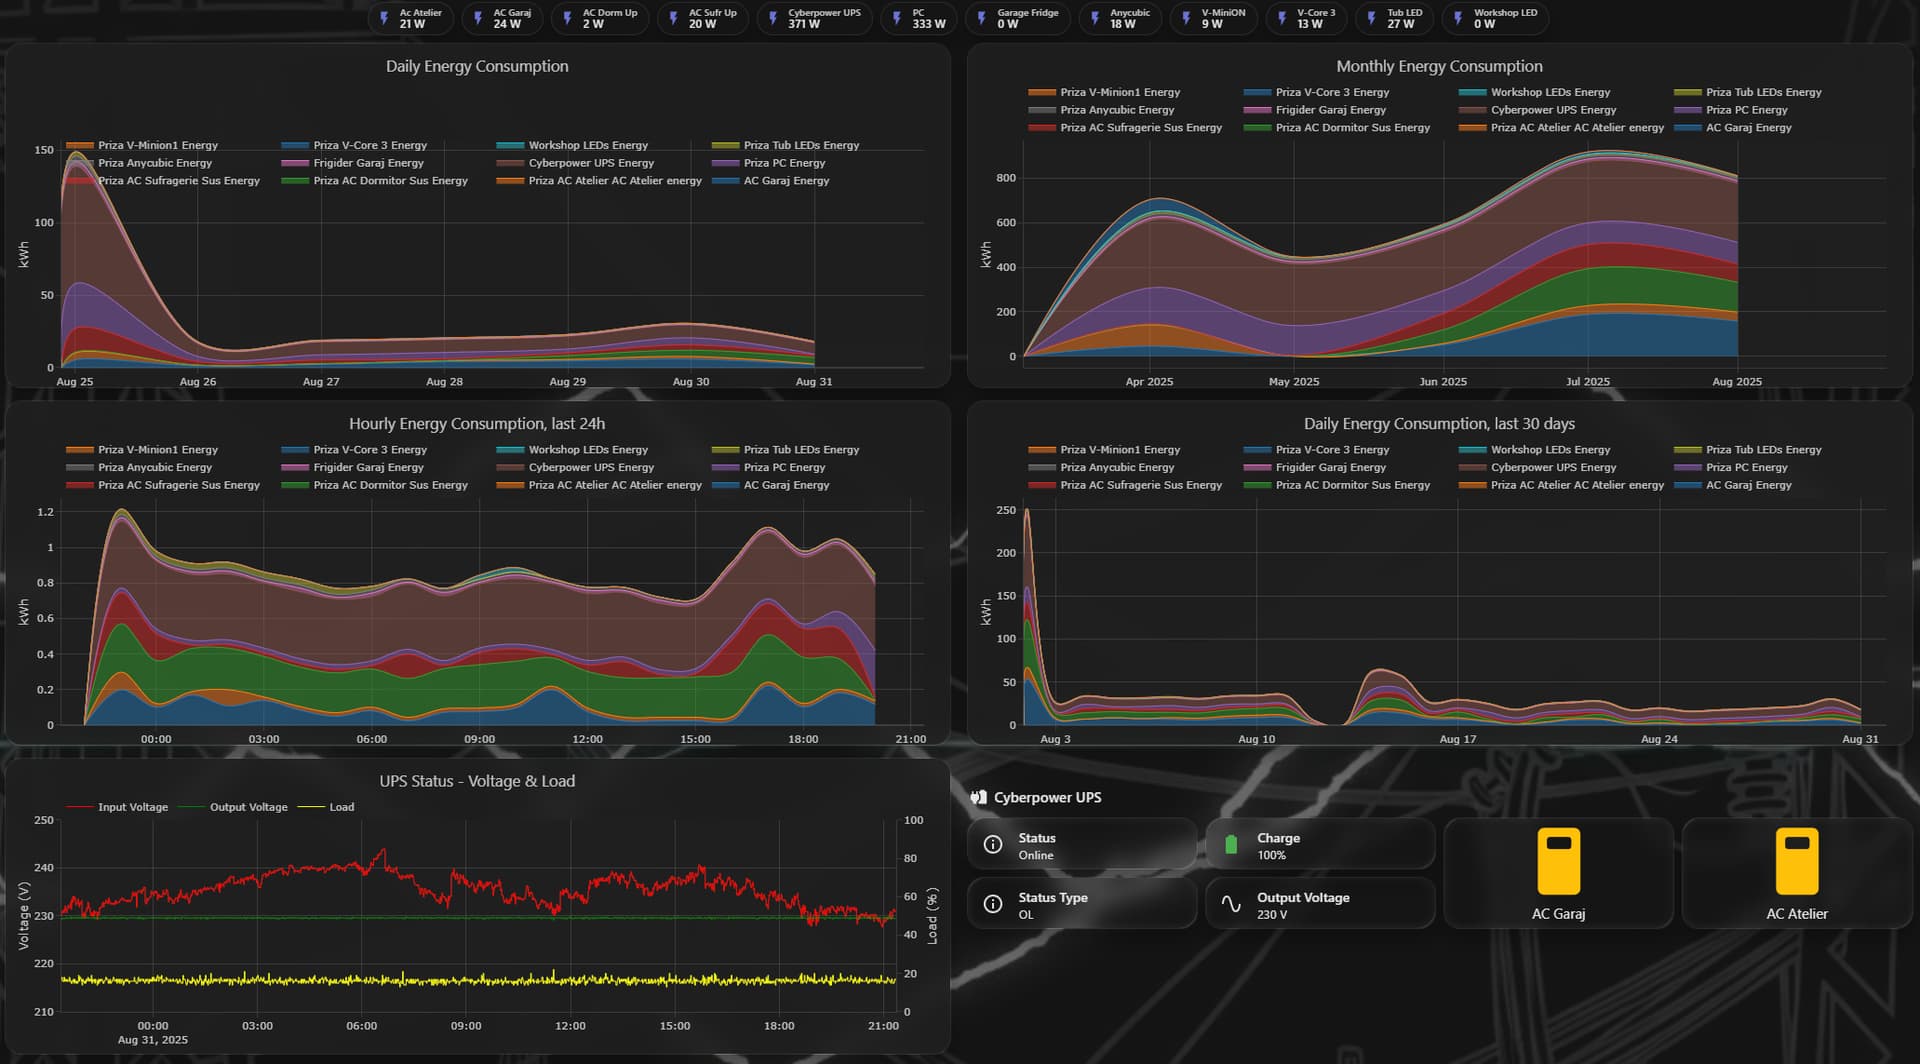
Power View
I am not yet fully happy with this view, it needs some improvement, but it works well enough for now. The first four graphs display energy consumption, as recorded through Shelly smart plugs. They use the Plotly Graph Card HACS component. The bottom-left graph is also a Plotly graph, which displays my UPS status. I also placed here two buttons which allow me to cut power off to my Garage and Workshop AC units, just in case.
Since I don’t yet have solar panels (they are planned, but some health issues need to be solved first, and they are costly), this is not of much importance, but it’s a foundation.
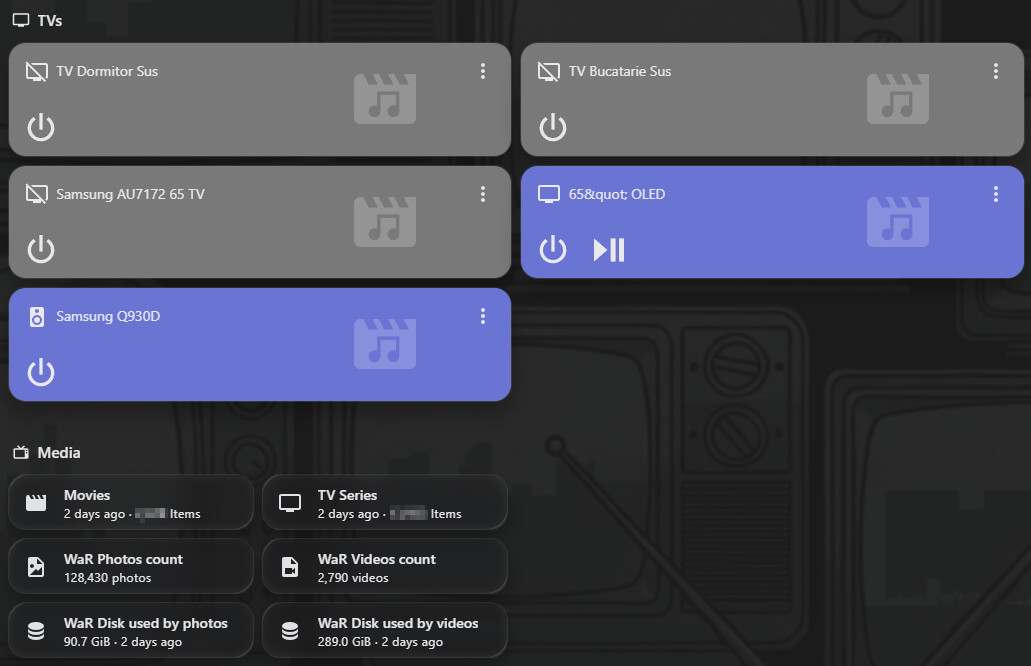
Media View
Simple view, really. It displays the status and some basic controls for my TVs and soundbar, as well as an overview of my media files.
This needs a lot of work, to be honest, because I am not satisfied with my Samsung integrations. But that’s another story for another time.
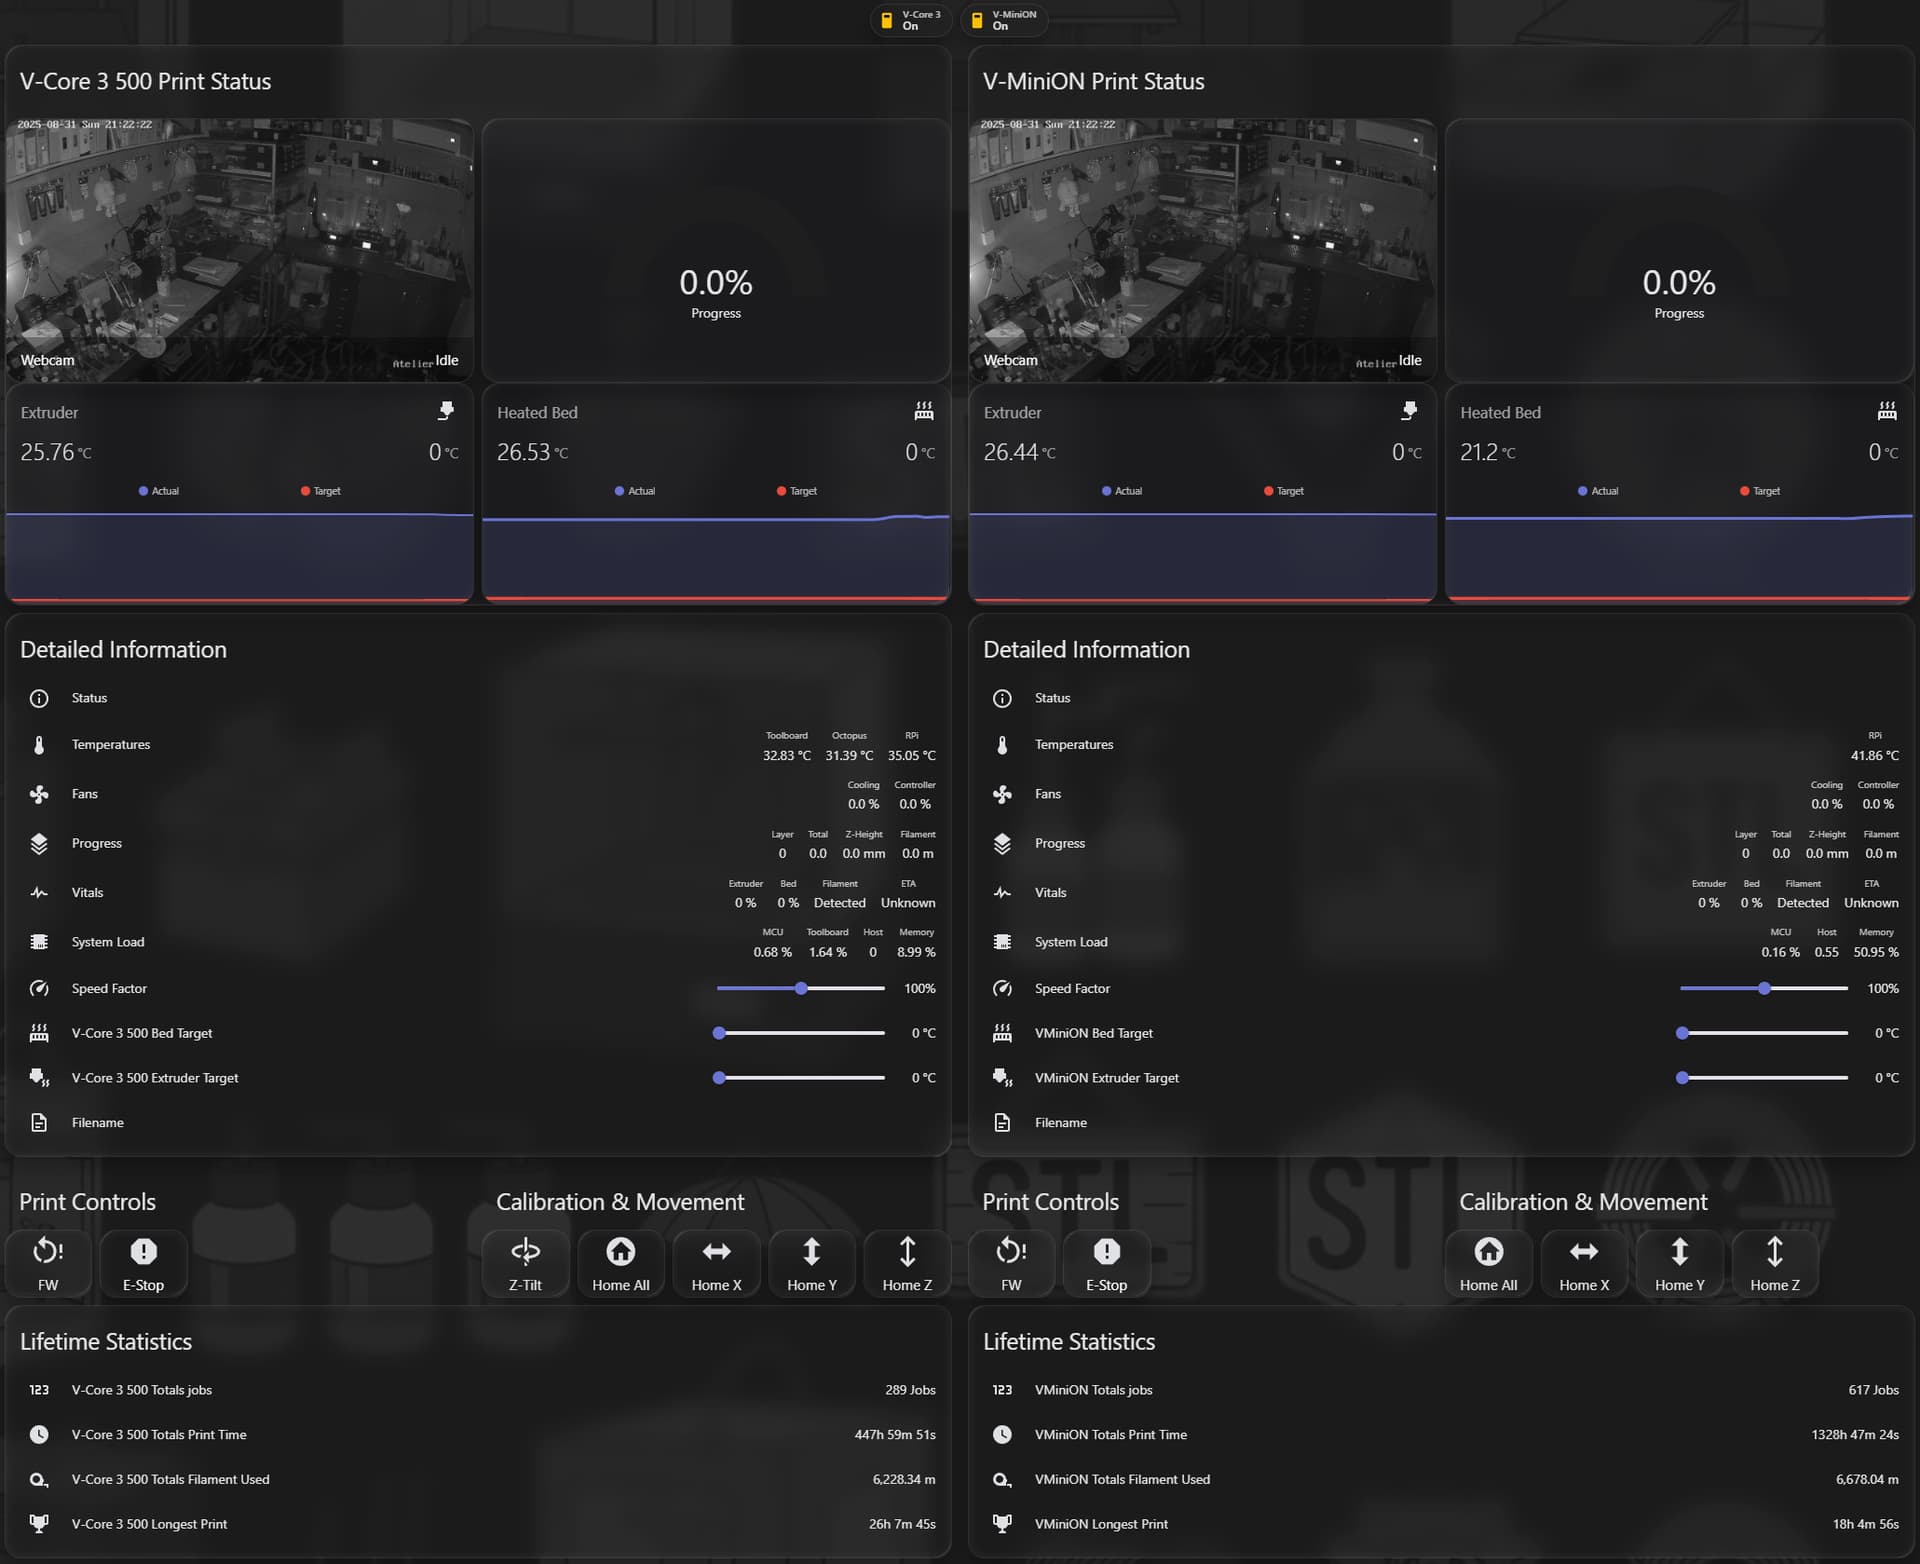
3D Printer View

Now, this is where the awesome Moonraker integration kicks in. It’s an awesome implementation, which allows me to monitor and control my 3D printers without accessing their separate webpages. A lot of details in the image, but this wouldn’t have been possible without the multiple-entity-row HACS card.
The two little buttons at the top allow me to turn the printers off and on. When a printer is turned off, everything related to it becomes hidden in the dashboard (apart from the on/off switch, of course). I have also added system log filters in configuration.yaml to avoid Moonraker connection error spamming, while the printer(s) are turned off.
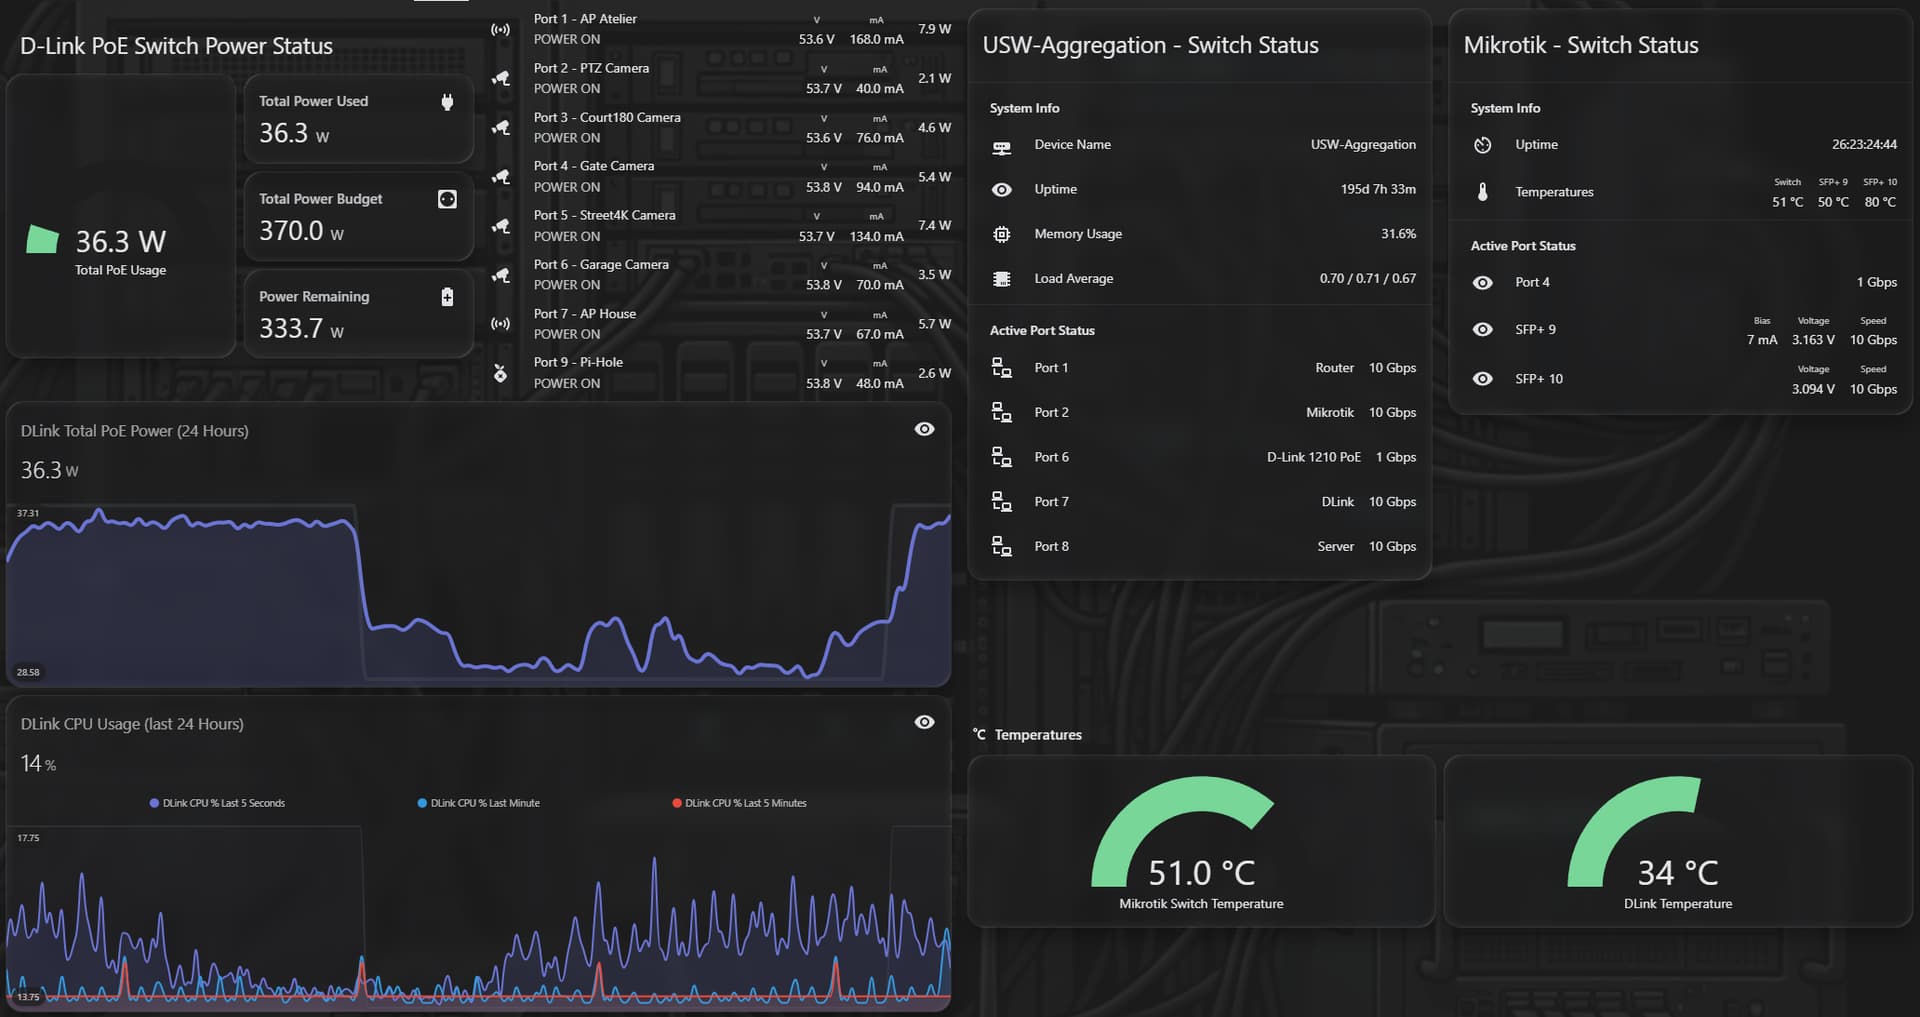
Wired Networking View
This is 100% SNMP integration. Yes, I know, SNMP is bad, SNMP should die, I’ve heard it all. Point is, it works.
The view allows me to see and monitor my wired network stack, such as PoE status, power consumption, temperatures, connectivity speed, the essentials.
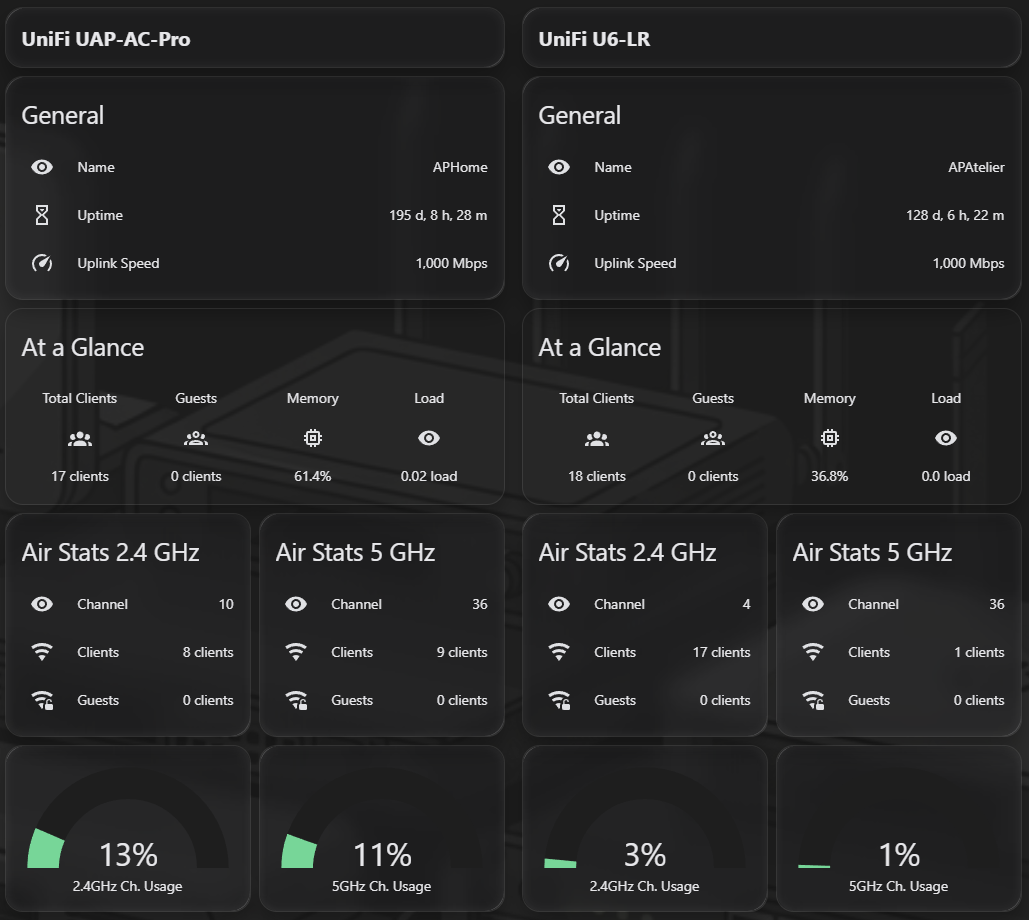
Wireless Networking View
A mix of UniFi Controller integration and SNMP data. Pretty straightforward. Each section you see there is actually a single “card of cards” ![]()
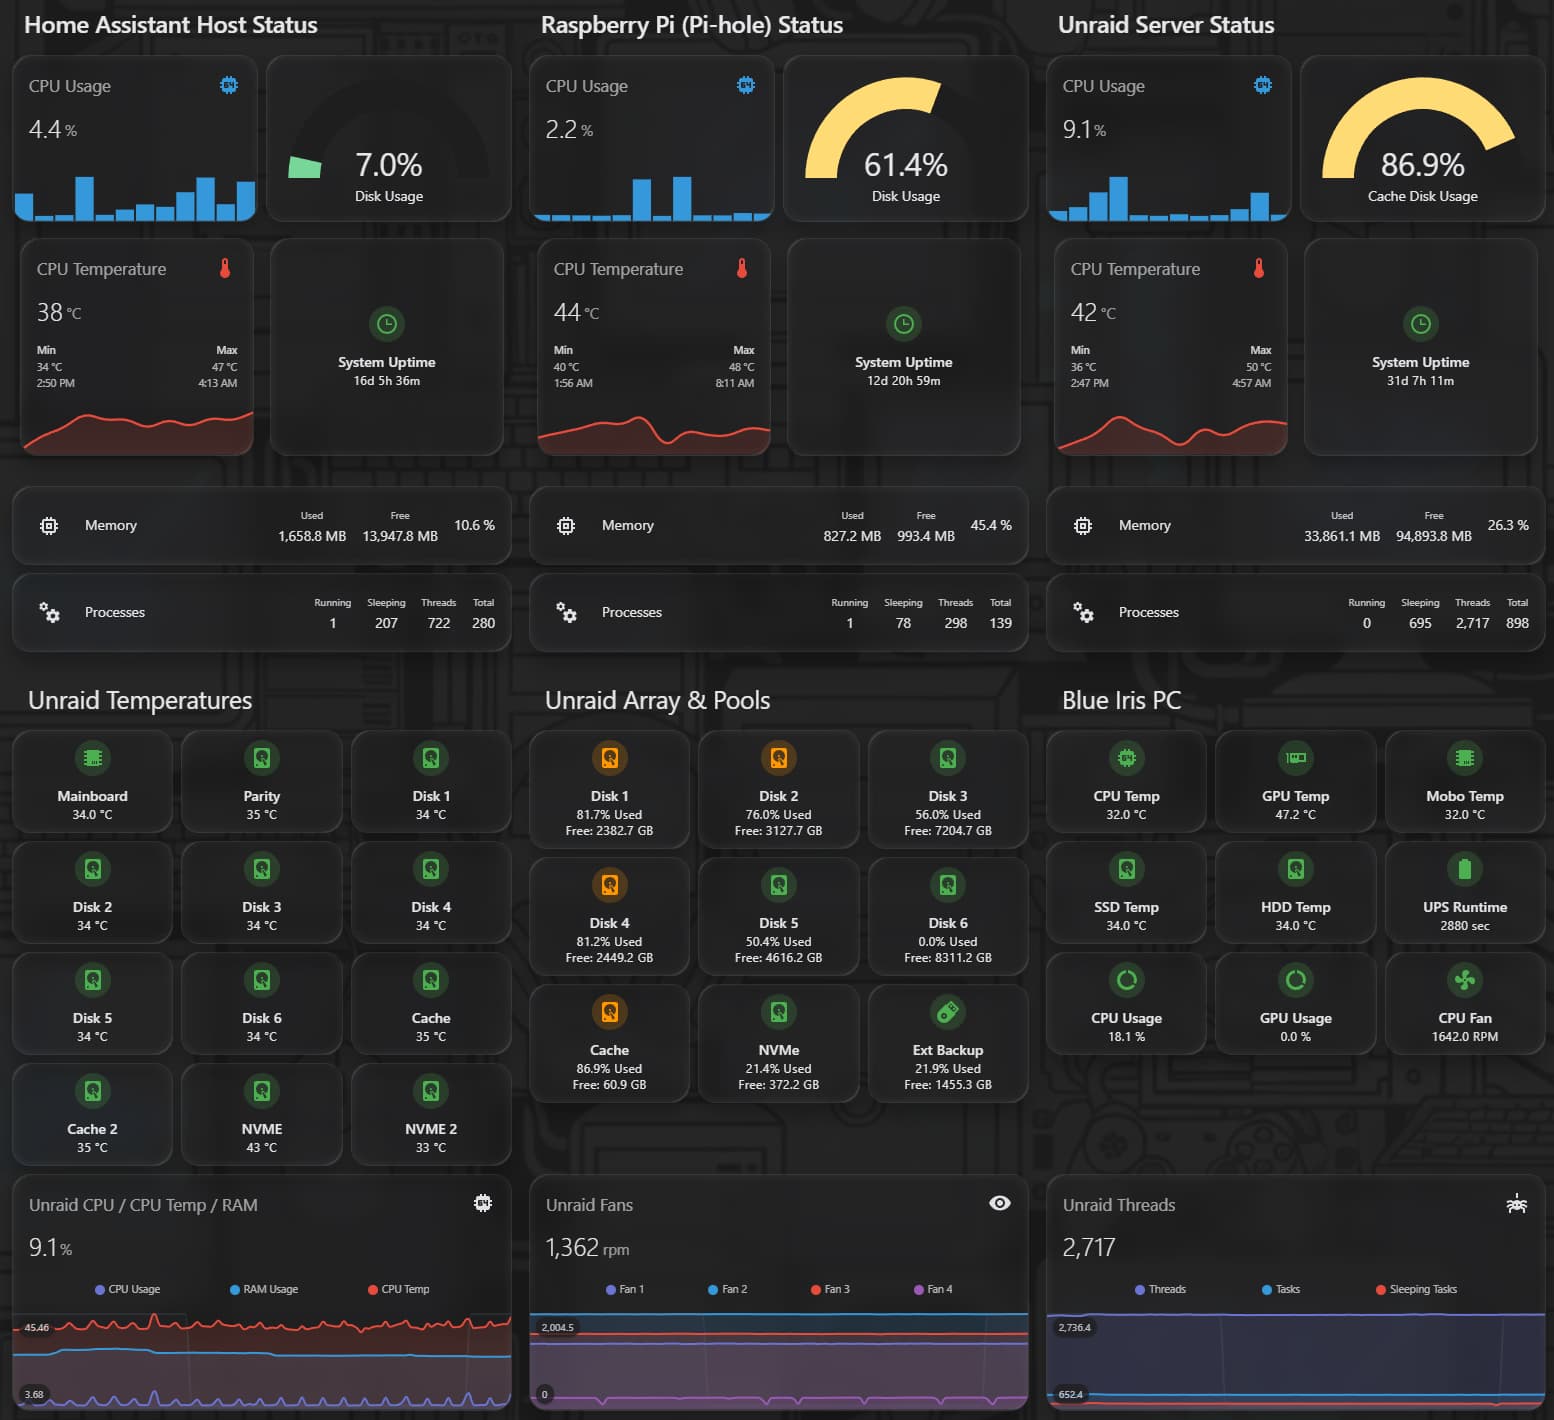
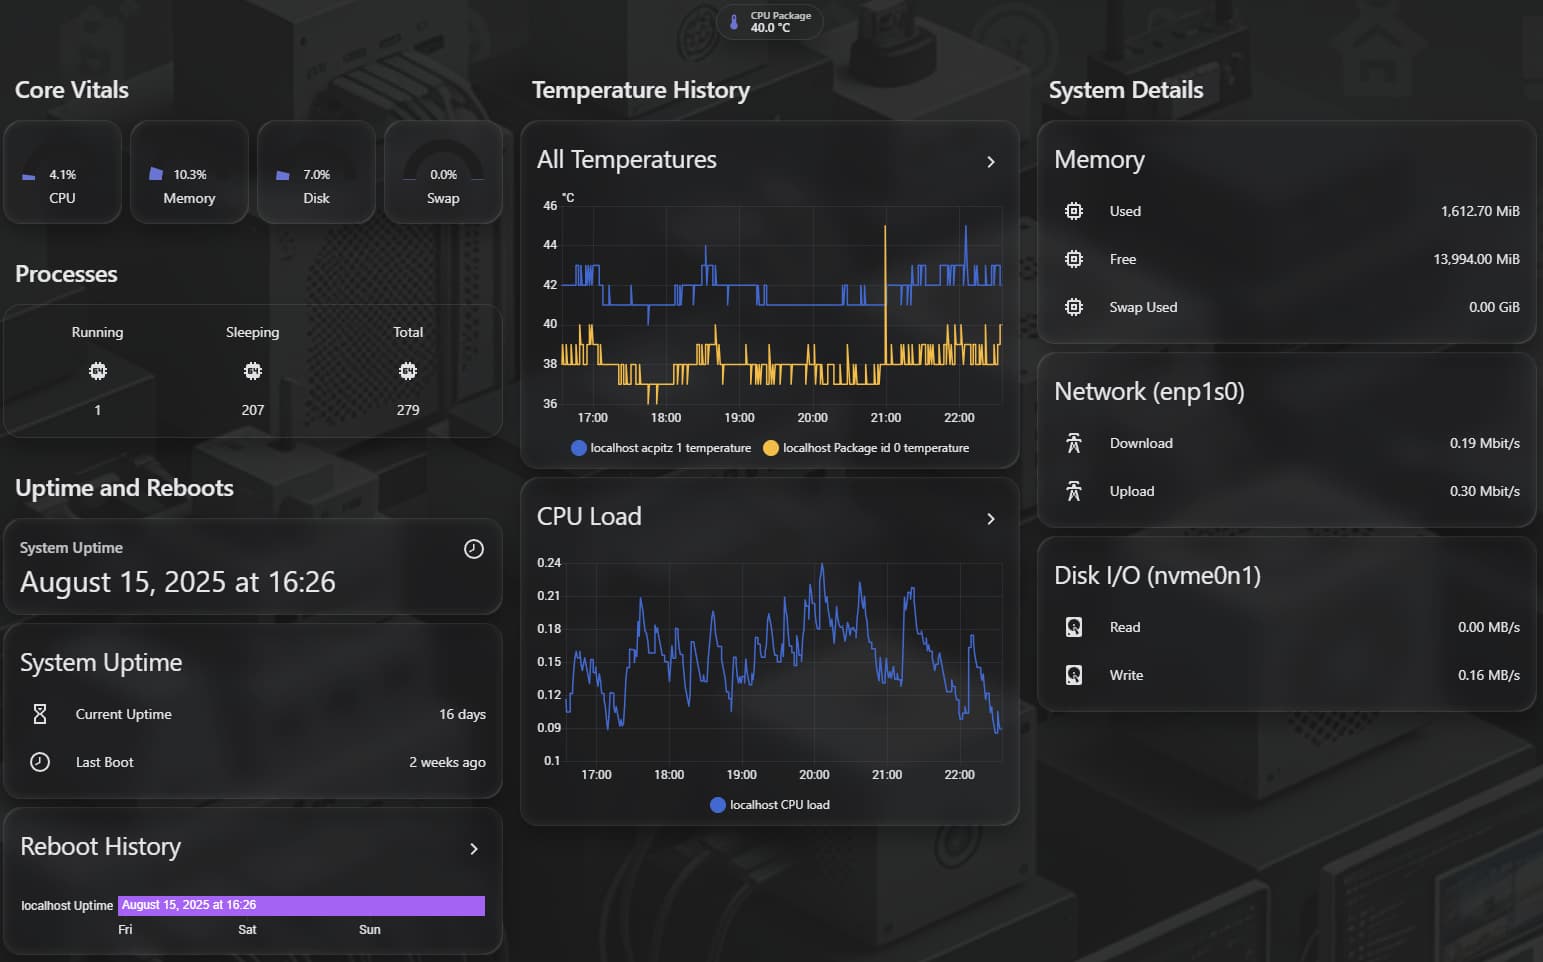
Host Monitoring
This view monitors four hosts:
- Home Assistant itself (via Glances)
- A Raspberry Pi 4 with my VPN server, Pi-Hole and the UniFi Controller (via Glances)
- My Unraid server (via Glances)
- My Blue Iris (Windows 11) host via fip-ha
Some views leverage the mushroom-template-card functionality. This enables me to see, at a glance, possible issues, e.g. if a disk becomes too full.
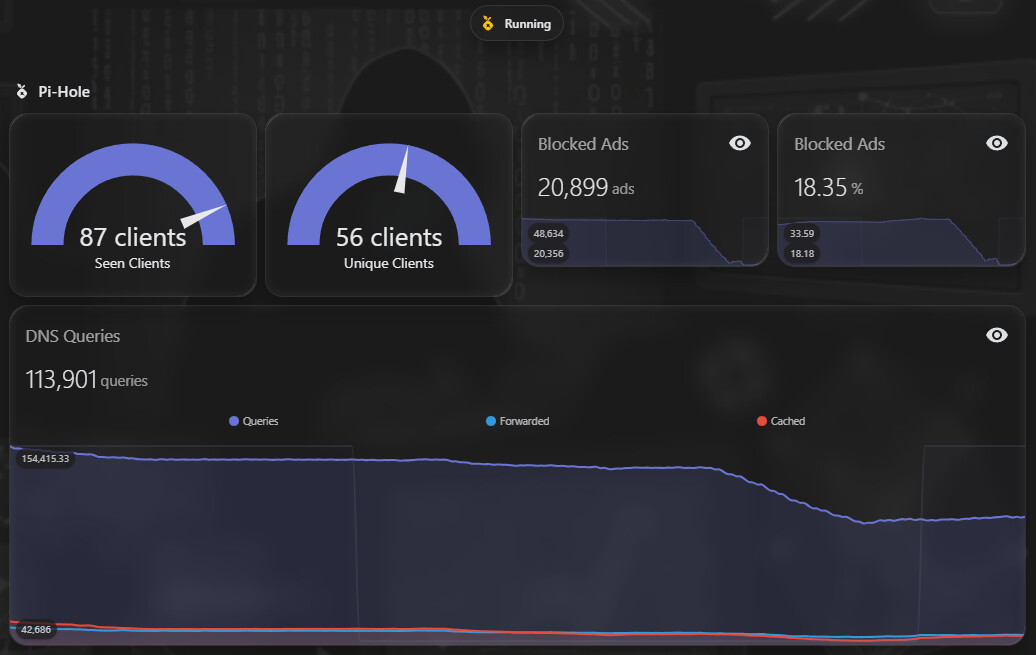
Pi-Hole information
Simple dashboard view, pretty rarely used, mmostly informational.
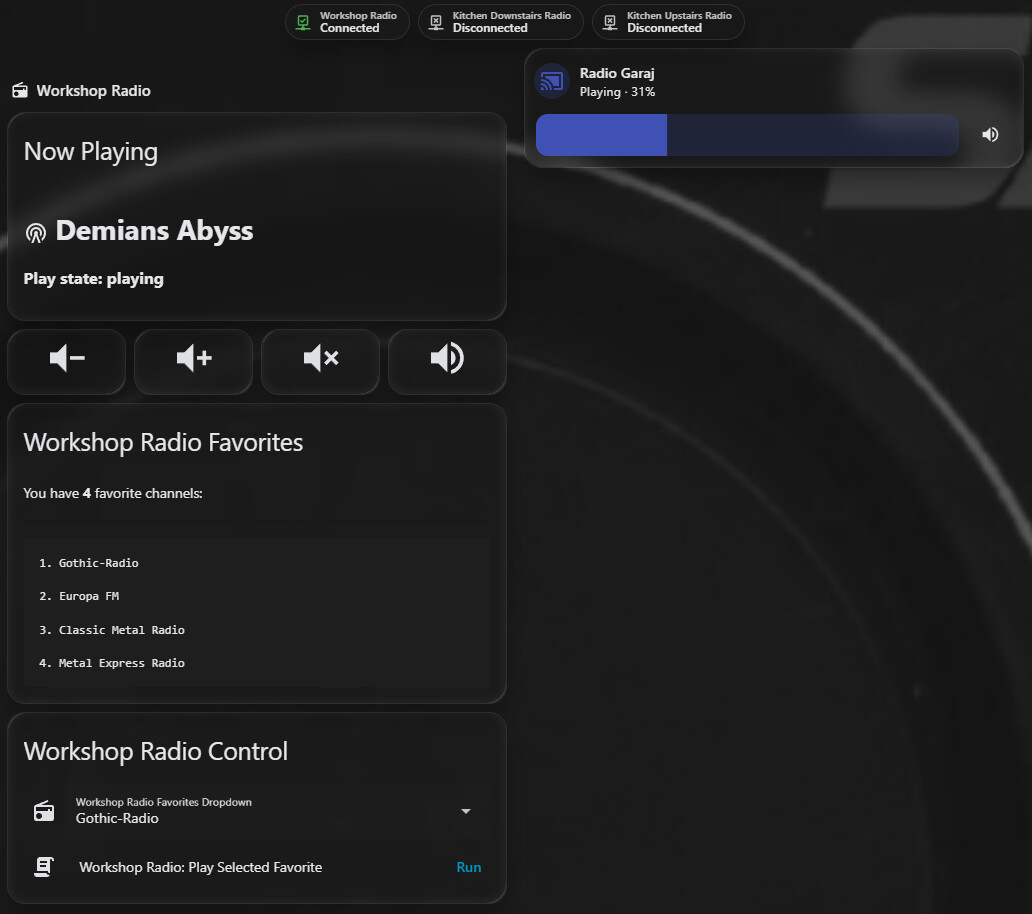
Radio Page
This is a set of custom integrations for my Internet-enabled radios. I have four such devices, and only one of them has a Media Player functionality.
Three Internet radios (SAL INR 5000)don’t have much functionality by default, except a very simple webpage which I integrated by analyzing their webpages and creating some RESTful custom YAML configs for them.
When they are offline, their Home Assistant controls are hidden and the RESTful error messages are filtered out of the System Logs.
The fourth one (Audizio Canzo) does have a Media Player component which is detected by Home Assistant. It’s pretty basic, but at least there’s something.
Home Assistant Host Troubleshooting monitoring
This is a temporary dashboard view, which I created shortly after buying the NUC. It was suddenly restarting and it corrupted the SQLite Database twice in a week. This dashboard view allowed me to see whether it suddenly rebooted overnight.
After some more troubleshooting and a revealing memtest86 run, it turned out the RAM was defecyive, so I replaced it, and after that, everything went back to normal. I should consolidate with the Host Monitoring view delete this dashboard page soon.
Home Assistant AI Log Analysis
This last view displays an analysis of my Home Assistant System log.
The issue displayed (Gree Air Conditioner Integration is Failing to Connect) stems from the stupid Gree AC Units which randomly decide to no longer respond to pings or any queries, until I force a wireless reconnect from my UniFi Controller.
I tried a couple automations, using entity states, but I wasn’t very successful, and I plan to switch to ping-based monitoring, which is flawless.
That concludes my current dashboard. If you have any questions, or would like me to detail some of the integrations, customizations and other shenanigans, feel free to post a comment.
If you have advice for further optimizing my configurations, ideas for nice custom cards to add, or anything, really, I’d much appreciate it. I am always open to discovering more ![]()