Advanced graph
remove what you don’t need
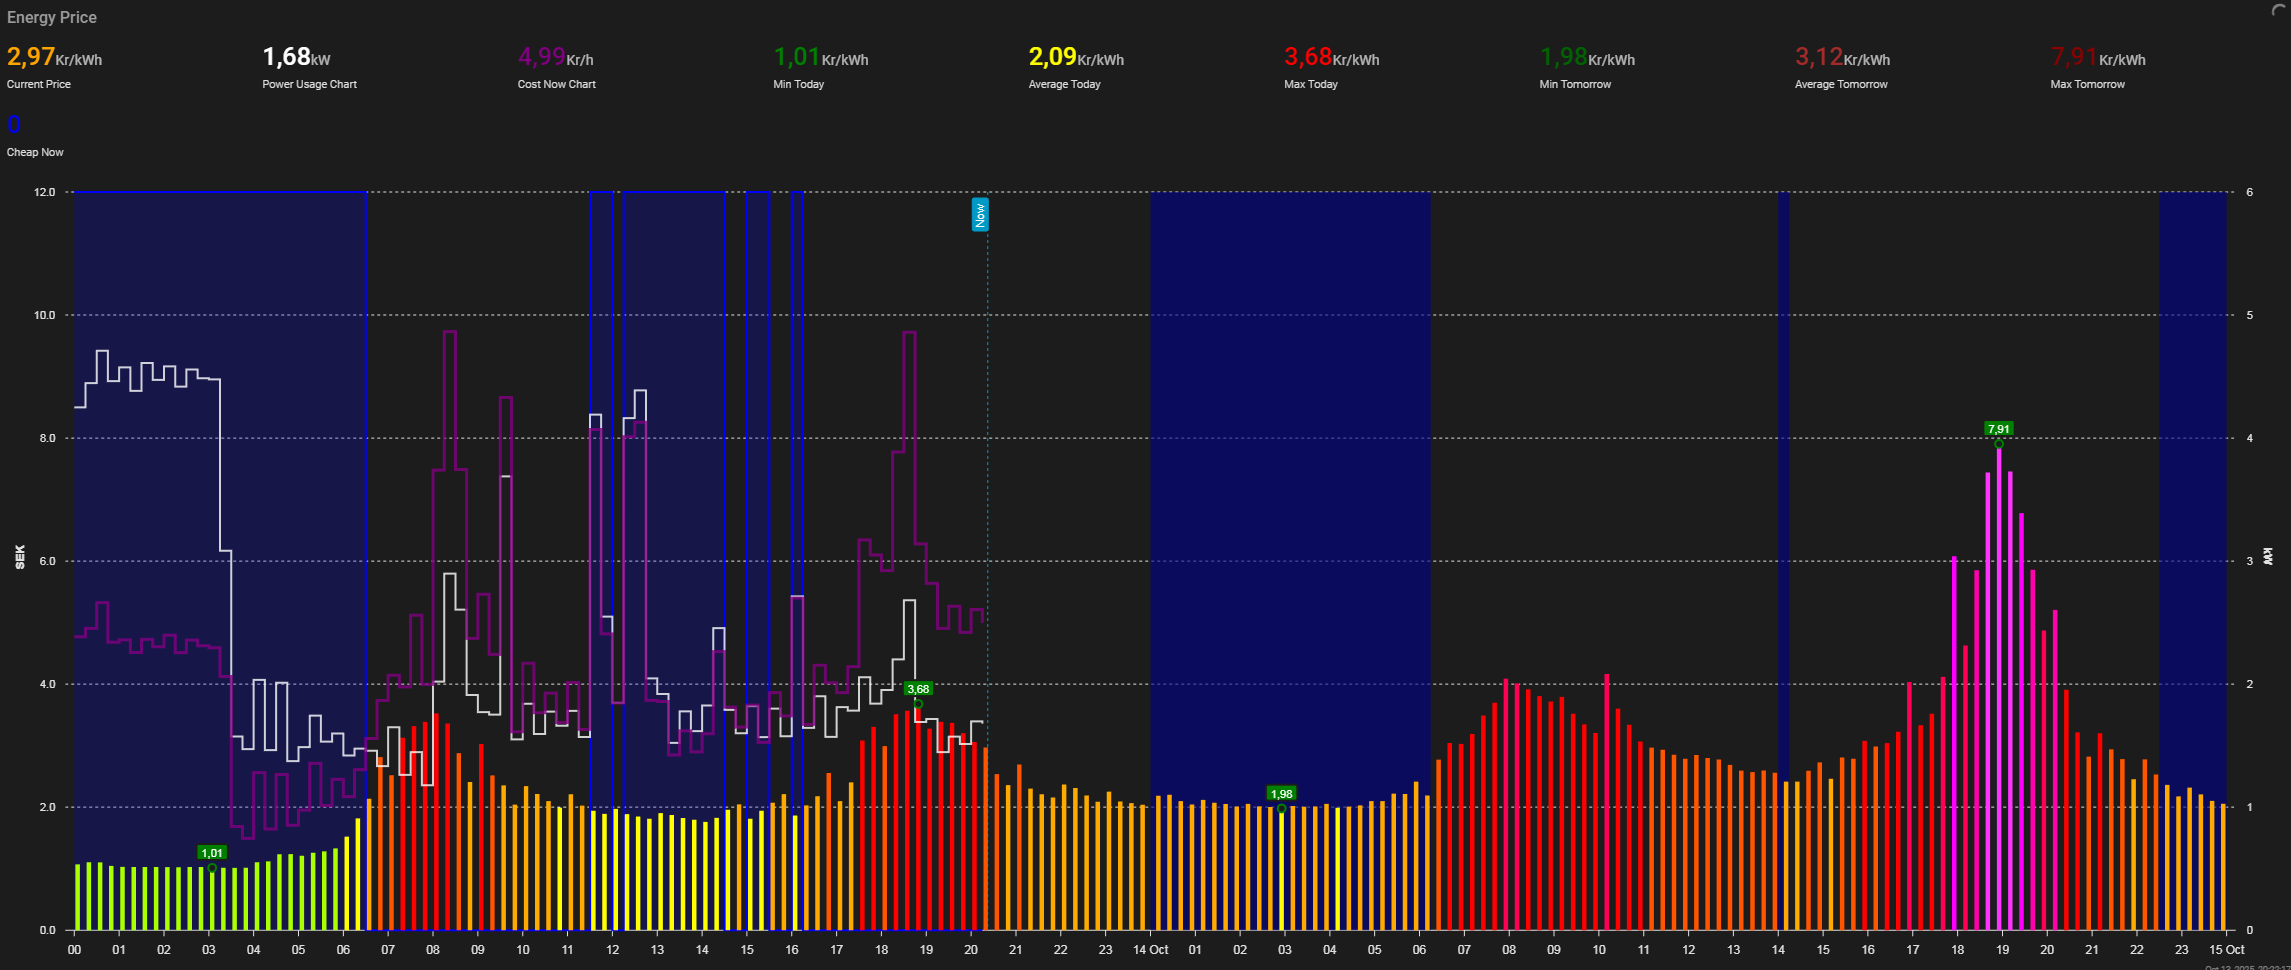
there is a power sensor. and i use Dynamic Energy Cost from HACS to calculate current price with the power used now.
the graph also shows future low price planning from aio energy management.
type: custom:apexcharts-card
experimental:
  color_threshold: true
apex_config:
  responsive:
    - breakpoint: 500
      options:
        chart:
          height: 300px
    - breakpoint: 1200
      options:
        chart:
          height: 640px
    - breakpoint: 3000
      options:
        chart:
          height: 800px
  legend:
    show: false
  title:
    floating: false
    align: center
    style:
      fontSize: 20px
      fontWeight: bold
  xaxis:
    labels:
      datetimeFormatter:
        hour: HH
  plotOptions:
    bar:
      columnWidth: 80%
      barGap: 3
graph_span: 2d
show:
  last_updated: true
header:
  title: Energy Price
  show: true
  show_states: true
  colorize_states: true
span:
  start: day
now:
  show: true
  label: Now
series:
  - entity: binary_sensor.my_cheapest_hours
    name: Cheapest
    type: area
    curve: stepline
    yaxis_id: CHEAP
    opacity: 0.6
    stroke_width: 0
    color: "#008"
    show:
      extremas: false
      in_header: false
    data_generator: |
      let data = [];
      let periods = entity.attributes.list || [];
      periods.forEach((p) => {
        let s = new Date(p.start).getTime();
        let e = new Date(p.end).getTime();
        data.push([s, 1]);    // jump up at start
        data.push([e, 1]);    // stay high until end
        data.push([e, 0]);    // drop straight down
      });
      return data;
  - entity: binary_sensor.my_cheapest_hours
    yaxis_id: CHEAP
    name: Cheap Chart
    transform: "return x === 'on' ? 1 : 0;"
    curve: stepline
    type: area
    opacity: 0.2
    stroke_width: 2
    extend_to: false
    group_by:
      func: avg
      duration: 15m
    color: "#00f"
    show:
      extremas: false
      in_header: false
  - entity: sensor.electricity_prices_today
    yaxis_id: SEK
    type: column
    show:
      extremas: true
      in_header: false
    float_precision: 2
    color: green
    color_threshold:
      - value: 0
        color: "#00ffaa"
      - value: 0.25
        color: "#00ff55"
      - value: 0.5
        color: "#00ff00"
      - value: 0.75
        color: "#55ff00"
      - value: 1
        color: "#aaff00"
      - value: 1.5
        color: "#ffff00"
      - value: 2
        color: "#ffaa00"
      - value: 2.5
        color: "#ff5500"
      - value: 3
        color: "#ff0000"
      - value: 4
        color: "#ff0055"
      - value: 5
        color: "#ff00aa"
      - value: 6
        color: "#ff00ff"
      - value: 7
        color: "#ff34ff"
      - value: 9
        color: "#ff65ff"
      - value: 11
        color: "#ff98ff"
      - value: 13
        color: "#ffccff"
      - value: 15
        color: "#ffffff"
    data_generator: |
      return entity.attributes.data.map((start, index) => {
        return [new Date(start["start"]).getTime() + 450000, entity.attributes.data[index]["value"]];
      });
  - entity: sensor.electricity_prices_tomorrow
    yaxis_id: SEK
    type: column
    show:
      extremas: true
      in_header: false
    float_precision: 2
    color: green
    color_threshold:
      - value: 0
        color: "#00ffaa"
      - value: 0.25
        color: "#00ff55"
      - value: 0.5
        color: "#00ff00"
      - value: 0.75
        color: "#55ff00"
      - value: 1
        color: "#aaff00"
      - value: 1.5
        color: "#ffff00"
      - value: 2
        color: "#ffaa00"
      - value: 2.5
        color: "#ff5500"
      - value: 3
        color: "#ff0000"
      - value: 4
        color: "#ff0055"
      - value: 5
        color: "#ff00aa"
      - value: 6
        color: "#ff00ff"
      - value: 7
        color: "#ff34ff"
      - value: 9
        color: "#ff65ff"
      - value: 11
        color: "#ff98ff"
      - value: 13
        color: "#ffccff"
      - value: 15
        color: "#ffffff"
    data_generator: |
      return entity.attributes.data.map((start, index) => {
        return [new Date(start["start"]).getTime() + 450000, entity.attributes.data[index]["value"]];
      });
  - entity: sensor.electricity_prices_today
    name: Current Price
    yaxis_id: SEK
    float_precision: 2
    show:
      in_header: true
      in_chart: false
    unit: Kr/kWh
    color: orange
  - entity: sensor.total_power
    yaxis_id: kW
    name: Power Usage Chart
    color: white
    opacity: 0.8
    float_precision: 2
    show:
      extremas: false
      in_header: true
    type: line
    curve: stepline
    stroke_width: 2
    extend_to: false
    unit: kW
    transform: return x /1000;
    group_by:
      func: avg
      duration: 15m
  - entity: sensor.total_real_time_energy_cost
    name: Cost Now Chart
    yaxis_id: SEK
    float_precision: 2
    show:
      extremas: false
      in_header: true
    unit: Kr/h
    type: line
    curve: stepline
    stroke_width: 3
    color: purple
    opacity: 0.8
    extend_to: false
    group_by:
      func: avg
      duration: 15min
  - entity: sensor.electricity_prices_today
    attribute: min
    name: Min Today
    yaxis_id: SEK
    float_precision: 2
    show:
      in_header: true
      in_chart: false
    unit: Kr/kWh
    color: green
  - entity: sensor.electricity_prices_today
    attribute: mean
    name: Average Today
    yaxis_id: SEK
    float_precision: 2
    show:
      in_header: true
      in_chart: false
    unit: Kr/kWh
    color: yellow
  - entity: sensor.electricity_prices_today
    attribute: max
    name: Max Today
    yaxis_id: SEK
    float_precision: 2
    show:
      in_header: true
      in_chart: false
    unit: Kr/kWh
    color: red
  - entity: sensor.electricity_prices_tomorrow
    attribute: min
    name: Min Tomorrow
    yaxis_id: SEK
    float_precision: 2
    show:
      in_header: true
      in_chart: false
    unit: Kr/kWh
    color: darkgreen
  - entity: sensor.electricity_prices_tomorrow
    attribute: mean
    name: Average Tomorrow
    yaxis_id: SEK
    float_precision: 2
    show:
      in_header: true
      in_chart: false
    unit: Kr/kWh
    color: brown
  - entity: sensor.electricity_prices_tomorrow
    attribute: max
    name: Max Tomorrow
    yaxis_id: SEK
    float_precision: 2
    show:
      in_header: true
      in_chart: false
    unit: Kr/kWh
    color: darkred
  - entity: binary_sensor.my_cheapest_hours
    yaxis_id: CHEAP
    name: Cheap Now
    transform: "return x === 'on' ? 1 : 0;"
    color: "#00f"
    show:
      in_header: true
      in_chart: false
yaxis:
  - id: SEK
    min: 0
    max: ~12
    apex_config:
      tickAmount: 6
      forceNiceScale: true
      title:
        text: SEK
  - id: kW
    min: 0
    max: ~6
    decimals: 0
    apex_config:
      tickAmount: 6
      forceNiceScale: true
      opposite: true
      title:
        text: kW
  - id: CHEAP
    min: 0
    max: 1
    show: false
    apex_config:
      tickAmount: 6
      forceNiceScale: true