Since yesterday, I can’t see the topology. instead see these options which I did not see before. if I click reload, it just spins. on the Status
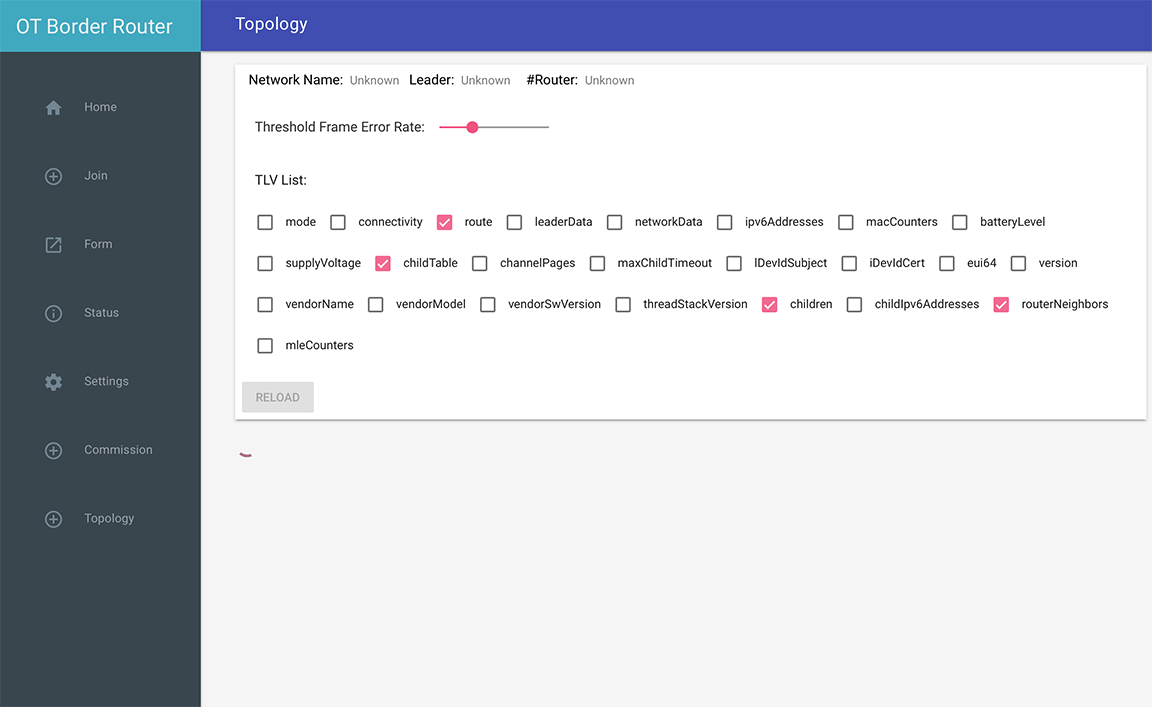
section, everything is correct. Something changed?
Since yesterday, I can’t see the topology. instead see these options which I did not see before. if I click reload, it just spins. on the Status
There was an update to addons/openthread_border_router at master · home-assistant/addons · GitHub in the past couple of days.
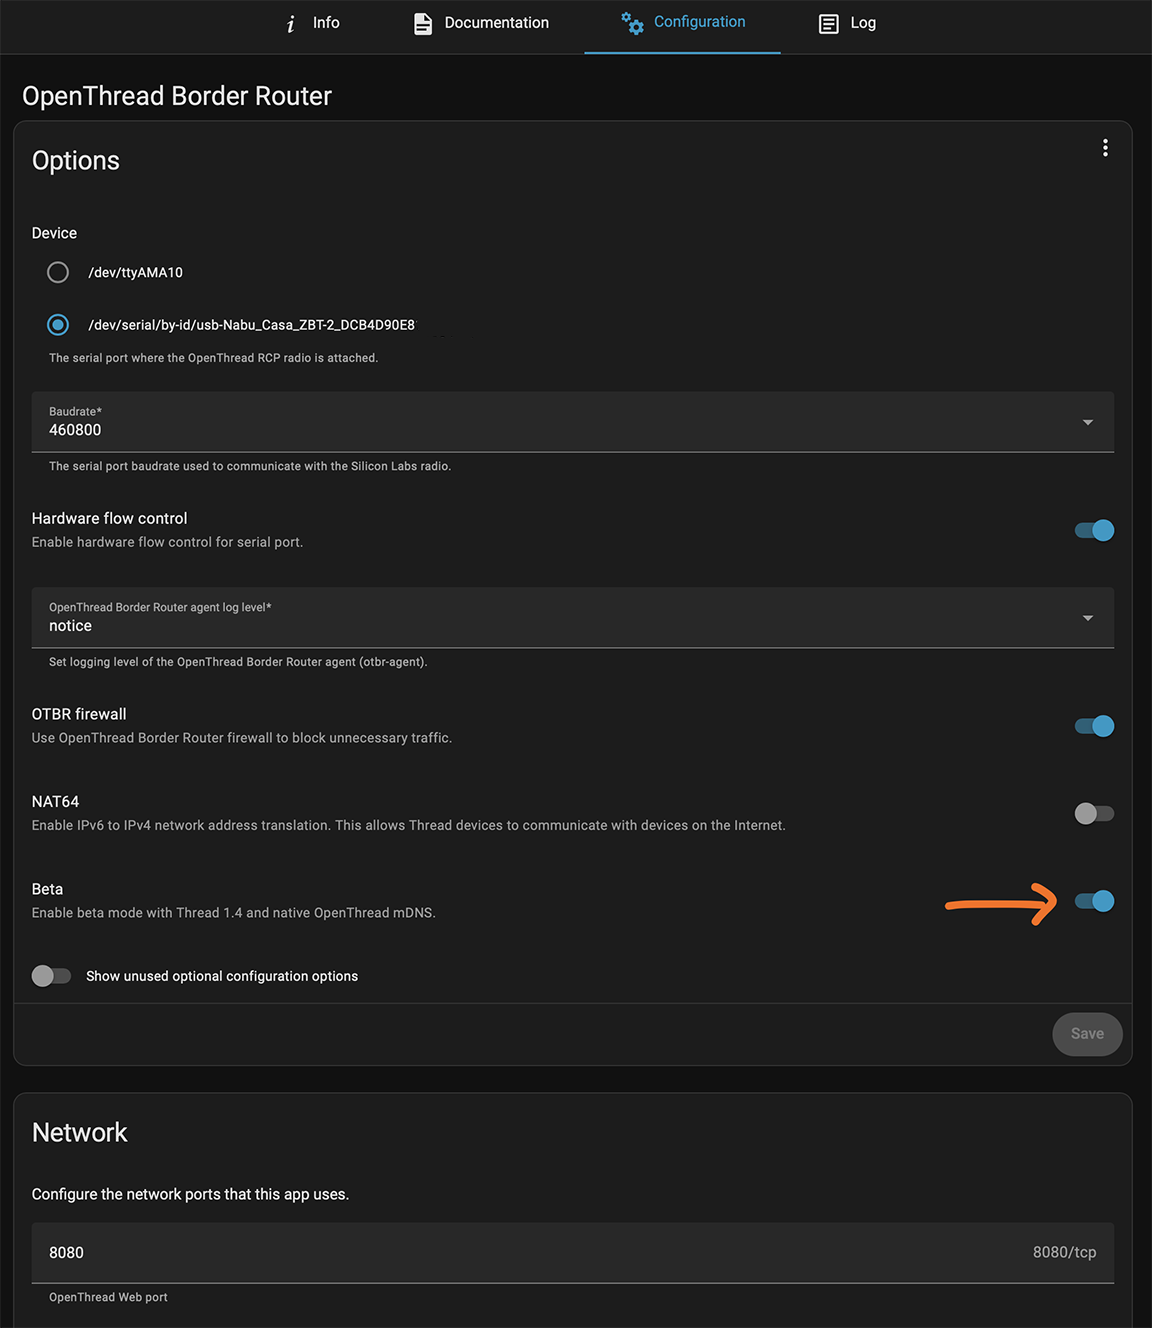
Ok, I found out why. I had enabled beta mode. when I disable it, it works again.
But still, why? it says “Enable beta mode with Thread 1.4 and native OpenThread mDNS.”
Are these topics related?
I don’t think so.
I had tried the Beta with 2.16.1 and the result was a mess. Although I could still use the Matter devices, the HA old border router was replaced by a new one without TLV. No way to sync credentials. Switching off the Beta didn’t help either. In the end I rolled back my Proxmox image.
This time with 2.16.3 I didn’t dare to switch to beta yet.
If you use the beta with thread 1.4, you also need to update your radio firmware to the beta that supports thread 1.4.
I do see the same issue with the TLV not displaying in the thread integration, but it shows up fine with the ot-ctl dataset active -x command.
Syncing credentials still works for me as well.
Thank you for the explanation. I think I will wait for further progress at the Thread front before updating my ZBT-1 with a beta.
Did you notice any advantage with Thread 1.4?
I guess sharing network thread credentials between ecosystems is supposed to be one of the main benefits, but I don’t think you can actually do that yet without further changes in HA.
I previously had an existing Google Home when I set up OTBR which created it’s own network, and I used the OTBR network as default, which meant I had to wipe Google Play Services to import the new thread credentials. After I did that though, I factory reset the Google Home Hub and it ended up using my OTBR network and credentials automatically.
If I understand it correctly, this would now be possible without a factory reset of the hub. OR, the OTBR network could have been joined to the GH Hub. I guess there’s some other network connectivity stuff that’s improved as well, but I don’t have any thread devices that talk to their clouds.
This is the topology from Matter.js. Mine is always wrong. it even shows router I removed, and reset, and unplugged from my network. I was talking about the OT Border Router app topology (http://:8080).
I used the beta, because the non-beta keeps crashing once a day. But I realized the beta crashes as well.
I think its visual bug ? Mine show leader node as a router
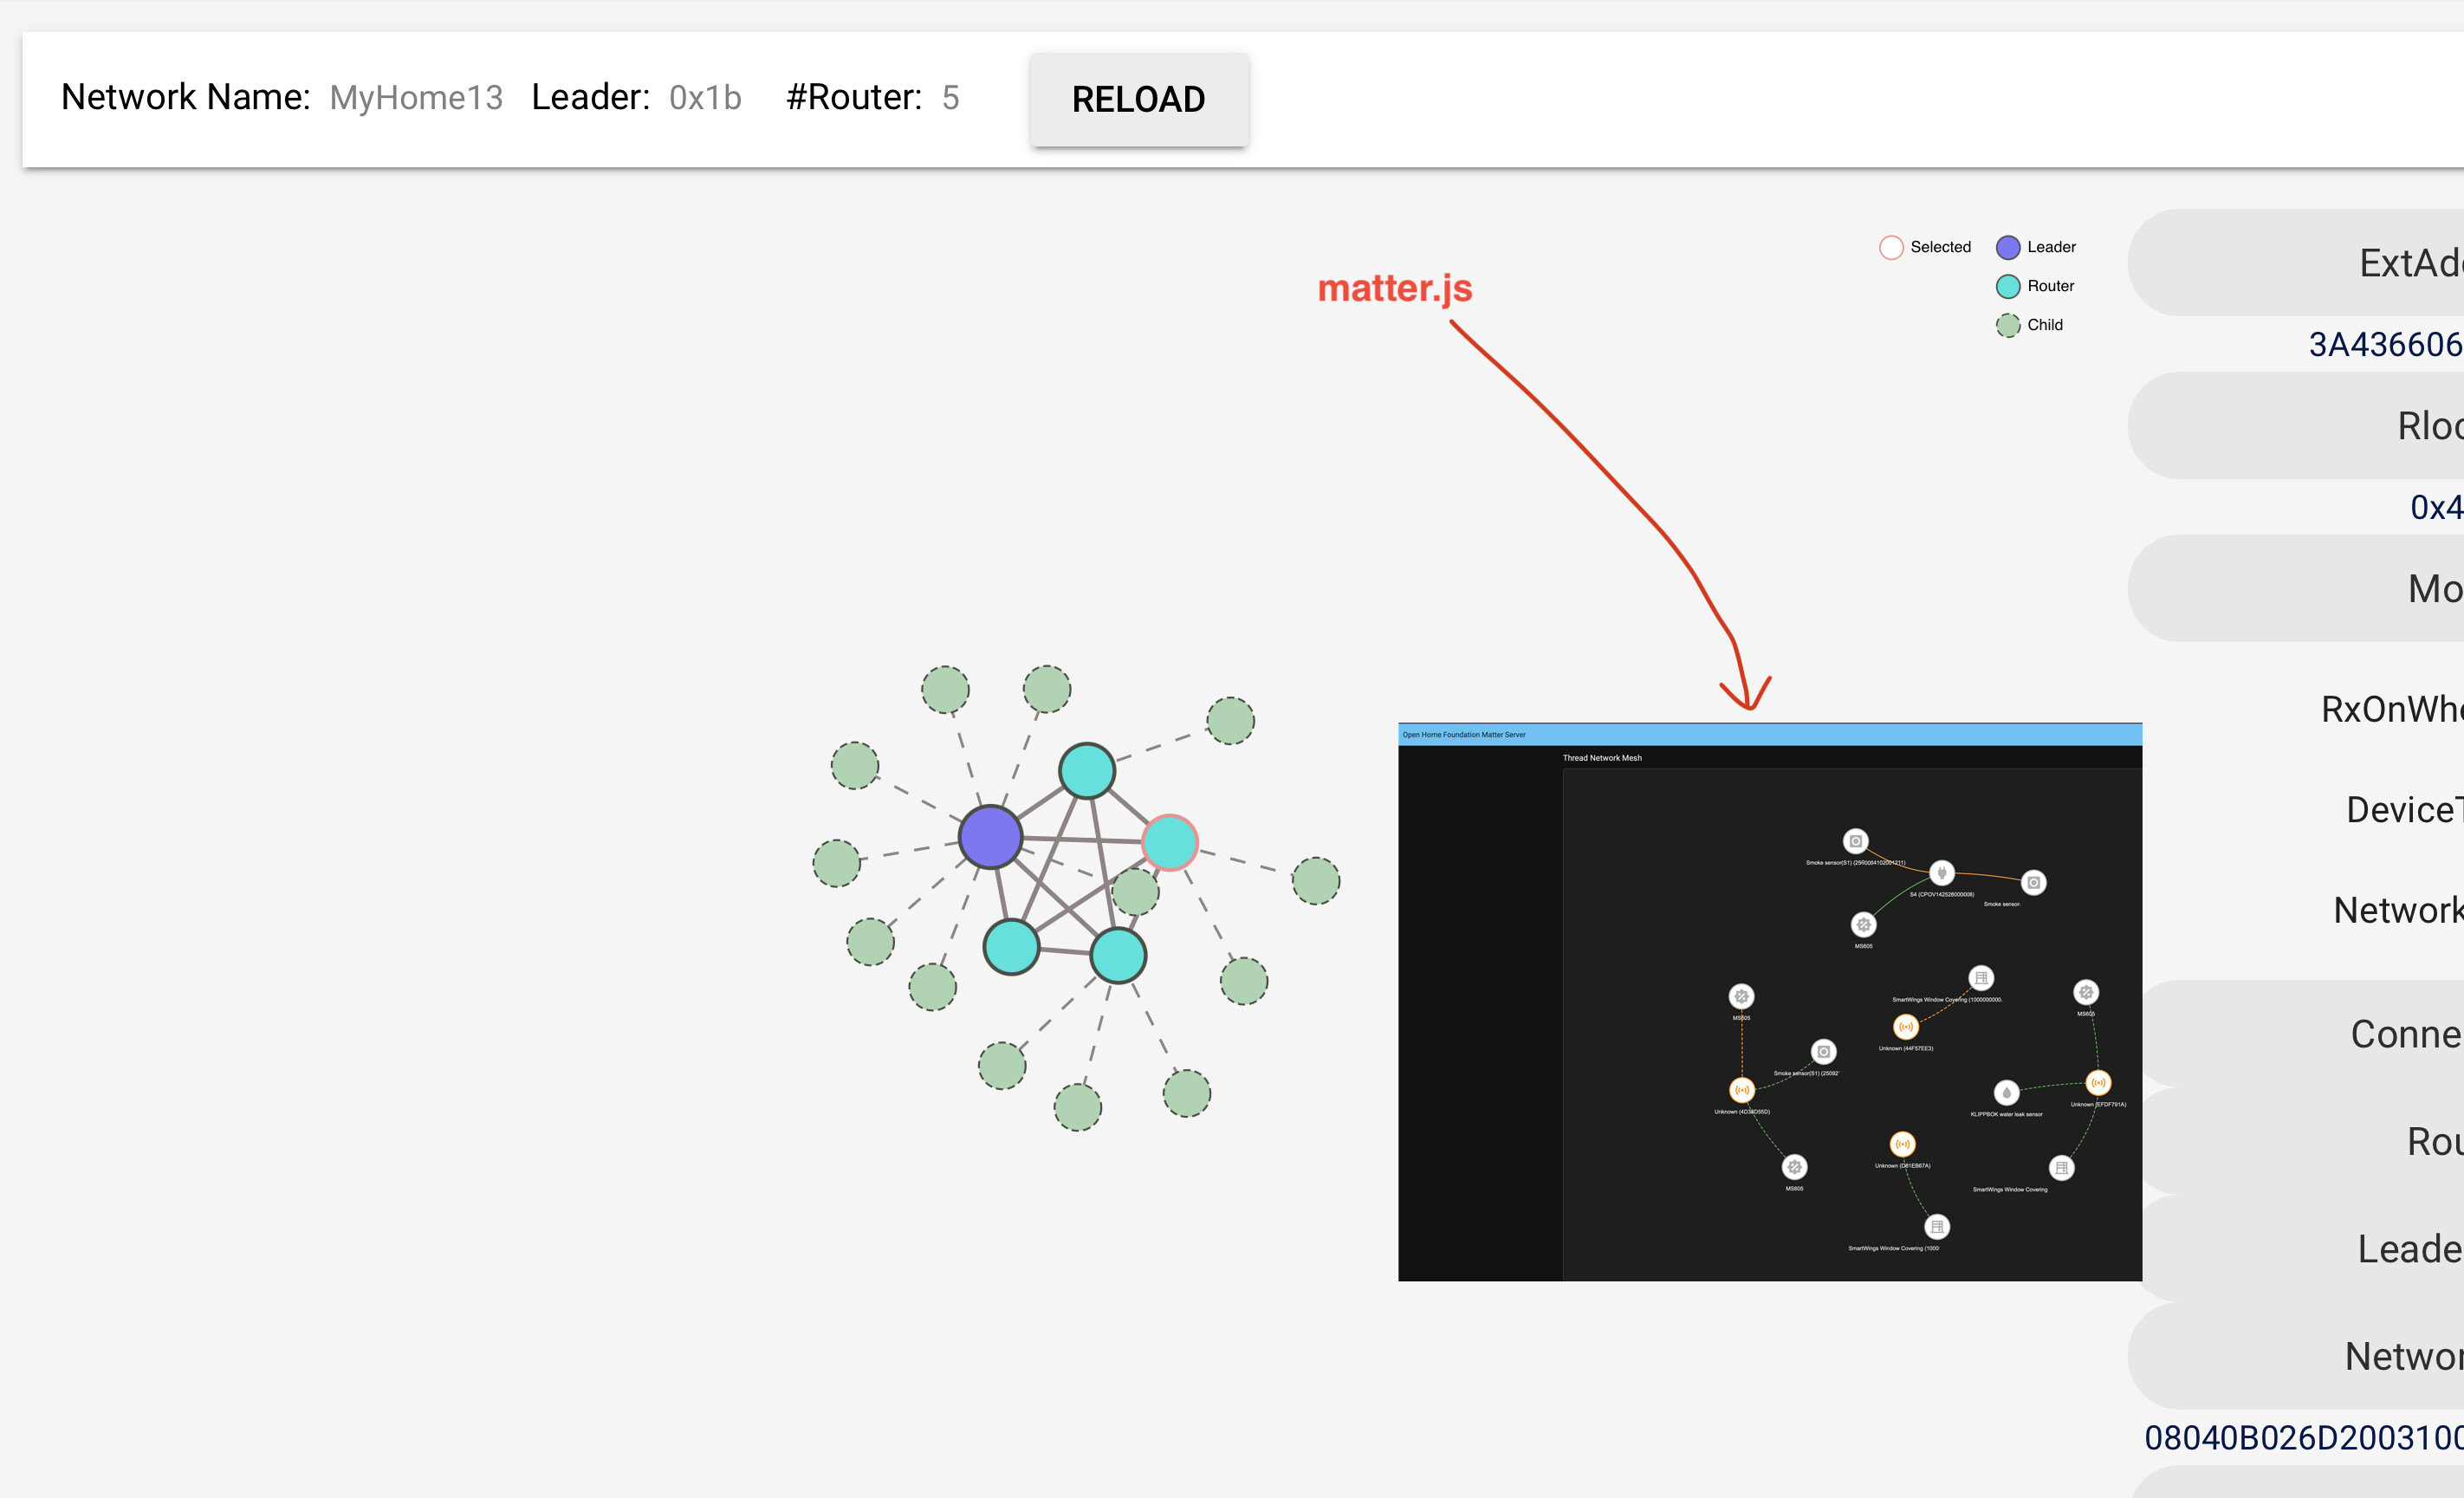
these two snapshot are from the same network same time. one with matter.js. one OTBR. matter.js is making things up?
not really making things up since its data is fetch from connected matter device directly. matter js doesn’t depend on otbr rest api to build its own map afaik. so different data source might be the reason why.
so what is the solution, find out what the node it, and reset, re-commision? Why would the node report a non-existing leader?
can you check browser developer tools when accessing topology page and confirm that network request to port 8081 is failing ? what otbr addon version do you have ?
I’m confused…again, the OBTR topology is correct. I use addon ver 2.16.3. the matter.js topology is not correct. maybe this is the wrong thread (no pun intended)? Apps → Matter Server → Web UI → Thread
I was thinking that you might have this issue, but after you reply your otbr version, i am not sure anymore. Just to be clear, i was referring to your first post in this thread. For matter js, i haven’t used it. From some reading in matter js readme, i saw it use different method of gathering data than otbr to build network graphs, so it is expected for network graph to be different.
Yes, it does indeed use a different method. But it’s buggy or just not useful if it shows state information. Anyway, thanks for your help!
Just a “me too”, with later software, OTBR 2.16.5 and Matter Server 8.3.0.
I get part of my Thread mesh in the topology diagram, and it varies each time I hit reload. The image below is typical with three routers and six child devices shown by OTBR. Using Matter Server the total is closer to 32, matching my device list.
In the image, the Matter Server version is on the left and OTBR version on the right. Turning the Beta on or off did not make a big difference.
Side note: My ZBT-1 reports firmware “OpenThread RCP 2.7.2.0” and everyone online seems to be talking about 7.4.something. I should probably try to understand the difference.
I just started having the same issues. My OTBR topology no longer shows the total of my thread routers and thread border routers. I have a total of 17 thread routers including 7 thread border routers and 10 thread routers.
The OTBR topology displays random numbers that do not show the actual total number. This started after I added 8 IKEA Grillplats plugs on March 19, 2026.
Strangely enough, the log of my HA Open Thread Border App (formerly known as Addon) shows the true number.
Additionally, Eve app shows the actual total number being pulled from my Apple Home which syncs its credentials with HA. Equally, new Matter server app’s thread visualization shows the actual total number.