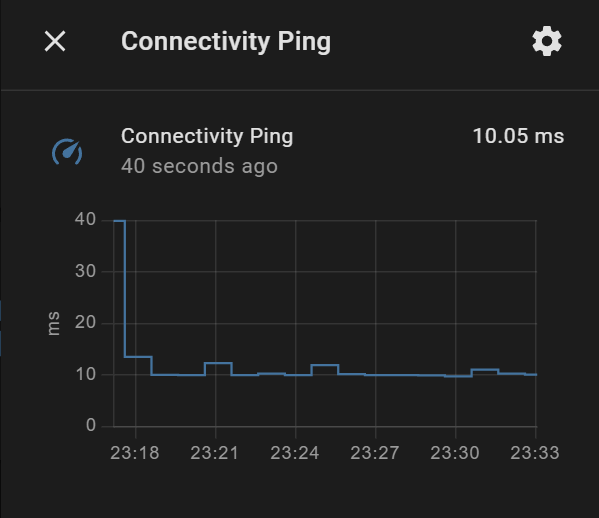
What card did you use to do that?
That is the mini-graph card.
color_thresholds:
  - color: '#e45e65'
    value: 40
  - color: '#e0b400'
    value: 30
  - color: '#0da035'
    value: 20
  - color: '#039BE5'
    value: -1
color_thresholds_transition: hard
entities:
  - entity: sensor.ping
group: false
height: 300
hour24: true
line_width: 4
name: Ping
points_per_hour: 10
show:
  extrema: true
  average: true
  fill: fade
  icon: true
  labels: false
  name: true
  state: true
type: custom:mini-graph-card
I am trying to replicate what you did but am having issues. The card shows NaN and I am not sure the system is even pinging or returning the latency values.
I configured the ping per the official instructions and rebooted the system:
binary_sensor:
  - platform: ping
    host: 8.8.8.8
    name: "Google DNS Ping"
    count: 5
    scan_interval: 60
I noticed your YAML referenced a ‘sensor’ instead of ‘binary_sensor’ so I am hoping you could help me a bit further.
I am having quite a few networking issues thanks to beta Unifi (networking equipment) firmware so I am hoping this card will help me eliminate networking issues when having HASS issues.
@parautenbach The instructions you referenced are the ones I used. I see it talks about attributes and I believe I need to use templates to use them but being only 1 month into HASS, I am not sure I fully understand how to do that yet.
You’re half way there. The binary sensor has an attribute for round trip time (have a look at it in Developer Tools / States). Unfortunately the mini-graph card can’t use attributes, so we need to make a template sensor:
template:
  - sensor:
      - name: "Ping"
        icon: "mdi:speedometer"
        unit_of_measurement: "ms"
        state: "{{ state_attr('binary_sensor.ping', 'round_trip_time_avg')|round(2) }}"
@tom_l Awesome, it worked! Thank you so much!
Not sure why the Max is 39.88ms given a recursive ping to 8.8.8.8 pretty much never deviates from 8ms. Anyhow, we’ll see what it says after a longer run period.
If you click on the graph it will give you a more detailed view in the pop-up. You can expand the pop-up horizontally by clicking on the pop-up title too.
I guess the latency discrepancy between my PC and the RPI4 is due to load, power, etc. It is only 1 or 2ms but still surprising given both are currently under very low load.
Thank you for this. Kind what I searched for.
Is it also possible to ping other ip adresses. Like for example. We have multiple Active Directories running in our school production environment, we want to show the connectivity between these, whether they’re online or not online. Just a simple reply like the 8.8.8.8 is enough.
Thanks in advance.
Yes you can add as many ping binary sensors as you need.
@jzh - I implemented 2, one pinging my router (which has been crashing due to bad firmware) for LAN and one to Google DNS for WAN:
EDIT: The super huge latency is due to lots of reboots due to a zwave update that broke my system.
This is what I added to my configuration.yaml:
- platform: ping
    host: 8.8.8.8
    name: "Google DNS Ping"
    count: 5
    scan_interval: 60

  - platform: ping
    host: 192.168.1.1
    name: "Router Ping"
    count: 5
    scan_interval: 60

template:
  - sensor:
      - name: "WAN Ping"
        icon: "mdi:speedometer"
        unit_of_measurement: "ms"
        state: "{{ state_attr('binary_sensor.google_dns_ping', 'round_trip_time_avg')|round(2) }}"

  - sensor:
      - name: "LAN Ping"
        icon: "mdi:speedometer"
        unit_of_measurement: "ms"
        state: "{{ state_attr('binary_sensor.router_ping', 'round_trip_time_avg')|round(2) }}"
When I add your code to my configuration.yaml it says the following:
bad indentation of a mapping entry at line 14, column 13:
      - platform: ping
                ^
I tried adding the following to my configuration.yaml file but I get nothing on my card.
# Configure a default setup of Home Assistant (frontend, api, etc)
default_config:

# Text to speech
tts:
  - platform: google_translate

group: !include groups.yaml
automation: !include automations.yaml
script: !include scripts.yaml
scene: !include scenes.yaml

- platform: ping
    host: 8.8.8.8
    name: "Google DNS Ping"
    count: 5
    scan_interval: 60

  - platform: ping
    host: 192.168.1.1
    name: "Default Gateway Ping"
    count: 5
    scan_interval: 60

template:
  - sensor:
      - name: "WAN Ping"
        icon: "mdi:speedometer"
        unit_of_measurement: "ms"
        state: "{{ state_attr('binary_sensor.google_dns_ping', 'round_trip_time_avg')|round(2) }}"

  - sensor:
      - name: "LAN Ping"
        icon: "mdi:speedometer"
        unit_of_measurement: "ms"
        state: "{{ state_attr('binary_sensor.router_ping', 'round_trip_time_avg')|round(2) }}"
Please don’t post pictures of text. Post the text and format it correctly.
The binary sensor configuration is correct. The template sensor configuration is not. template: needs to be hard up against the margin. If you had posted the text I could have copied and pasted it and shown you. I can’t do that with an image.
Edited the post.
Now you are missing binary_sensor: above the ping sensors.
binary_sensor:
  - platform: ping
    host: 8.8.8.8
    name: "Google DNS Ping"
    count: 5
    scan_interval: 60

  - platform: ping
    host: 192.168.1.1
    name: "Default Gateway Ping"
    count: 5
    scan_interval: 60

template:
  - sensor:
      - name: "WAN Ping"
        icon: "mdi:speedometer"
        unit_of_measurement: "ms"
        state: "{{ state_attr('binary_sensor.google_dns_ping', 'round_trip_time_avg')|round(2) }}"

  - sensor:
      - name: "LAN Ping"
        icon: "mdi:speedometer"
        unit_of_measurement: "ms"
        state: "{{ state_attr('binary_sensor.router_ping', 'round_trip_time_avg')|round(2) }}"
Is there a reason that is causing the following error? :
bad indentation of a mapping entry at line 14, column 13:
- platform: ping
^
I tried to edit it in a few ways but its still there and it puts HAS in safemode.
Yes, see my answer above.
Alright, I’ve added the code into the configuration.yaml. Thank you.
But it still doesn’t show on the dashboard.
I’ve added the following into a manual card. As said above.
color_thresholds:
  - color: '#e45e65'
    value: 40
  - color: '#e0b400'
    value: 30
  - color: '#0da035'
    value: 20
  - color: '#039BE5'
    value: -1
color_thresholds_transition: hard
entities:
  - entity: binary_sensor.ping
group: false
height: 300
hour24: true
line_width: 4
name: Ping
points_per_hour: 10
show:
  extrema: true
  average: true
  fill: fade
  icon: true
  labels: false
  name: true
  state: true
type: custom:mini-graph-card


