Plotly interactive Graph Card

I need to add a condition for the y range;

It’s a stock watch price where I use the yahoo finance min and max of the day to set the Y range:

    range:
      - >-
        $ex
        hass.states["sensor.yahoofinance_isp_mi"].attributes['regularMarketDayLow']
      - >-
        $ex
        hass.states["sensor.yahoofinance_isp_mi"].attributes['regularMarketDayHigh']

and it’s working fine.

I have a sensor with with the price that I paid for them to understand if the current price is above or below, and it works fine.

The problem is that the purchase price can be out of range, so I need to add a condition:

if regularMarketDayLow > purchasePrice then min range = regularMarketDayLow else purchasePrice

How to add that condition to the YAML?
Thank you

It’s javascript, you can do:

range: 
  - |
    $ex {
       if (something > somethigElse) return aThirdThing;
       if (xyz) return blah;
       return whateverElse;
    }

I have the following data that I would like to plot

 { start: '01:00', end: '05:00', capacity: 30 },
 { start: '05:00', end: '09:00', capacity: 30 },
 { start: '09:00', end: '17:00', capacity: 50 },
 { start: '17:00', end: '20:00', capacity: 70 },
 { start: '20:00', end: '22:00', capacity: 60 },
 { start: '22:00', end: '01:00', capacity: 45 }

The values are all provided by sensors i.e.

sensor.ss_prog1_time
sensor.ss_prog2_time
number.sunsynk_prog1_capacity

i.e sensor.ss_prog1_time = 01:00 and sensor.ss_prog2_time = 05:00 etc

I have the following code but it seems overly complicated and very resource intensive. Is there perhaps a more efficient way to achieve the same thing

EDIT: Updated with reduced data points
EDIT2: Minimise function calls

type: custom:plotly-graph
hours_to_show: 2.2d
time_offset: 27h
refresh_interval: 10m
entities:
  - entity: sensor.sunsynk_battery_soc
    line:
      color: red
      shape: spline
      width: 3
    show_value: true
    texttemplate: '%{y}'
  - entity: number.sunsynk_prog1_capacity
    line:
      color: rgb(30,144,255)
      width: 1
    fill: tozeroy
    fillcolor: rgba(30,144,255, 0.6)
    filters:
      - fn: |
          ({ys, xs, hass}) => {
            const startTimeString = hass.states['sensor.ss_prog1_time'].state;
            const endTimeString = hass.states['sensor.ss_prog2_time'].state;
            const capacity = parseFloat(hass.states['number.sunsynk_prog1_capacity'].state);
  
            const now = new Date();
            const [startHours, startMinutes] = startTimeString.split(':').map(Number);
            const [endHours, endMinutes] = endTimeString.split(':').map(Number);
  
            const startTime = new Date(now.getFullYear(), now.getMonth(), now.getDate(), startHours, startMinutes);
            let endTime = new Date(now.getFullYear(), now.getMonth(), now.getDate(), endHours, endMinutes);
           
            if (endTime < startTime) {
              endTime.setDate(endTime.getDate() + 1);
            }
  
            return { xs: [startTime, endTime], ys: [capacity, capacity] };
          }
  - entity: number.sunsynk_prog2_capacity
    line:
      color: rgb(30,144,255)
      width: 1
    fill: tozeroy
    fillcolor: rgba(30,144,255, 0.9)
    show_value: false
    filters:
      - fn: |
          ({ys, xs, hass}) => {
            const startTimeString = hass.states['sensor.ss_prog2_time'].state;
            const endTimeString = hass.states['sensor.ss_prog3_time'].state;
            const capacity = parseFloat(hass.states['number.sunsynk_prog2_capacity'].state);
  
            const now = new Date();
            const [startHours, startMinutes] = startTimeString.split(':').map(Number);
            const [endHours, endMinutes] = endTimeString.split(':').map(Number);
  
            const startTime = new Date(now.getFullYear(), now.getMonth(), now.getDate(), startHours, startMinutes);
            let endTime = new Date(now.getFullYear(), now.getMonth(), now.getDate(), endHours, endMinutes);
           
            if (endTime < startTime) {
              endTime.setDate(endTime.getDate() + 1);
            }
  
            return { xs: [startTime, endTime], ys: [capacity, capacity] };
          }
  - entity: number.sunsynk_prog3_capacity
    line:
      color: rgb(30,144,255)
      width: 1
    fill: tozeroy
    fillcolor: rgba(30,144,255, 0.7)
    show_value: false
    filters:
      - fn: |
          ({ys, xs, hass}) => {
            const startTimeString = hass.states['sensor.ss_prog3_time'].state;
            const endTimeString = hass.states['sensor.ss_prog4_time'].state;
            const capacity = parseFloat(hass.states['number.sunsynk_prog3_capacity'].state);
  
            const now = new Date();
            const [startHours, startMinutes] = startTimeString.split(':').map(Number);
            const [endHours, endMinutes] = endTimeString.split(':').map(Number);
  
            const startTime = new Date(now.getFullYear(), now.getMonth(), now.getDate(), startHours, startMinutes);
            let endTime = new Date(now.getFullYear(), now.getMonth(), now.getDate(), endHours, endMinutes);
           
            if (endTime < startTime) {
              endTime.setDate(endTime.getDate() + 1);
            }
  
            return { xs: [startTime, endTime], ys: [capacity, capacity] };
          }
  - entity: number.sunsynk_prog4_capacity
    line:
      color: rgb(30,144,255)
      width: 1
    fill: tozeroy
    fillcolor: rgba(30,144,255, 0.9)
    show_value: false
    filters:
      - fn: |
          ({ys, xs, hass}) => {
            const startTimeString = hass.states['sensor.ss_prog4_time'].state;
            const endTimeString = hass.states['sensor.ss_prog5_time'].state;
            const capacity = parseFloat(hass.states['number.sunsynk_prog4_capacity'].state);
  
            const now = new Date();
            const [startHours, startMinutes] = startTimeString.split(':').map(Number);
            const [endHours, endMinutes] = endTimeString.split(':').map(Number);
  
            const startTime = new Date(now.getFullYear(), now.getMonth(), now.getDate(), startHours, startMinutes);
            let endTime = new Date(now.getFullYear(), now.getMonth(), now.getDate(), endHours, endMinutes);
           
            if (endTime < startTime) {
              endTime.setDate(endTime.getDate() + 1);
            }
  
            return { xs: [startTime, endTime], ys: [capacity, capacity] };
          }
  - entity: number.sunsynk_prog5_capacity
    line:
      color: rgb(30,144,255)
      width: 1
    fill: tozeroy
    fillcolor: rgba(30,144,255, 0.7)
    filters:
      - fn: |
          ({ys, xs, hass}) => {
            const startTimeString = hass.states['sensor.ss_prog5_time'].state;
            const endTimeString = hass.states['sensor.ss_prog6_time'].state;
            const capacity = parseFloat(hass.states['number.sunsynk_prog5_capacity'].state);
  
            const now = new Date();
            const [startHours, startMinutes] = startTimeString.split(':').map(Number);
            const [endHours, endMinutes] = endTimeString.split(':').map(Number);
  
            const startTime = new Date(now.getFullYear(), now.getMonth(), now.getDate(), startHours, startMinutes);
            let endTime = new Date(now.getFullYear(), now.getMonth(), now.getDate(), endHours, endMinutes);
           
            if (endTime < startTime) {
              endTime.setDate(endTime.getDate() + 1);
            }
  
            return { xs: [startTime, endTime], ys: [capacity, capacity] };
          }
  - entity: number.sunsynk_prog6_capacity
    line:
      color: rgb(30,144,255)
      width: 1
    fill: tozeroy
    fillcolor: rgba(30,144,255, 0.9)
    filters:
      - fn: |
          ({ys, xs, hass}) => {
            const startTimeString = hass.states['sensor.ss_prog6_time'].state;
            const endTimeString = hass.states['sensor.ss_prog1_time'].state;
            const capacity = parseFloat(hass.states['number.sunsynk_prog6_capacity'].state);
  
            const now = new Date();
            const [startHours, startMinutes] = startTimeString.split(':').map(Number);
            const [endHours, endMinutes] = endTimeString.split(':').map(Number);
  
            const startTime = new Date(now.getFullYear(), now.getMonth(), now.getDate(), startHours, startMinutes);
            let endTime = new Date(now.getFullYear(), now.getMonth(), now.getDate(), endHours, endMinutes);
           
            if (endTime < startTime) {
              endTime.setDate(endTime.getDate() + 1);
            }
  
            return { xs: [startTime, endTime], ys: [capacity, capacity] };
          }
layout:
  showlegend: false
  yaxis:
    nticks: 20
    range:
      - 0
      - 105
    fixedrange: true
  xaxis:
    nticks: 9
config:
  scrollZoom: false


You could put this at the beginning of the yaml:

fn: |
    $fn({hass, vars}) => {
      vars.compute = ({start, end, cap}) =>{
        const startTimeString = hass.states[`sensor.ss_prog${start}_time`].state;
        const endTimeString = hass.states[`sensor.ss_prog${end}_time`].state;
        const capacity = parseFloat(hass.states[`number.sunsynk_prog${cap}_capacity`].state);

        const now = new Date();
        const [startHours, startMinutes] = startTimeString.split(':').map(Number);
        const [endHours, endMinutes] = endTimeString.split(':').map(Number);

        const startTime = new Date(now.getFullYear(), now.getMonth(), now.getDate(), startHours, startMinutes);
        let endTime = new Date(now.getFullYear(), now.getMonth(), now.getDate(), endHours, endMinutes);
        
        if (endTime < startTime) {
          endTime.setDate(endTime.getDate() + 1);
        }

        return { xs: [startTime, endTime], ys: [capacity, capacity] };
      }
    }

And then use the code in each of the filters, e.g:

    filters:
      - fn:  "({vars}) => vars.compute({start: 3, end: 4, cap: 3})"

Thanks for the suggestion. I have it like so but it complains about

Error: at [entities.1.filters.0]: Error in filter: TypeError: vars.compute is not a function

type: custom:plotly-graph
hours_to_show: current_day
time_offset: 1h
refresh_interval: 10m
fn: |
    $fn({hass, vars}) => {
      vars.compute = ({start, end, cap})
        const startTimeString = hass.states[`sensor.ss_prog${start}_time`].state;
        const endTimeString = hass.states[`sensor.ss_prog${end}_time`].state;
        const capacity = parseFloat(hass.states[`number.sunsynk_prog${cap}_capacity`].state);

        const now = new Date();
        const [startHours, startMinutes] = startTimeString.split(':').map(Number);
        const [endHours, endMinutes] = endTimeString.split(':').map(Number);

        const startTime = new Date(now.getFullYear(), now.getMonth(), now.getDate(), startHours, startMinutes);
        let endTime = new Date(now.getFullYear(), now.getMonth(), now.getDate(), endHours, endMinutes);
        
        if (endTime < startTime) {
          endTime.setDate(endTime.getDate() + 1);
        }

        return { xs: [startTime, endTime], ys: [capacity, capacity] };
      }
entities:
  - entity: sensor.sunsynk_battery_soc
    line:
      color: red
      shape: spline
      width: 3
    show_value: true
    texttemplate: '%{y}'
  - entity: number.sunsynk_prog1_capacity
    line:
      color: rgb(30,144,255)
      width: 1
    fill: tozeroy
    fillcolor: rgba(30,144,255, 0.6)
    filters:
      - fn:  "({vars}) => vars.compute({start: 1, end: 2, cap: 1})"

I fixed the mistake in the message above

1 Like

Works great thanks.

I wonder if there is any possibility to have still a curved/spline line, but not such backwards behaviors of it?

image

type: custom:plotly-graph
title: Windvorschau
time_offset: 1.5d
entities:
  - entity: sensor.weather_home_hourly
    attribute: wind_speed
    legendgroup: 2
    name: 〰️ Wind
    filters:
      - store_var: wind_speed
    fill: tozeroy
    fillcolor: rgba(142, 190, 235,.6)
    line:
      color: rgba(142, 190, 235, 1)
    yaxis: y1
  - entity: sensor.weather_home_hourly
    legendgroup: 2
    showlegend: false
    name: Wind
    fill: tozeroy
    fillcolor: rgba(142, 190, 235,.3)
    line:
      color: rgba(142, 190, 235, 1)
      dash: dot
    unit_of_measurement: °C
    filters:
      - fn: |-
          ({ meta, vars }) => ({
            xs: [vars.wind_speed.xs.slice(-1)[0],...meta.forecast.map(({ datetime }) => new Date(datetime))],
            ys: [vars.wind_speed.ys.slice(-1)[0],...meta.forecast.map(({ wind_speed }) => wind_speed)],
          })
    yaxis: y1
defaults:
  entity:
    show_value: true
    line:
      shape: spline
hours_to_show: 48

You could remove past data from the forecast with

- filter: x > Date.now()
1 Like

Hey,
thanks for the hint. But if I show the current state with the map_y_numbers option, it keeps hovering above all other data when I scroll to the left in the chart. How can I fix that?
Thanks

Edit:
with some help I managed to get it working:

  • map_y_numbers: >-
    (i == ys.length - 1 && new Date(x).toDateString() == new Date().toDateString()) ? hass.states[“sensor.xxx”].state / 1000 : y

Hi,
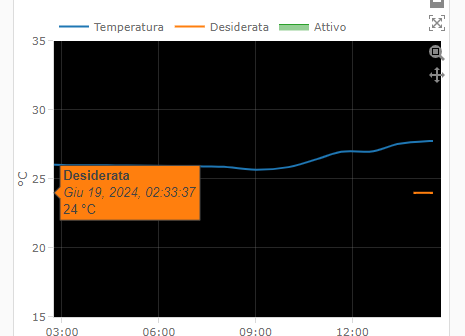
from the today os update 12.4 i have one missing line in my graphs. i can’t figure out if is my bad or there some bug. until yesterday all was fine…

i have this sensor that I use to save an entity attribute:

    splitter_soggiorno_temperatura_desiderata:
      friendly_name: "Splitter Soggiorno Temperatura Desiderata"
      device_class: temperature
      unit_of_measurement: °C
      value_template: >
        {{ states.climate.splitter_soggiorno_room_temperature.attributes.temperature }}

the sensor is fine and the system history graph is ok:
1

but on plotly the line is missing not coherent:
image

If I move the mouse where the line should be I can see the value…
image

edit:
I found out that if I restart HA, I miss all the “Desiderata” line.
Maybe because it’s only one value and my sensor doesn’t update until I change the original attribute?

Is there a way to draw a line between two distant points?

Most likely unavailable points, try the force_numeric filter

It works!!
Many thanks for the hint.

hi, another question…
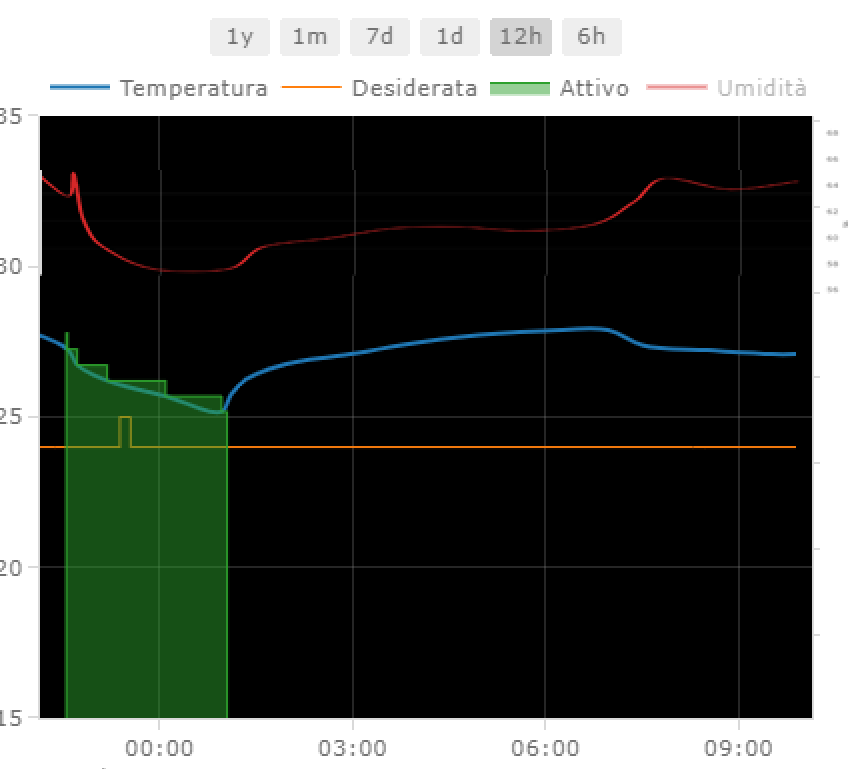
i’m trying to add humidity in my temp/climate graph. and the result is this:
image
is there a way to reduce de scale only of the red line and shift it to the top with a separate scale?

something like this:

thanks

I suggest you browse the examples page:

There are some stacked plots that should do what you need

Did anyone get the autorangeoptions.include to work? Tried many variations and the plot simply does include the value. To be sure I use the right feature, I have a temperature to plot of a water boiler. I want the range to be 55 to 65, even if the temperature only does ±1 around 60. But of course if the temperature drops to 40, that part should then be included. But this does othing

layout: 
  yaxis:
  autorangeoptions:
    include:
      - 55
      - 65

This may be new features, I’ll update the plotly library soon

Ah thank you so much. Somehow I assumed, all the options listed on the plotly javascript reference directly work. Thank you for your work!

1 Like

hi,
I have a graph displaying the monthly data of a sensor, month by month.
I have set the period to 1 year, and the last 12 months are shown.
Is there a way to display the data from January to December?

type: custom:plotly-graph
title: mensile
entities:
  - entity: sensor.test_misura_on_multimedia_mensile
    statistic: state
    period: month
    type: bar
    texttemplate: '%{y}'
hours_to_show: 12M
defaults:
  entity:
    line:
      width: 2
  yaxes:
    fixedrange: true

current_year. Tis section: GitHub - dbuezas/lovelace-plotly-graph-card: Highly customisable Lovelace card to plot interactive graphs. Brings scrolling, zooming, and much more!