This card is excellent, thankyou! It’s really handy to be able to place the energy distribution card and your card side by side.
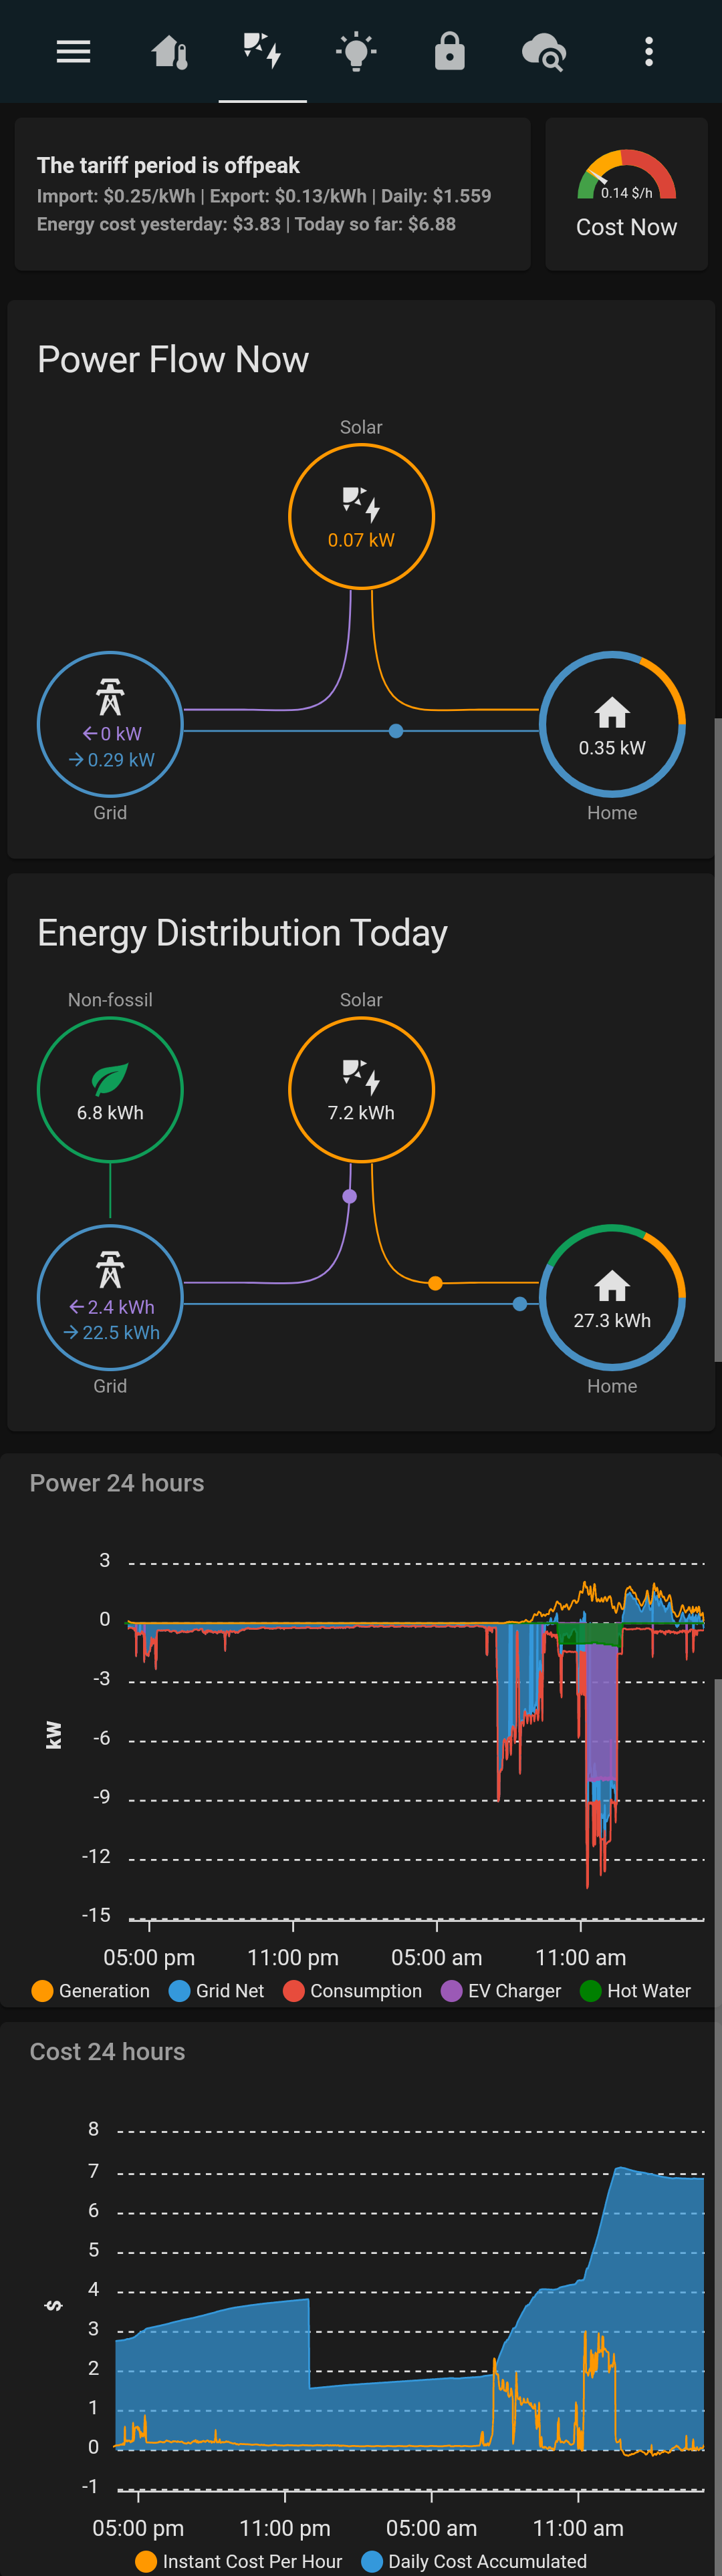
Below is my energy view, all the figures are real time (1s for readouts and 1m for graphs) really rainy here today as you can see so my 17kW of solar isn’t doing much, so an older screenshot included too 
It would be awesome if we could do the same for the energy card, simply so we aren’t stuck with an hour delay on energy figures.
Is it also possible to use the same source for grid carbon footprint to give a real time view of how green your power is?
Likewise as others have asked, a way to add individual loads would be cool but that’s easy for me to say sitting here with no idea how much work that takes! Thanks for your efforts.