Relatively new to HA but learning quickly and experimenting.
Have an Emporia Vue system and the integration brings in three entities for each circuit in my panel: an hourly power average (kW), a daily energy value (kWh), and a monthly energy value (kWh).
It also brings in the same values as totals for the panels on which they are installed. I have two panels, and the one thing the Emporia app can’t do, is it can’t combine data to get a total power reading summed from both panels, which is one of the opportunities I see for HA.
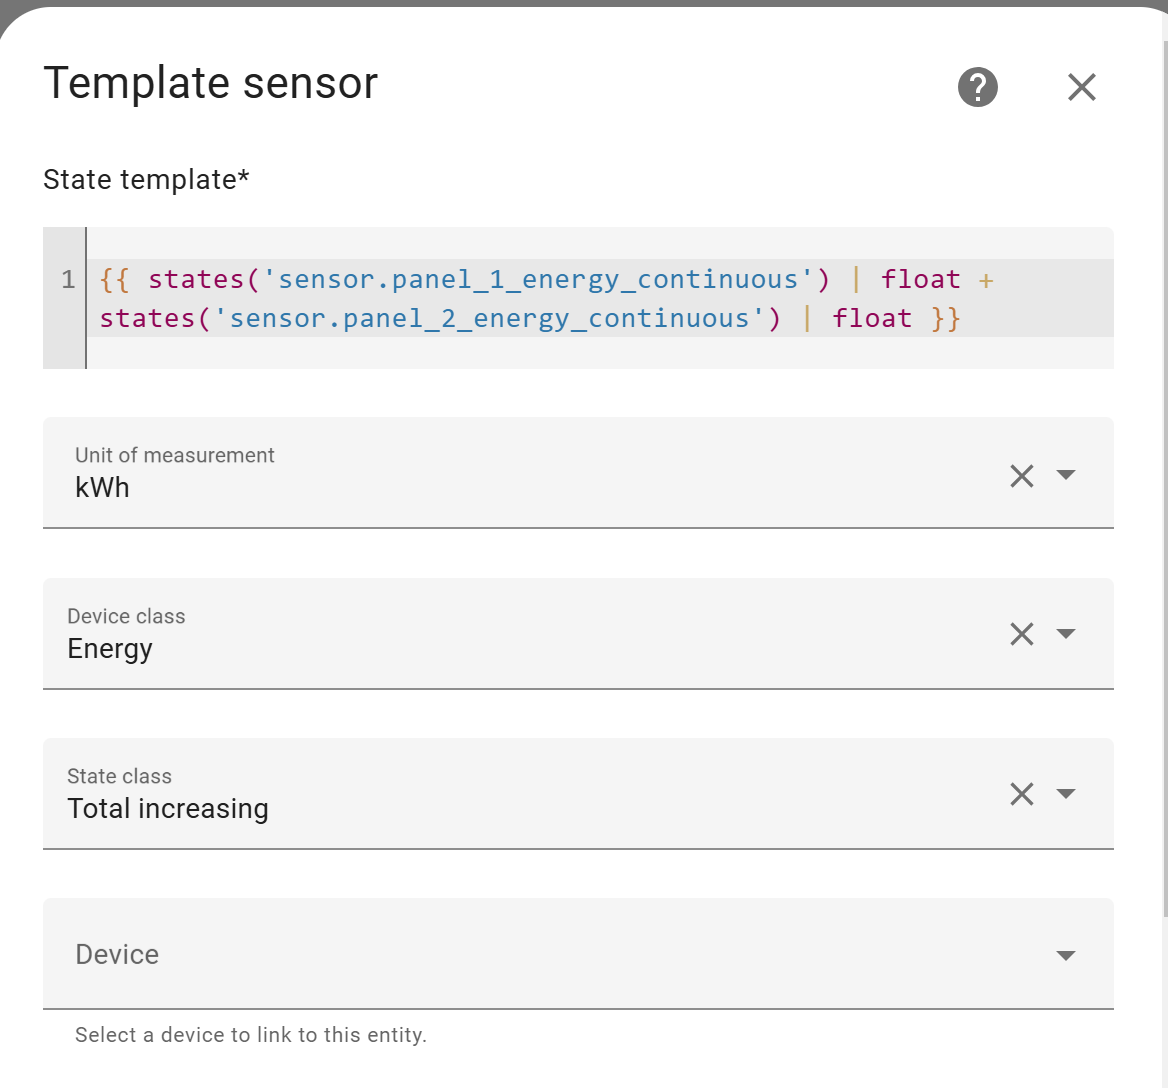
In order to effectively use the data from the Emporia entities to graph hourly, daily, and weekly values, I found that I needed to create a Utility Meter Template to have a continuously increasing total for the entities.
I created the Utility Meter Template using the daily entities from Emporia. I set them up as “always available” and “periodically resetting” because each day at midnight the daily numbers reset to 0. I figured this selection is how you tell the template to ignore the 0 and continue accumulating as the input continues to increase.
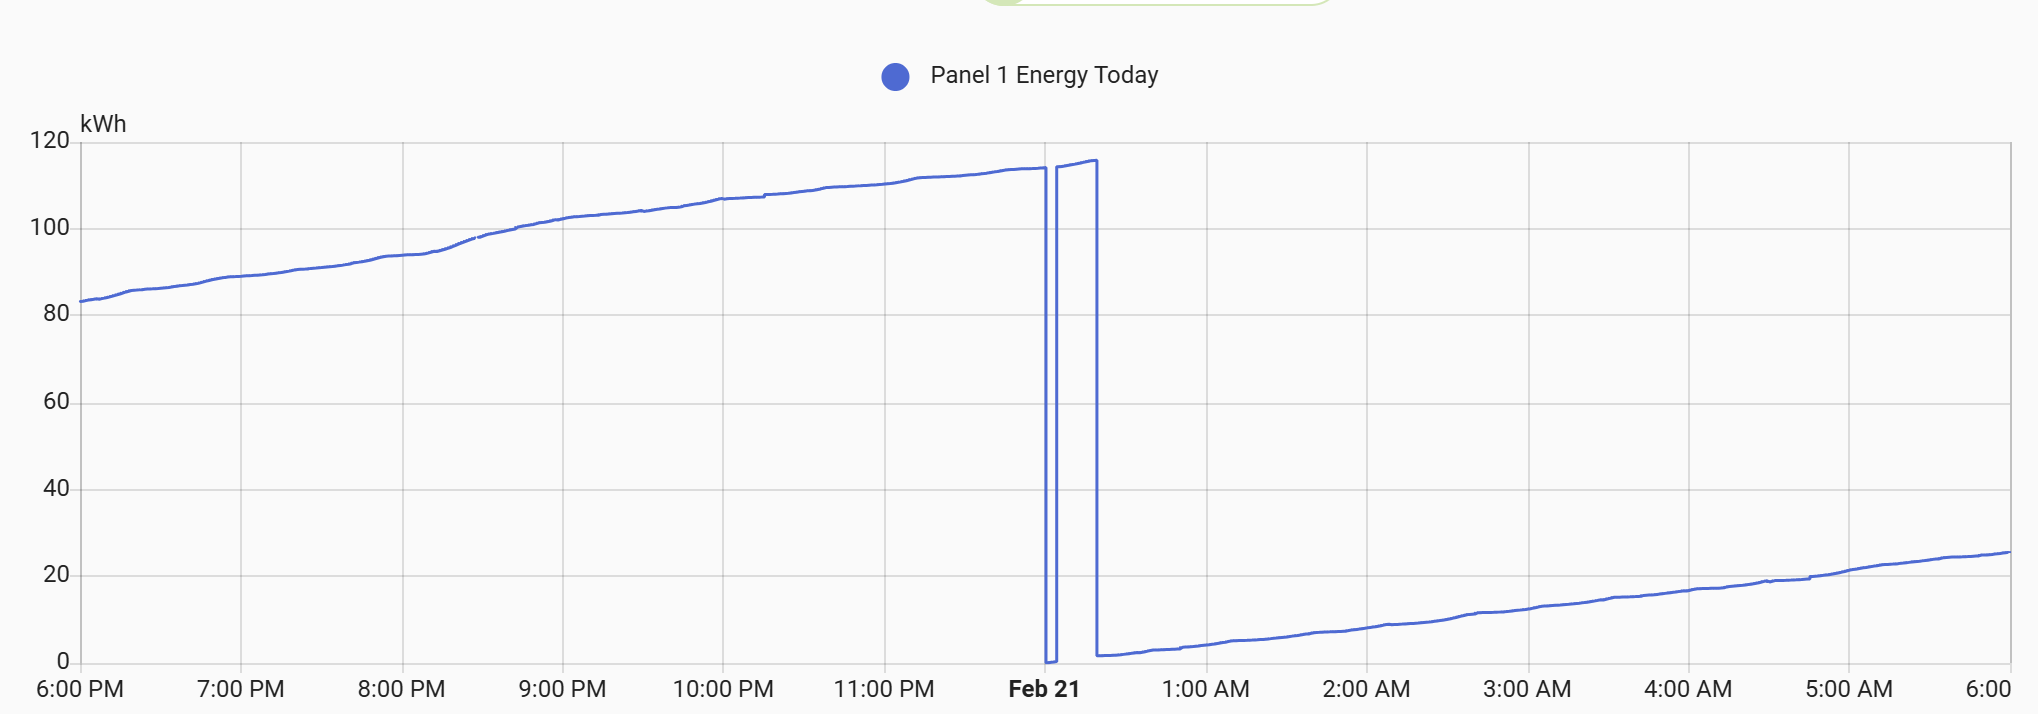
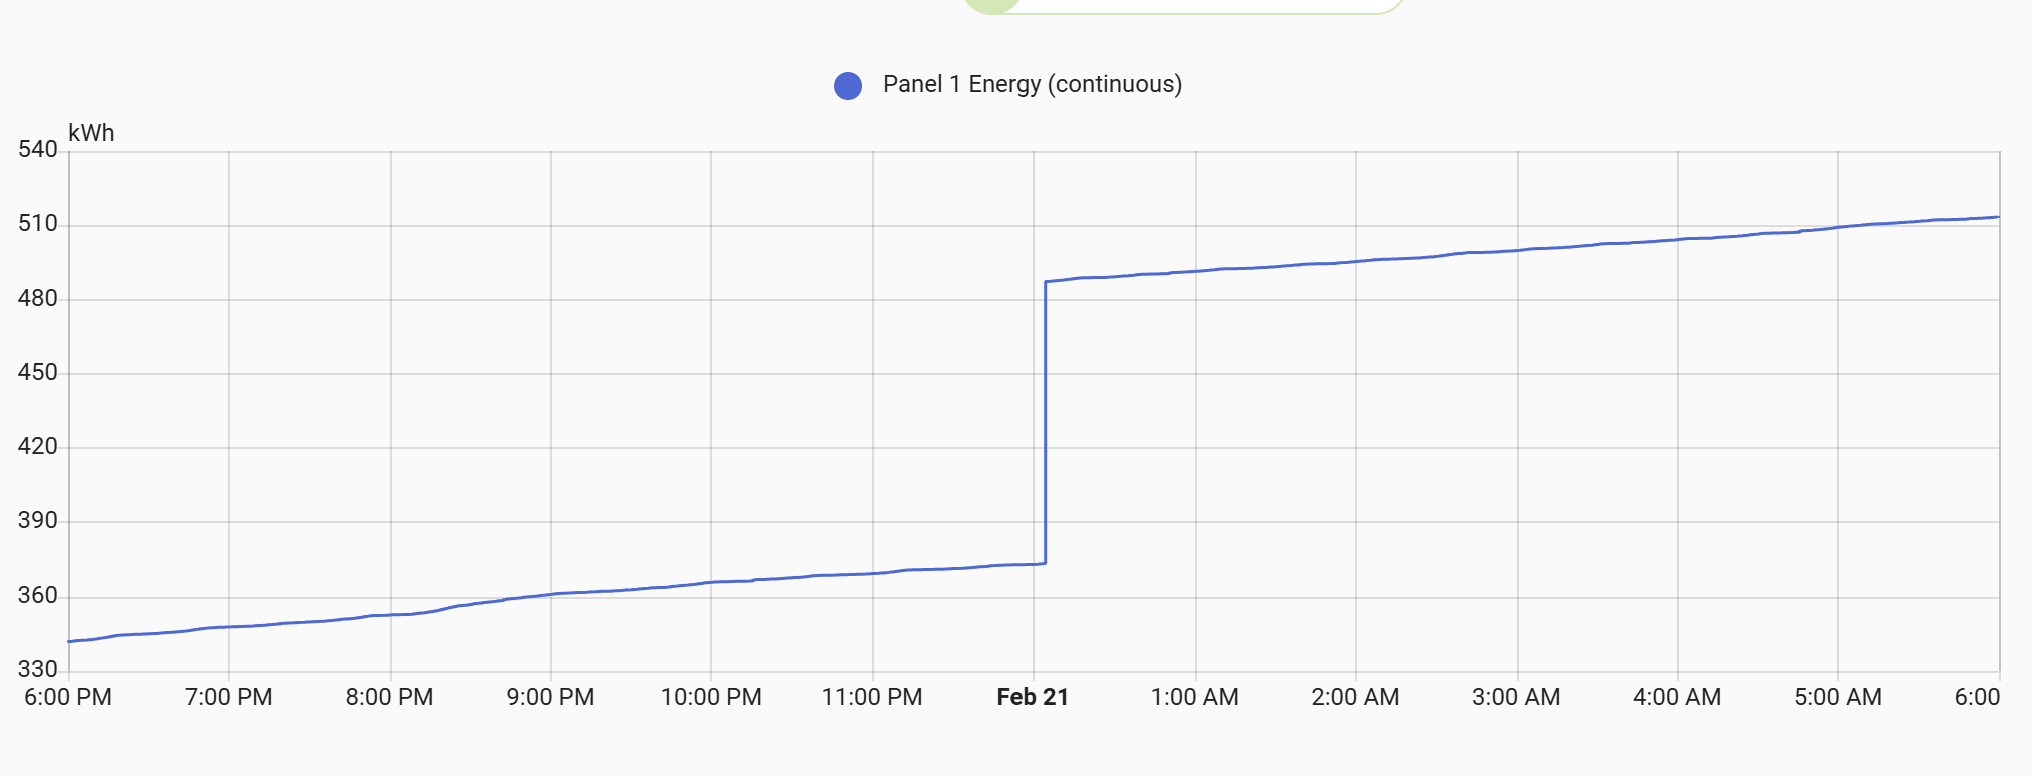
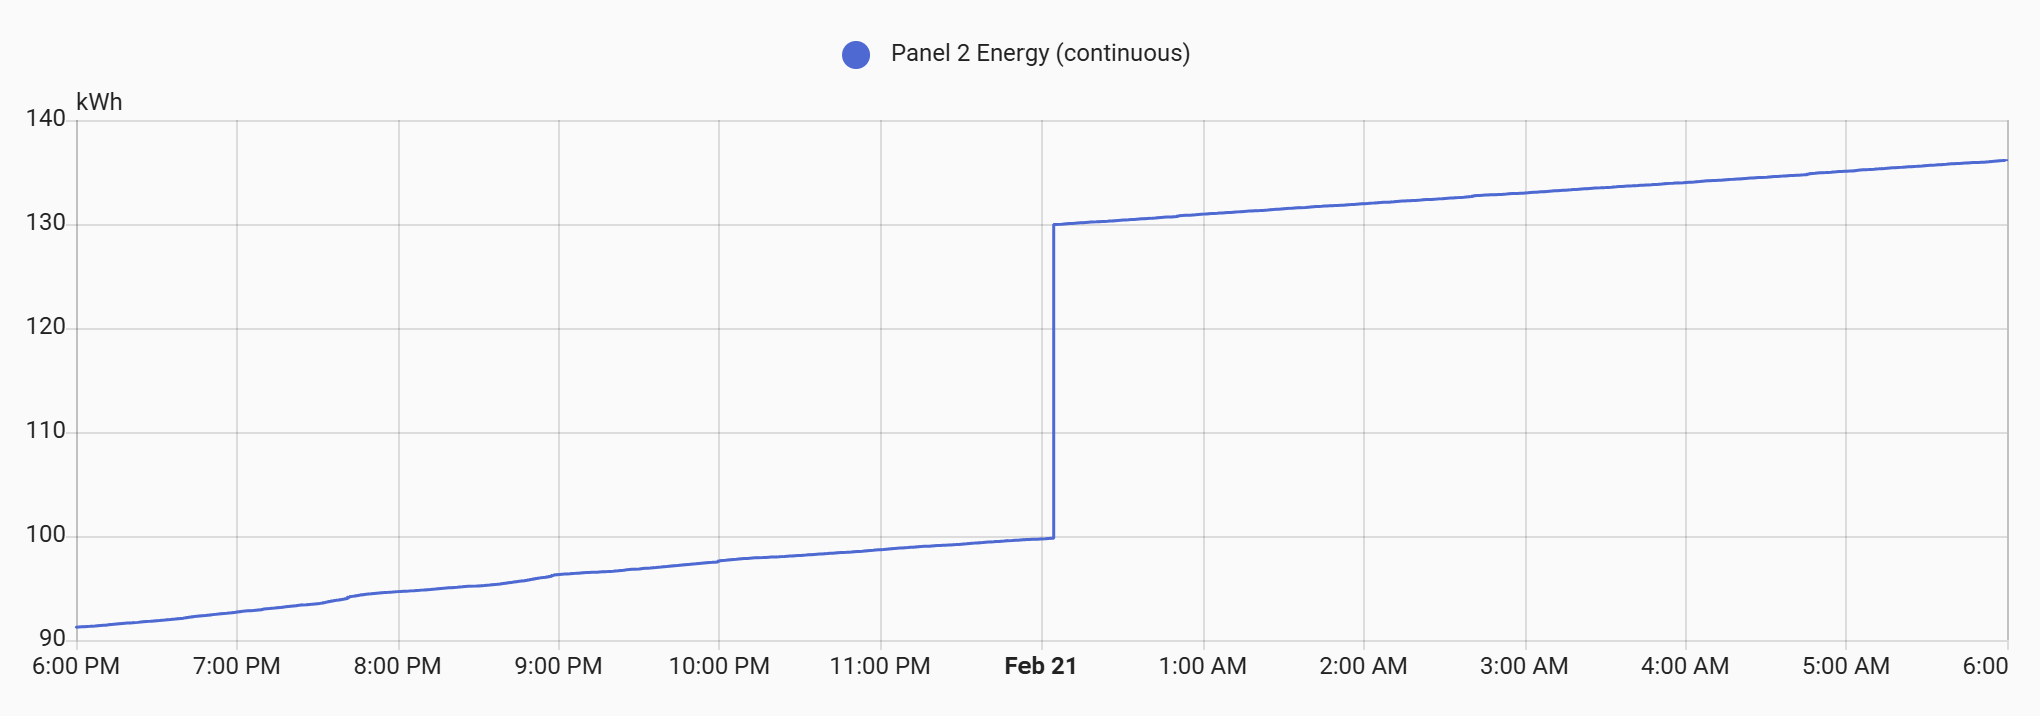
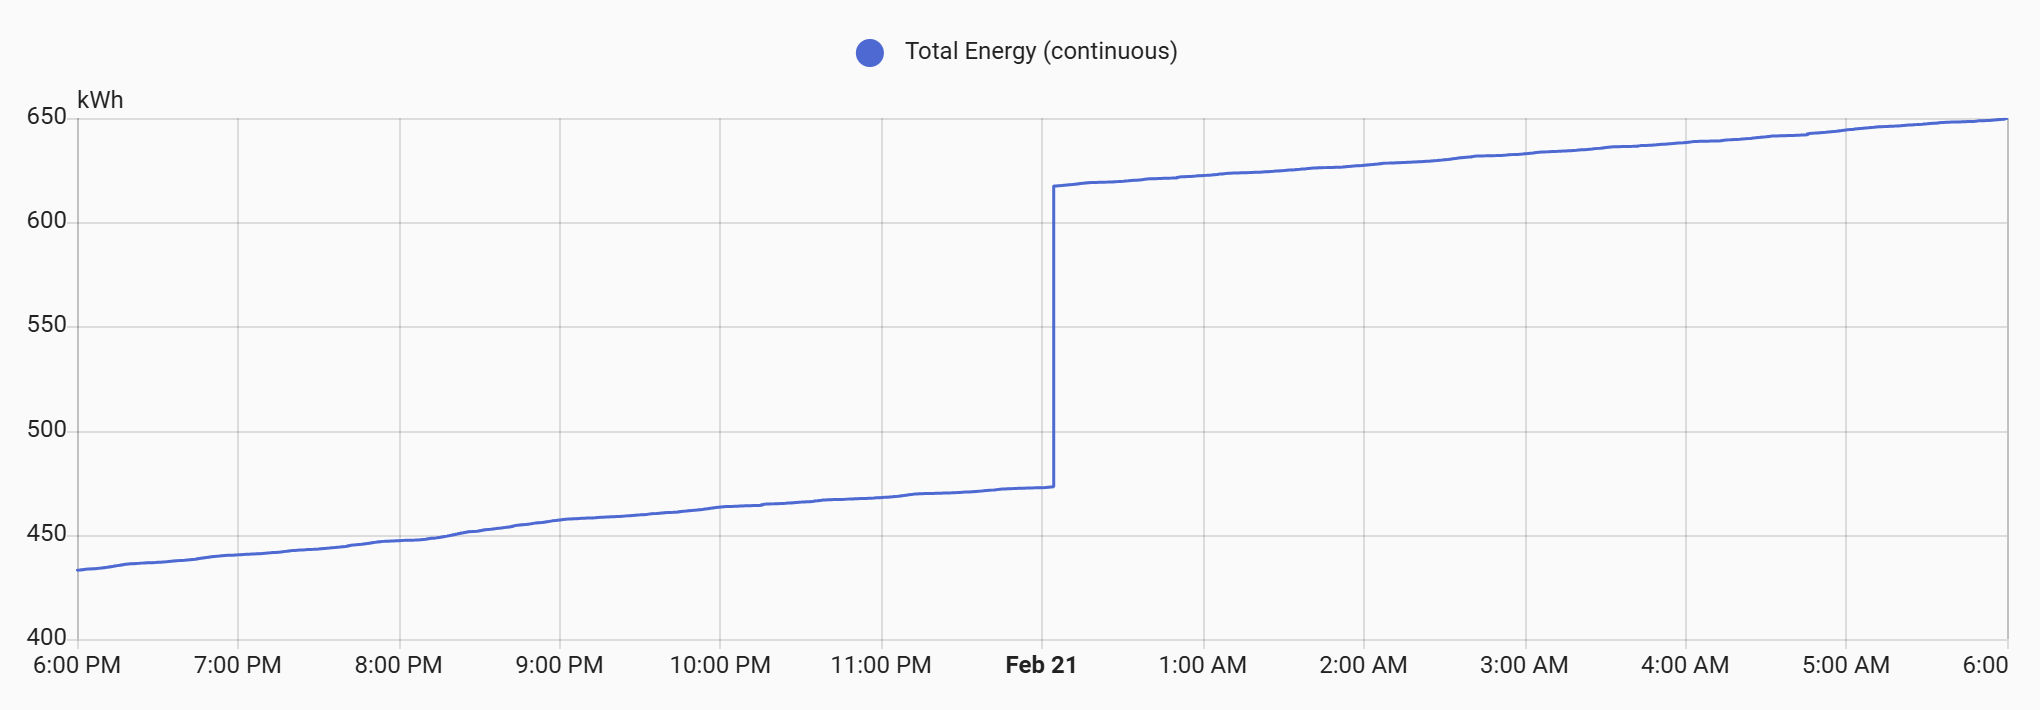
This worked perfectly for 5 days, and then a glitch in the matrix last night at midnight. Right at 12:06am, the total value jumped instantaneously by 100kWh.
It’s definitely not a real shift in energy use, but I can’t tell what caused it. When I review the Emporia data in their app, all looks good.
Can anyone help with troubleshooting the issue? Possibly something in my setup? Nothing was changed yesterday, so I’m not sure what it could have been.
More than likely it’s an erroneous report by the vue hardware. Would need to see the history of the energy sensors for those time frames to be certain.
Yes, clearly an issue with the source data (why didn’t I think to check that? ), but I’m not sure what happened or if that can be corrected within my template…
Interesting, I thought the helper would implicitly use availability. So if either source sensor is unavailable the helper should be unavailable, not zero (which is what caused your issue).
Can you show the history for those two sensors over the same time period (or even zoomed in a bit to where the glitch happened).
I know that some of the helpers, whether the ones for Panel 1, 2, or the sum, had sensor availability options. I can’t remember what I selected for them; and unfortunately for some reason I can’t find those settings in the existing helpers, would need to create new ones.
Sorry, as a novice I’ve probably got my terminology all wrong for the different items. I certainly need to take some steps to improve my device/sensor/entity/helper names as even I get confused when I go back to look at them.
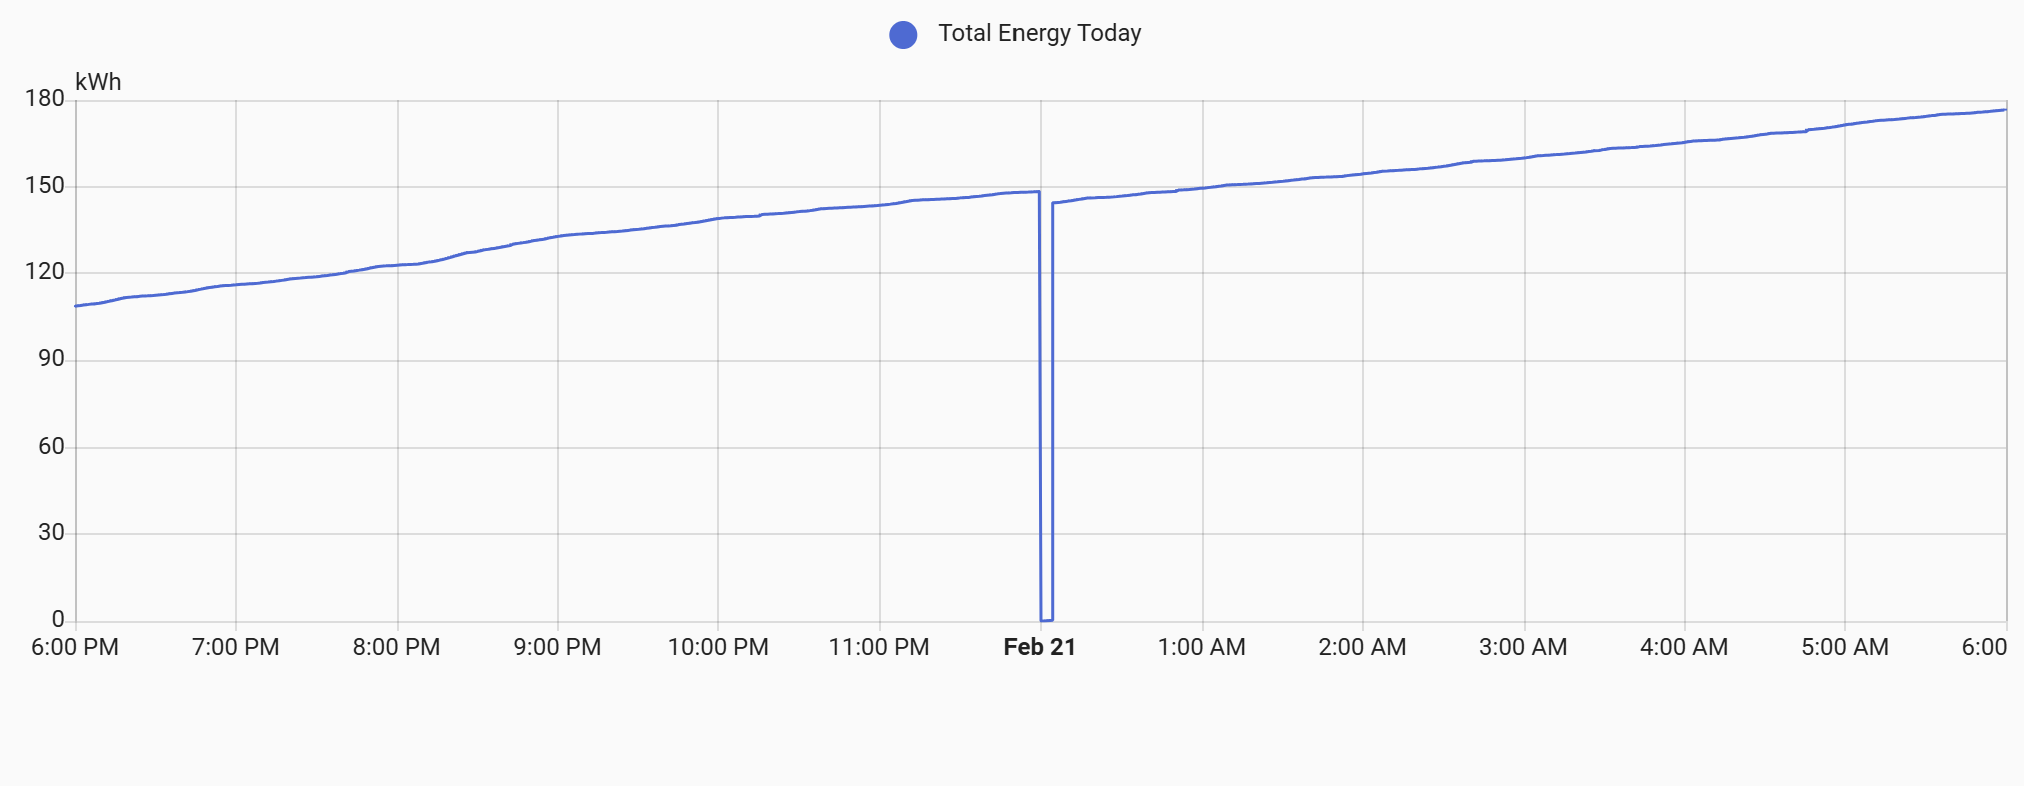
I have seen a similar issue with my Emporia Vue as well. In my case, it happened after a very short power outage. Energy went to 0 briefly, then reverted back to its previous value, causing the energy dashboard to report a doubling of energy in that short time window.
Here’s something that might help going forward: use ESPHome instead of the Emporia app. Depending on your hardware version, flashing the device is fairly straightforward. I actually had this happen when using ESPHome, before I read some discussions from others having the same issue, and finding the fix. The fix (which is now documented in the project README) is to add restore: false to each platform: total_daily_energy sensor.
In terms of correcting the issue, I’m not sure how the Emporia integration defines these entities, but for me, the total daily energy sensors have state_class: total_increasing (you can find this in Developer tools -> States), so I can go into Developer tools -> Statistics and adjust the sum, effectively erasing the false step up to the previous value.
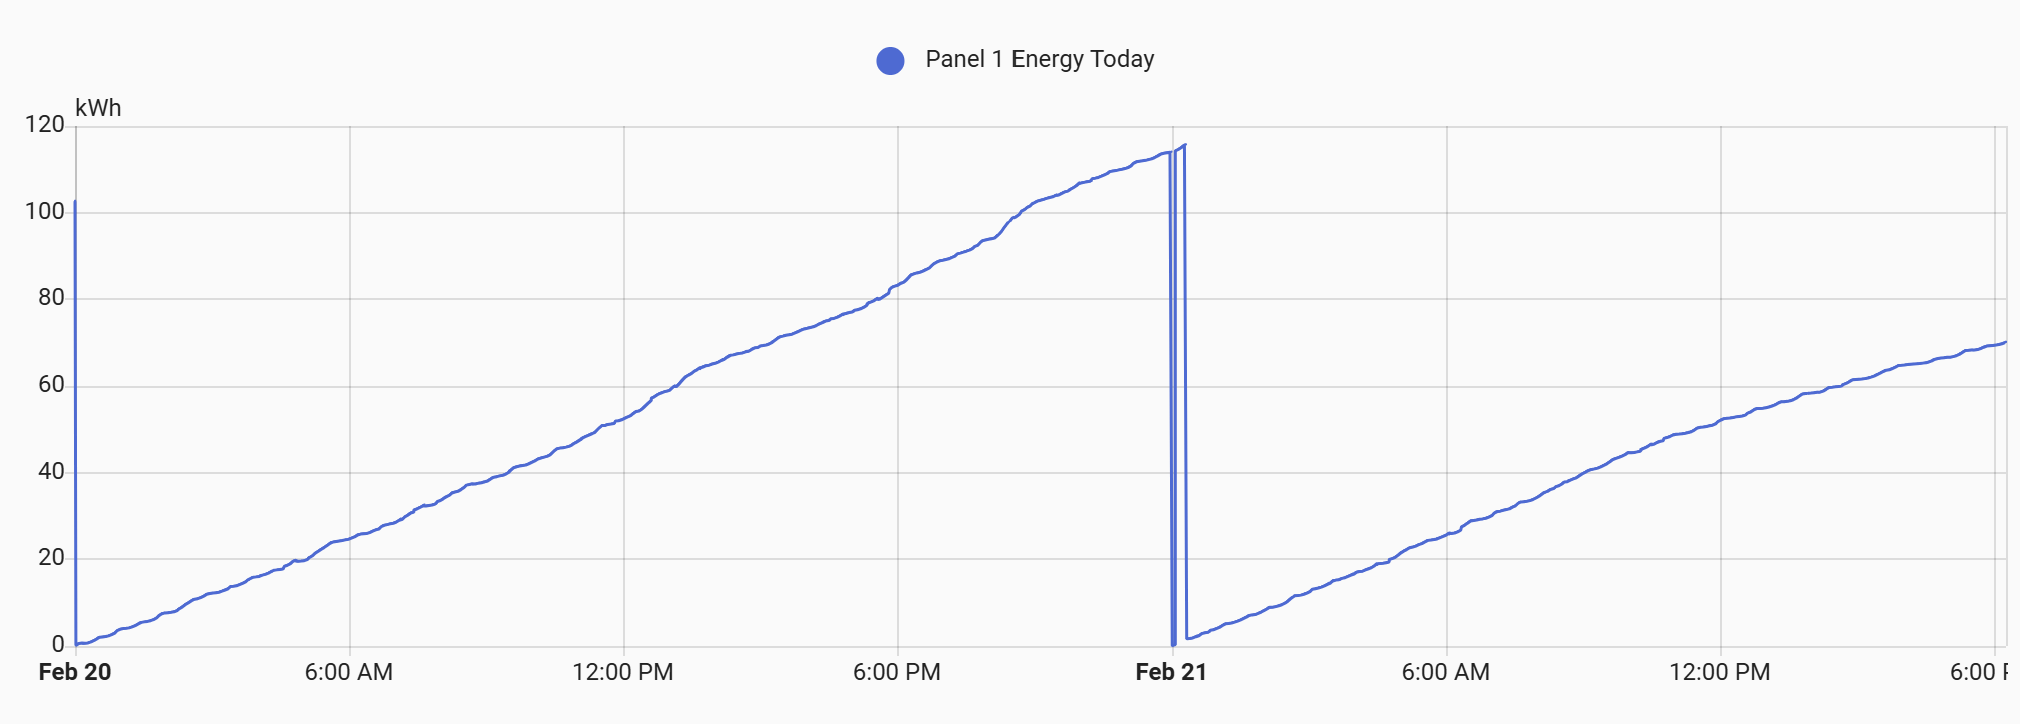
Unfortunately availability is not going to help. Those sensors went to zero instead of unavailable.
Your options:
ESPHome as mentioned by mwaterbu above (I know nothing about this particular device ESPHome firmware).
If it is caused by power outages, a small UPS or DC UPS. My IoTaWatt energy meter needs this to prevent glitches during power loss. See IoTaWatt Discussion - #71 by tom_l
Nothing in the Utility meter setup can prevent this occurring and filtering your sensors to reject 0 values is not possible as they legitimately reset to 0 periodically.
So the Vue sensor is a daily number, which will reset to 0 each night. It almost looks like it reset, then came back up, then reset again. The purpose of the totalized meters was to just continue the totalization after the reset. I believe I set them up to recognize that the sensors would zero out periodically.
I have a hunch which I’ll need about 28 more days to prove… the day of the month where this glitch happened is the day of the month I have the Emporia Vue set to reset my monthly usage information (for cost/bill tracking). The Vue sensor I use is the daily value, and it may just be coincidental that the issue occurred on the monthly reset day, but if it’s fine until the 21st of next month, I’ll have some more confidence this is where the issue is coming from.
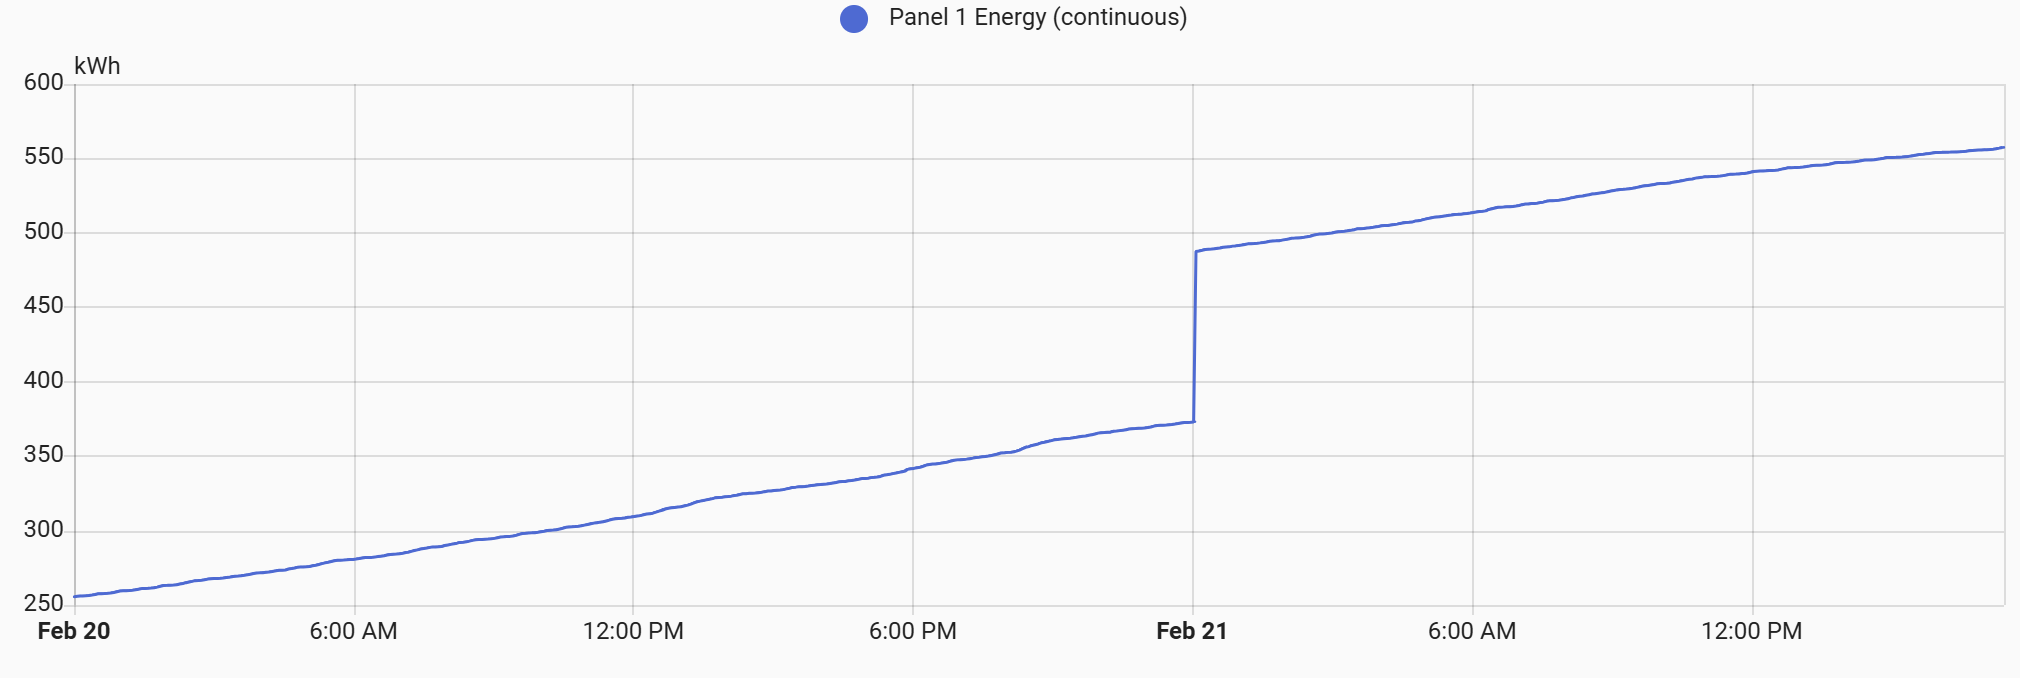
 ), but I’m not sure what happened or if that can be corrected within my template…