Recorder settings

Hi,

I am very new to Home Assistant and now I am setting up the Recorder. I have changed my database to MariaDB where Home Assistant runs as a Virtual Machine on my NAS. So storage is not really a concern.
I have additional numeric and text helpers I want to store the history long term. Let’s say 2/3 years; I am fine with the rest with the default history for it. As far a I have seen all Utility sensors History are already stored long term normally. After reboot and setup the recoder everything seems to work OK; but I am not sure If I did something not right here which would harm the database later. Therefor this topic.

I have setup this, where I have also added the Utility sensors as entity just to be sure that those are included:

recorder:
  db_url: !secret mariadb_url
  purge_keep_days: 1095
  purge_interval: 30
  include:
    entity_globs:
      - input_number.*
      - input_text.*
    entities:
      - sensor.entity1
      - sensor.entity2
  exclude:
    domains:
      - automation
      - updater
      - sensor

If I only use the Include nothing is stored besides what is described in the Include and that is not exactly what I wanted. So I hope this will revert all entities back to it default storage values. I have around 1500 entites in Home Assistant and around 20 that I want to be stored long term.

It still does not doing anything with the excludes; removed some P1 sensors from the include entity and I was hoping that it will keep the history then. But the Energy dashboard gives me an error with this entities; so included them back again… tried also this for an exclude:


  exclude:
    domains:
      - automation
      - updater
    entity_globs:
      - sensor.*

So how does this recorder work? I want to keep history for a 20 entities or so long-term and keep the default history values for the rest (which I thought is 10 days)?

I think what you’re looking for is this:

Feel free to up-vote, but frankly I’m not holding my breath. Apparently improving the functionality of Recorder isn’t all that glamorous.

1 Like

Also: the feature request section isnt taken into account anymore. The process is now moved to github. See the pinned post at the top of the feature request section

1 Like

…Where I’m sure this idea would get just as much dev attention as it did here for almost 5 years.

1 Like

Hehehe, that’s what you said…

Thanks; Not quite sure if I mean that. It is right that with an entity you need to create multiple instances. So maybe some entities have different history then others. But my concen is that managing 1500 entities to save it’s history is not managable if there is no logic how things are processed in the recorder.
At this moment I ofcourse HA needs to store history. So I don’t want to see that I flipped a switch three years ago; if this is stored for example for 100 entries that would be OK. But everything related to P1/ Solar/ Temperature and Humidity with associated helpers to calculate stuff are things I want to see stored for along time. In my opinion 20 entites which are stored for 3 years should not blow up a Database; but I am not a DBA’er but that sounds strange to me if it does :wink:

So at this stage it is not clear how the include lines and exclude lines work in the recorder and how these co-exist in the confguration.yaml. I would suggest that HA has a History default; so when I use Entities in the Include lines, that the history for these entities are stored for X time as specified in the Recorder. But everything else in the Exclude got HA default values for its history… but It does not seem to work this way because the Excluded entities has no HA history if these are not explicity noted in the include lines. So what is the function of the exclude then… It is then basically an all or nothing situation; store everything for three years or nothing or type everything down then entity by entity in the include line…
Is this the default behavoir and can you combine Include and Exclude lines in the recorder? How should this work and is there a way to achieve my goal?

The Recorder runs in the background and keeps a record of every change event. HA works by keeping the state value of entities, and when these change (for whatever reason) the change is broadcast on the Event Bus, and the recorder makes a note and adds a record of the change to the database.

Since a great deal of change happens all the time, this table grows very quickly and needs to be purged regularly, otherwise it gets too big, leaving insufficient free disk space for HA to run.

As a default, everything that can be is added to the Recorder history. It is possible to exclude items, using the domain, global pattern, or specific entity. Changes for these entities will then not be added to the database at the change-event. This is useful for excluding, for example, entities with a large array in one attribute, which can trigger a warning message as the recorder has a limit to the individual record size.

It is possible to set up the include, so as to define what to add rather than what to exclude. As I read the documentation, when using ‘include’ nothing is recorded by default, only the items specified in the include. Hence I would expect when using both exclude and include, for the include to override and only the include items to be captured. This, as you say, is probably not what you want. It is either “include this lot only”, or “add everything but exclude this lot”

The purge system runs, by default, every day and removes all records older than the retention time, which is 10 days by default. This is a standard and recommended setting.

Anything older than the 10 days is removed. There is no selective remove. If you really want to keep something for 100 days, then you have to keep everything for 100 days (which is really not a good idea).

Of course, one answer lies with the short and long-term statistics. Since the history database grows so quickly, it must be purged (at least at some point).

Every 5 minutes the Recorder runs through all entities that have a numeric state value, and class ‘measurement’ and it generates a statistical record of the entity state value for the past 5 minutes. Average, maximum, minimum, change and the final state value. This summary snapshot is then stored in the short-term history table. Being a summary, it is more compact, but this is also removed at the 10 day purge.

Every hour, the Recorder also runs through the same entities and produces a long-term statistical record, similar to the short-term. This is saved to another table, but will only add 24 small-size records per day per applicable entity. This table is never purged, and therefore this is a summary record of numerical state entities that is kept forever.

As you have already noted, several features of Home Assistant use the Recorder history. The Energy Dashboard being a particular case that takes the raw data required directly from the long-term (hourly) data table for most of the display. Turning off the recorder or excluding entities can mean that parts of Home Assistant stop working.

The HA Recorder does quite a lot, and the default settings are fine-tuned to get the best performance. Changing the settings is not advised.

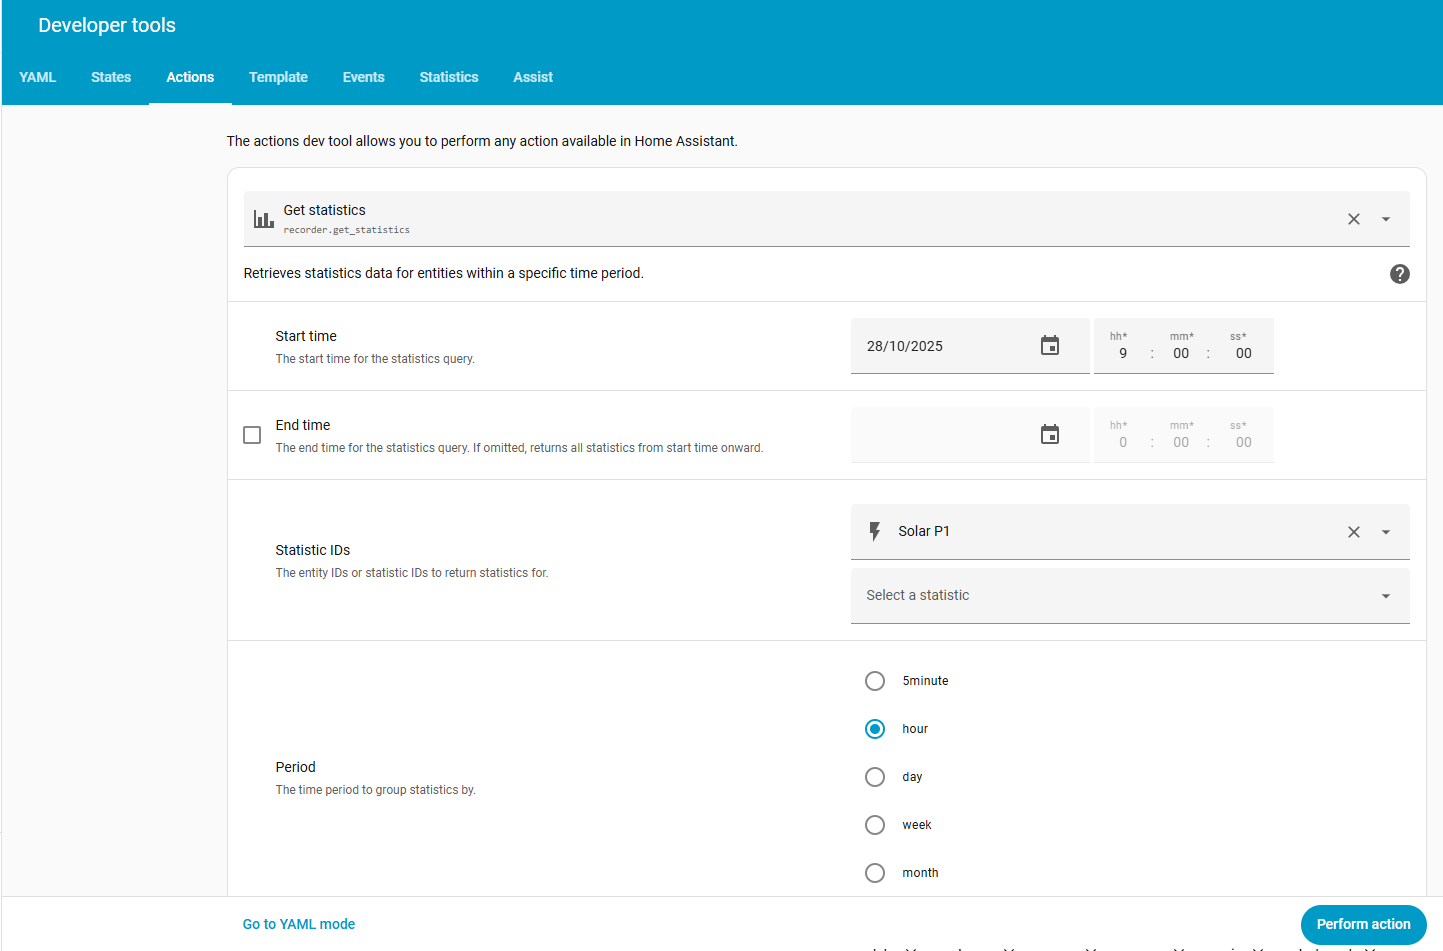
The long-term statistics may well hold sufficient information for you already, for your numeric state entities. There is a new action ‘recorder.get_statistics’ which will return data from the short/long-term database. Using this I can get the end-of-hour state value for any numeric measurement entity since I first turned HA on.

Text, of course, is another matter. Strings are very expensive of computer and disk memory, and any long term storage of text should really be something you do yourself outside of the Recorder. There are notification actions for writing to a file, and it is easy enough to set up an automation, triggered by a state change, to capture and write the new state (and timestamp) to a text-file. This I do for several items of specific interest, and it is then up to me to maintain the size of the text file generated.

2025-10-01T11:45:07.798903+00:00 Operating Mode 51:51 SELF+TIME+BACK+GRID
2025-10-01T11:46:23.077285+00:00 Operating Mode 17:17 SELF+BACK
2025-10-01T20:21:07.794404+00:00 Operating Mode 51:51 SELF+TIME+BACK+GRID
2025-10-01T20:22:23.094825+00:00 Operating Mode 17:17 SELF+BACK
2025-10-03T15:07:37.691605+00:00 Operating Mode 51:51 SELF+TIME+BACK+GRID
2025-10-04T08:42:08.903581+00:00 Operating Mode 19:19 SELF+TIME+BACK
2025-10-04T10:02:22.291024+00:00 Operating Mode 51:51 SELF+TIME+BACK+GRID
2025-10-04T10:12:38.526178+00:00 Operating Mode 19:19 SELF+TIME+BACK
2025-10-04T10:59:38.619411+00:00 Operating Mode 51:51 SELF+TIME+BACK+GRID
2025-10-04T13:13:37.816000+00:00 Operating Mode 17:17 SELF+BACK
2025-10-08T04:57:07.821086+00:00 Operating Mode 51:51 SELF+TIME+BACK+GRID
2025-10-08T04:58:23.200353+00:00 Operating Mode 17:17 SELF+BACK
2025-10-08T11:33:07.798783+00:00 Operating Mode 51:51 SELF+TIME+BACK+GRID
2025-10-08T11:34:23.064152+00:00 Operating Mode 17:17 SELF+BACK
2025-10-08T21:09:07.861178+00:00 Operating Mode 51:51 SELF+TIME+BACK+GRID
2025-10-08T21:10:23.099311+00:00 Operating Mode 17:17 SELF+BACK
2025-10-09T13:45:07.847429+00:00 Operating Mode 51:51 SELF+TIME+BACK+GRID
2025-10-09T13:46:23.094644+00:00 Operating Mode 17:17 SELF+BACK
2025-10-09T16:33:07.851166+00:00 Operating Mode 51:51 SELF+TIME+BACK+GRID
2025-10-09T16:34:23.280715+00:00 Operating Mode 17:17 SELF+BACK
2025-10-10T18:45:07.839695+00:00 Operating Mode 51:51 SELF+TIME+BACK+GRID
2025-10-10T18:46:23.220888+00:00 Operating Mode 17:17 SELF+BACK
2025-10-22T11:45:07.758834+00:00 Operating Mode 51:51 SELF+TIME+BACK+GRID
2025-10-22T11:46:23.261763+00:00 Operating Mode 17:17 SELF+BACK
2025-10-24T12:57:07.845140+00:00 Operating Mode 51:51 SELF+TIME+BACK+GRID
2025-10-24T12:58:23.143144+00:00 Operating Mode 17:17 SELF+BACK
2025-10-24T14:09:07.748325+00:00 Operating Mode 51:51 SELF+TIME+BACK+GRID
2025-10-24T14:10:23.143975+00:00 Operating Mode 17:17 SELF+BACK

Text-based entity value, saved to local file at change. Of course, you can also write to a separate DB entirely and manage that outside of Home Assistant. I run Node-RED, and have flows to capture my entire state for the weather, utility rates, utility readings, solar and battery system figures, and solar forecasts entities, every hour, written to a separate database.

At least that is how I think it all works.

I can’t answer your direct question, but I have two suggestions which might get you looking at it from a different angle.

First, be aware that the database also has “long-term statistics” tables which keep summary values forever. Not, as you say, each time a light goes on or off, but averaged values from specific types of entities. There’s a chance that feature might meet some of your needs, and allow you to use a lower purge_keep_days value and worry less about includes and excludes.

The other suggesting is to develop your own, external process for storing just the data you want, in the format you want. I have automations which use the file integration to append lines of data in comma-delimited text format. I track things like runtime of my HVAC system and sump pumps, for example. This way, I can store, organize and analyze them any way I want, outside of HA, which isn’t really the best tool for those tasks anyway.

Thanks for the replies. Like said; I am very new with HA, so maybe I do things not correct and I am already sure that there are better ways of doing things. But I learn that stuff as we go along ofcourse. Everybod need to start somewhere…
What I would like to see is long term history for my Energy and Energy Costs; these are my primary sensors for it. So that I am able to see, for example, 3 years in the past in the month september how much energy my solar created in comparison with solar last september. Or how much power I used. Hopefully I can setup some nice apex-graphs in the future showing this stuf, but I haven’t done that yet (only one at this moment :wink: ) .

I also would like to enhancy my energy with energy costs, that was something I used quite frequently in my old Domoticz installation. I have something setup; but not quite sure if there are better ways so I need to invest this better and see if things are correct. But basically I am using templates and automation here… but this part I do not have nice reports for yet.
I also have around 50 shellies in my house which several are able measure power, so ten days is also really short here. .

On my older Domoticz setup that I have run for 10 years I look at these stuff quite frequent so I would like to achieve the same goals with HA.

Sometimes 10 days is also quite short. As an example; I have a custom logbook card on my dashboard which shows the kodi movie files I played. I would like some longer logging for this custom logbook cards then 10 days; let’s say 3 months would be OK; but ofcourse not 3 years. Disabling the recoder will not give me an option for this.

But I am not quite sure what to do now and what a step forward will be and I am also not quite getting it yet. I see these possibilities:

  1. Disable the recoder; because utility sensors and template (setup for measurements) sensor are already stored indefinitely (i think). Everything not related to this kind of entites; like my kodi logbook; bad luck and it is stored for a maxium of 10 days. No way to override that.
  2. Setup the Recorder; but honoustly I really don’t know how anymore. What is the best way to set this up and how does this help achieving my goal without blowing up the database in the future?
  3. Offload everything that needs to be stored long term; but then I need to find out then how this works and how this then integrated with HA.

Thanks in advance for all the help!

Hello Robbin,

Influx is a time based database and there are straightforward integrations to just grab a copy of everything that happens in HA and then you can work with data there.
You really don’t want your HA database to get too big. It needs to be quick on the computer you have to deal with all the events that are flying thru. Big data storage gets in the way at some point.
I suggest set recorder to default, let it run like the HA Devs intended, and do data mining in influx. This includes going back to SQLite instead of MariaDB.

Thanks; I am not quite sure if I want to go this way already now using the influxdb;I definitely also look into this… but I just want to try out what happens using the native stuff… There must be something possible I think?.

What happens when I set the Purge_Keep_Days to 1 or 2 months in te recorder? And I do not use any include or Exclude parameters; Are the P1 sensors then still long term stored or not? And if not, what will happen when I only exclude the P1 sensors but where I do not use any Include sensor anymore?

I’ll try to answer, but I feel like I’m not being any more helpful than the existing documentation about Recorder and Long-Term Statistics.

First of all, no, it’s not possible to fine-tune the duration individual entity data are kept in Recorder. You can exclude entities from being kept altogether. And as you’ve found, there are ways to include and exclude whole groups of entities. But otherwise, every state change is kept for purge_keep_days, no more, no less.

For long-term statistics, this is from the Home Assistant Glossary:
Home Assistant saves long-term statistics for a sensor if the entity has a state_class of measurement, total, or total_increasing. For short-term statistics, a snapshot is taken every 5 minutes. For long-term statistics, an hourly aggregate is stored of the short-term statistics. Short-term statistics are automatically purged after a predefined period (default is 10 days). Long-term statistics are never purged.

I think it would be good to spend the time now getting this right. Exclude “chatty” entities you don’t really want spamming your database. Make sure the entities you care about keeping long-term data on are in a state_class which is put in long-term statistics.

This thread is getting a bit dated now, and some database structures may have changed, but it’s great reading for understanding how Recorder works, and how to tune it for your needs.

Thanks for the links!

I think I am getting it. The recorder is for the short term statistics and that will be transfered to the long term where it stays forever if it has state-class. Like the utility sensors or within templates (correct?). If the recorder excludes entities, there is no short-term statistics at all so nothing can be transferred to long term…

So I will look into entities which have allot of noice to see what the do in the database first. And stuff where I used numeric input helpers; maybe I need to change that to template sensors with the state class (if possible; don’t know) if I need to store them long term…

Yes, you’re on the right track!

I’ll share some canned SQL which I’ve plagiarized from other posters here on this forum. I use these to review my Recorder database and identify entities which are using up more space than they’re worth.

This one will give you a count of records in the states table, along with the percentage of total states records that entity represents:

SELECT
  COUNT(*) AS cnt,
  COUNT(*) * 100 / (SELECT COUNT(*) FROM states) AS cnt_pct,
  states_meta.entity_id
FROM states
INNER JOIN states_meta ON states.metadata_id=states_meta.metadata_id
GROUP BY states_meta.entity_id
ORDER BY cnt DESC

This one does the same sort of thing for the events table:

SELECT
  COUNT(*) as cnt,
  COUNT(*) * 100 / (SELECT COUNT(*) FROM events) AS cnt_pct,
  event_types.event_type
FROM events
INNER JOIN event_types ON events.event_type_id = event_types.event_type_id
GROUP BY event_types.event_type
ORDER BY cnt DESC

A funny thing about the HA database is that some static data about entities are stored redundantly in multiple records in the states table. There have been some changes to improve this, but from what I’ve seen it can still be an issue. So I still run this SQL which sorts the records by how much space in the table their attributes consume:

SELECT 
  COUNT(state_id) AS cnt, 
   SUM(
    LENGTH(state_attributes.shared_attrs)
  ) AS bytes, 
  states_meta.entity_id,
  states.attributes_id 
FROM 
  states 
LEFT JOIN state_attributes ON (states.attributes_id=state_attributes.attributes_id)
LEFT JOIN states_meta ON (states.metadata_id=states_meta.metadata_id)
GROUP BY 
  states.metadata_id 
ORDER BY 
  bytes DESC

While you’re in there, you might want to also look at the four statistics tables in the database, to get a feel for what’s being saved long-term.

1 Like

Thanks for the reply; I also found these scripts using you’re links :slight_smile: Thanks for that!!
My MariaDB is already 290 MB large now (recorder is not configured at the moment). And I can already see that what the troubled devices indeed are with the most counts. My Unifi UDM got the most hits; didn’t expect that. Also allot of stuff related to energy creats allot of records, but that is a little bit expected. Also the call-service events, don’t think I need those triggers stored, let’s try to exclude them later…
So with this I can tune the recorder I think and also have good view what it do on the database size and then I can tweak how to setup the recorder…

1 Like

With doing nothing basically in the recorder my storage was around 100 MB per day of transactions with 1500 entities; so it grows pretty fast.
I have run the recorder purge action to clear the database and set that back to 1 day history; the database is now 75 MB; also I do not see long term history anymore in the P1 sensors. Oldest record is around 1 / 2 days in the history graphs…

I have edited the recorder and set it to 5 days; in my test I want to see if I can go back longer then 5 days on the P1 sensors and that they are succesfully shifted to the long term memory.
Any idea how frequently HA is moving the storage from short-term to long-term? I am still afraid that everything is being flushed out after these 5 days; so therefor this test… After that I can tweak the purge to find out how to growth will be with these sensors… My goal is that I have a valid database setup at the start of 2026 which I can use for history…; before that time I do not mind to flush everything… …

As you’re finding out, the default setting in HA, which is to save every state change in the database, is less than ideal.

I think this link will answer your question about how and when long-term statistics are stored:

To summarize, from my reading it appears that state changes are stored in 5-minute aggregates in the short-term statistics tables, then aggregated to hourly values in the long-term statistics tables. I can’t confirm this since I don’t use any statistics within HA.

Make sure the entities you want to keep statistics for have one of these three state_class values: measurement, total or total_increasing.

If they’re not, you can change them in customize.yaml. Likewise, if you don’t want to spam the database with entities you don’t care about, you can remove the state_class in that same yaml file like this:

sensor.third_reality_plug_5_pm_ac_frequency:
  state_class: none
sensor.third_reality_plug_5_pm_power_factor:
  state_class: none

Going back to the basics.

The HA Recorder Integration runs all the time.

It has three tables - history, short-term statistics, and long-term statistics.

The Recorder captures all events and state changes, from the event-bus, as they happen. It writes to disk every few seconds. All entities and events are captured (unless you exclude any particular entities). If you look at Recorder History you will see a list of states+timestamps for every entity, captured at each entity state change event. The HA ‘history’ and ‘log-book’ use this data to display the exact history of an entity state value, and the change-events that have taken place.

The Recorder also runs statistics summary capture. This runs all the time, at five (5) minute intervals. Every 5 minutes, the Recorder takes a summary of every entity that has a numeric state, and a class ‘measurement’ (or total, total-increasing). This summary contains just the minimum, maximum, average, and change values of the numeric state over the 5 minute period. This record is captured to short-term statistics. Every five minutes. All the time.

Every hour, on the hour, the Recorder goes through the short-term statistics table, and captures a summary for the past hour. This summary goes into the long-term statistics. This is a small record of just a few numeric values (min, max, average, change, final state) there are only 24 of them per day, and it only records entities with a numerical value.

Since the Recorder database grows at a large rate, it must be purged regularly to keep enough free disk space for HA to run. The purge happens at 04:10 in the morning, every day. The purge removes EVERYTHING that is older than (default) 10 days. The purge removes all history, and all short-term statistics. Only the long-term statistics are left. These values, and only these values, stay forever.

It does not work like that. The Recorder captures long-term statistical summary every hour.

Note:
During the default before-purge time - all history, all short-term statistics, and all long-term statistics exist side by side.
After the purge time, only the long-term statistics remains.

The long-term statistics can be viewed using the new ‘recorder.get_statistics’ action. If you ask for ‘5 minutes’ I think it takes this from the short-term stats table, so asking for something older than the purge period will return nothing.

If you ask for ‘hour’ this comes from the long-term statistics table, and you can go back in time as far as records exist.

Here is my long-term statistics for one particular entity (power value in Watts from my east facing solar panels). Saved at 11:00 this morning for the period 10:00 to 11:00.

statistics:
  sensor.solar_p1:
    - start: "2025-10-28T09:00:00+00:00"
      end: "2025-10-28T10:00:00+00:00"
      min: 184
      max: 667
      mean: 437.0888425441667
    - start: "2025-10-28T10:00:00+00:00"
      end: "2025-10-28T11:00:00+00:00"
      min: 143
      max: 1081
      mean: 490.0312747941667

To be very clear.

Only the statistics of (some of) the numerical state value entities are captured (short/long-term).

The actual detailed figures available - minimum, maximum, average, sum, change, state - depend on the class of the entity. For measurement, you should see variously min, max and average. For total and total increasing you should see variously change, sum, state.

History is what happened in the past. Only the history table holds that, and that gets purged, and you can’t keep it forever.

Statistics is a summary snapshot of a numerical value over a period of time. The long-term statistics is held forever. This is the only ‘long term’ anything in Home Assistant. Unless you keep the data yourself.

And, to demonstrate, here is my solar power (from my inverter) as hourly stats dating back to June 1st 2022.

statistics:
  sensor.mb_solar_power:
    - start: "2022-06-01T05:00:00+00:00"
      end: "2022-06-01T06:00:00+00:00"
      min: 0
      max: 484
      mean: 191.13861152277778
    - start: "2022-06-01T06:00:00+00:00"
      end: "2022-06-01T07:00:00+00:00"
      min: 221
      max: 1952
      mean: 640.3315735897222
    - start: "2022-06-01T07:00:00+00:00"
      end: "2022-06-01T08:00:00+00:00"
      min: 690
      max: 2142
      mean: 1608.0125178930557
    - start: "2022-06-01T08:00:00+00:00"
      end: "2022-06-01T09:00:00+00:00"
      min: 511
      max: 3077
      mean: 2130.846770863889
    - start: "2022-06-01T09:00:00+00:00"
      end: "2022-06-01T10:00:00+00:00"
      min: 778
      max: 3206
      mean: 1463.142307587222
    - start: "2022-06-01T10:00:00+00:00"
      end: "2022-06-01T11:00:00+00:00"
      min: 980
      max: 4405
      mean: 2036.1095905494446
    - start: "2022-06-01T11:00:00+00:00"
      end: "2022-06-01T12:00:00+00:00"
      min: 1053
      max: 4510
      mean: 2278.3158395533333
    - start: "2022-06-01T12:00:00+00:00"
      end: "2022-06-01T13:00:00+00:00"
      min: 1185
      max: 4477
      mean: 1784.3980981411112
    - start: "2022-06-01T13:00:00+00:00"
      end: "2022-06-01T14:00:00+00:00"
      min: 1528
      max: 4096
      mean: 2350.343478596667
    - start: "2022-06-01T14:00:00+00:00"
      end: "2022-06-01T15:00:00+00:00"
      min: 1046
      max: 1612
      mean: 1234.6228062375
    - start: "2022-06-01T15:00:00+00:00"
      end: "2022-06-01T16:00:00+00:00"
      min: 1290
      max: 3066
      mean: 1914.6923449669446
    - start: "2022-06-01T16:00:00+00:00"
      end: "2022-06-01T17:00:00+00:00"
      min: 343
      max: 2626
      mean: 2083.810943353333
    - start: "2022-06-01T17:00:00+00:00"
      end: "2022-06-01T18:00:00+00:00"
      min: 583
      max: 1773
      mean: 1542.5219771697223
    - start: "2022-06-01T18:00:00+00:00"
      end: "2022-06-01T19:00:00+00:00"
      min: 688
      max: 1302
      mean: 1001.1682805966667
    - start: "2022-06-01T19:00:00+00:00"
      end: "2022-06-01T20:00:00+00:00"
      min: 0
      max: 702
      mean: 288.7083002488889

1 Like

Awesome. Thanks for the detailed information. I can indeed see the long term statistics. This should go in into a wiki :slight_smile: