I have an increasing CPU utilization issue…it was stable for quite a long time but there have been two really sharp increases in CPU consumption at the start of January, and again at the end as shown in the Influx graph
It isn’t causing any huge problems yet, but I want to know why I have jumped from 3% to 9% without really making any huge changes. I suspect a configuration error or a misbehaving integration but I do not know how to troubleshoot. I am running HA Supervised on a dedicated Intel NUC.
I haven’t installed py.spy and run that…because to be fair I can’t find any clear instructions and those I’ve tried to follow result in warnings about ‘Protected Mode’. I specifically run HAOS so I don’t need to tinker in the bowels of the system…if py.spy is a required component then surely it should already be there?
I have however installed the profiler integration and run it for 5 minutes (because I read in a post that was a good thing to do)…but I have no idea how to interpret the results…or how to attach the resulting outputs to this post since only images are accepted.
Ouch…the main problem there is that one of the files isn’t plain text, and the other has 35k lines…I’m always up for a challenge, but not that kind of challenge.
@tom_l - So I see. Thanks for pointing that one out…I don’t know how you manage to stay on top of it all!
However, I’m pretty sure that’s not my problem…if I zoom in on the graph you can see two step changes - One on 2 Jan, the other on 30 Jan:
Each step is a solid 3% jump…and both steps predate 2022.2…which in and of itself does not seem to have made any significant impact on my side…
So for me that leaves the challenge of trying to figure out which integration or config change has caused the change…and obviously I’d prefer not to start pulling things apart because that would make a big mess!
You don’t have to provide all 35k lines of logs, but maybe just the logs around those sharp increases.
Maybe you have combed through your logs already? What have you seen?
Also is it supervised or HAOS? I see this thread under HAOS, but also see mixed remarks.
My bad. It’s definitely HAOS…my brain was playing tricks on me. I also do not have logs all the way back to the point where the step changes in CPU utilization occur…I was referring to the output of the Profile tool…just in case that was helpful.
And, just the be clear…if you look at my original screenshot the 3% step changes in the CPU are permanent…it’s not just a spike…the two subsequent images have difference scaling on the Y-axis so the second looks like less of a jump but it too is 3%…the main point of the second set of pics was to highlight the date that the changes happened…it’s before the 2022.2 release.
So, something is clearly doing something in the background that it shouldn’t be doing…so if not the results of the profile tool what else could I try?
Hi! I’m having the same issue, roughly around the same HA version (it started when I updated from 2021.12.10 to 2022.2.9), running on RPi 3 under HAOS.
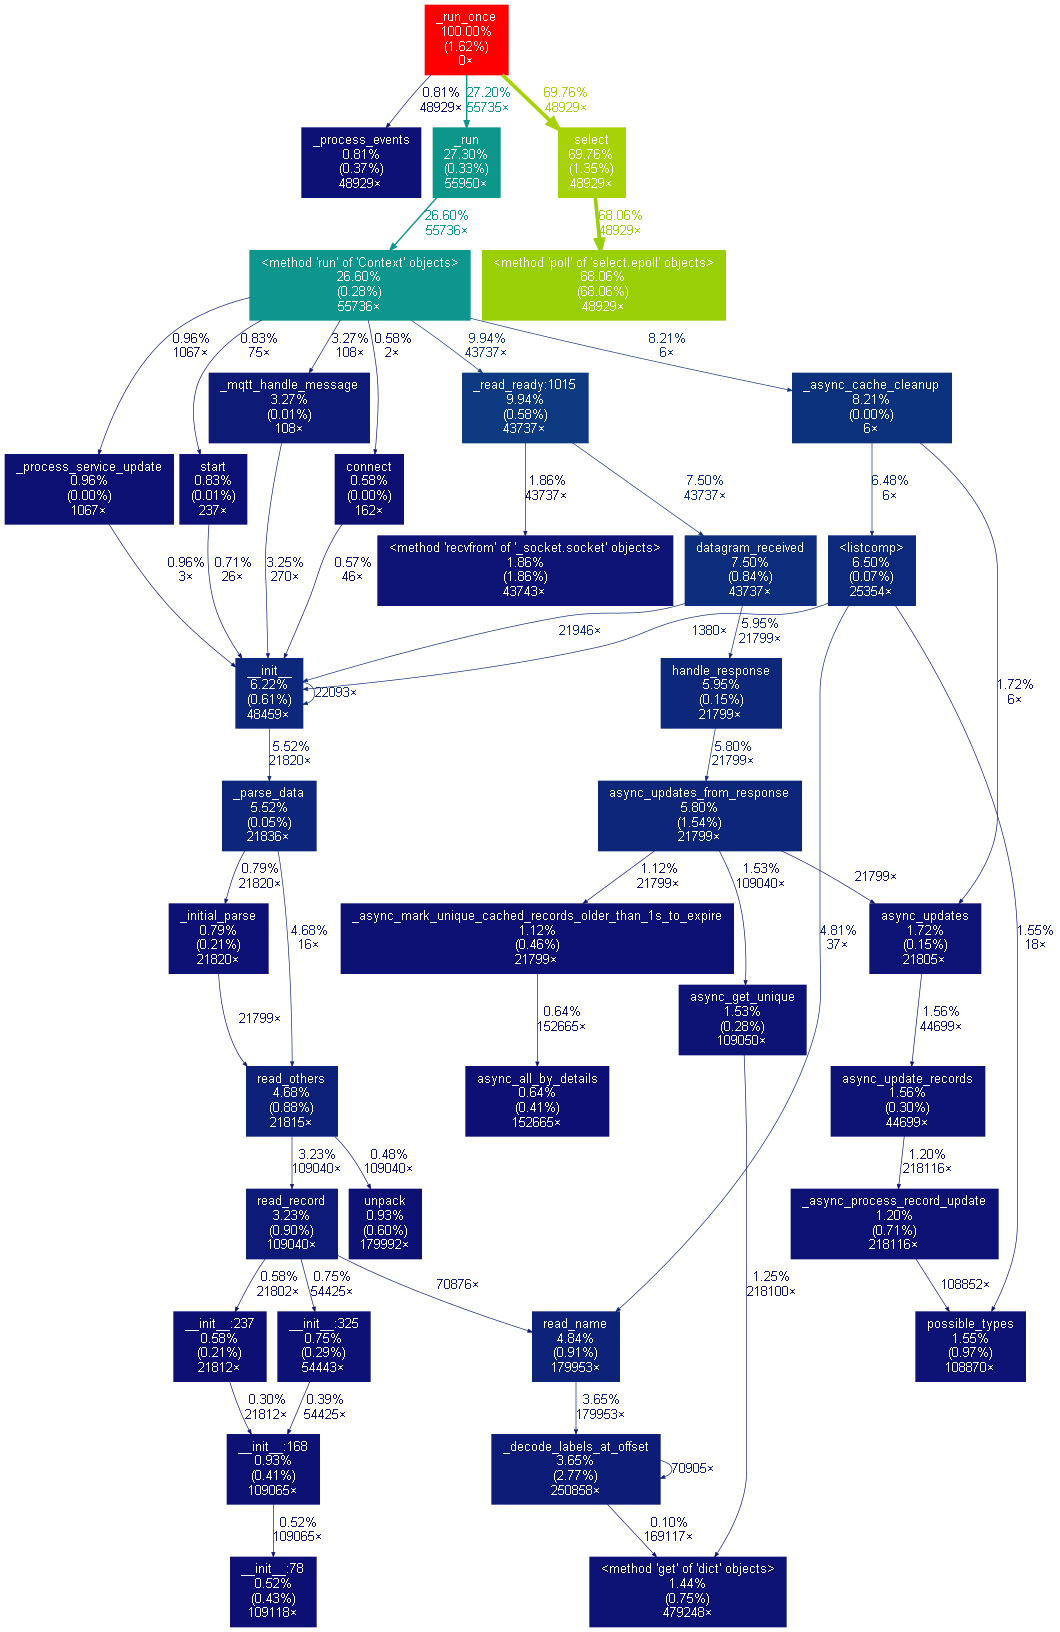
In both your profiles and on mine I can see an extremely high amount of time spent on method 'poll' of 'select.epoll' objects (in my case, 95% of the time). Would that be a clue? I haven’t seen it mentioned anywhere else. From a extremely quick web search, that seems to be the stacktrace when the Python interpreter is reading data from an external program. I’m not sure about that, though.
Not that it will help…but I never found a solution to my problem. However, one day it just magically stopped - it may have been as a result of a HA update or a HACS integration update, or an update on a managed device (e.g. a new version of the Unifi Controller software), or even a config change I made to my yaml files.
Whatever it was the previous pattern over the several months of the CPU escalation from 3%, to 6%, and then always at 9% suddenly stopped and it went back to 3% or lower. Even the CPU % graph from InfluxDB clearly showed a big sudden step change down from ~10% to ~3%. I’d spent weeks trying to find the problem, including disabling integrations one at a time to find the source and never had any success.
I wish I could tell you what made the difference…but it it likely that something somewhere is just looping for no reason…and just like it started you may find one day that it just vanishes.