Hi everyone! ![]()
I’m excited to share a new custom Lovelace card I’ve been working on for visualizing AS7341 spectral sensor data in Home Assistant. This is perfect for anyone monitoring grow lights, analyzing light quality, or optimizing plant growth conditions.
What is it?
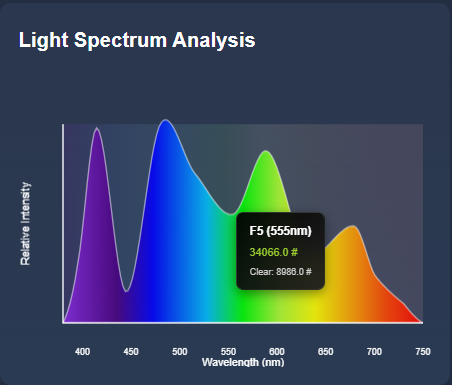
The AS7341 Spectrum Card displays real-time spectral data from the AMS AS7341 11-channel spectral sensor in a beautiful, interactive visualization. It shows the complete light spectrum from UV to Near-IR with smooth rainbow gradients.
 Key Features
 Beautiful spectrum visualization - Smooth rainbow gradient showing your light’s spectral distribution
 Interactive tooltips - Hover over the spectrum to see exact values at any wavelength
 8 spectral channels - Displays all AS7341 channels (415nm - 680nm)
 Clear & NIR support - Shows Clear and Near-Infrared readings
 Smart calibration warnings - Automatically detects sensor saturation or weak signals
 Modern design - Sleek, gradient-based UI that fits perfectly with Home Assistant
 Fully responsive - Works great on desktop, tablet, and mobile
How It Works
The card reads data from your ESPHome-configured AS7341 sensor and creates a smooth, interpolated spectrum curve. When you hover over the chart, you can see exact values at any wavelength. The card even automatically detects if your sensor is saturated or needs calibration adjustments!
Installation
Via HACS (Recommended)
- Open HACS → Frontend
- Click ⋮ menu → Custom repositories
- Add:
https://github.com/goatboynz/HA-par-spectrum-card - Category: Lovelace
- Install and restart Home Assistant
Manual Installation
- Download
as7341-spectrum-card.jsfrom the GitHub repo - Copy to
config/www/ - Add as a Lovelace resource
- Restart Home Assistant
Configuration
ESPHome Setup
First, configure your AS7341 sensor in ESPHome:
sensor:
  - platform: as7341
    atime: 29        # Integration time
    astep: 599       # Integration steps
    gain: X8         # Start with lower gain
    update_interval: 5s

    f1:
      name: "Spectrum 415nm Violet"
    f2:
      name: "Spectrum 445nm Blue"
    f3:
      name: "Spectrum 480nm Cyan"
    f4:
      name: "Spectrum 515nm Green"
    f5:
      name: "Spectrum 555nm Yellow-Green"
    f6:
      name: "Spectrum 590nm Yellow"
    f7:
      name: "Spectrum 630nm Orange"
    f8:
      name: "Spectrum 680nm Red"
    clear:
      name: "Spectrum Clear"
    nir:
      name: "Spectrum NIR"
Lovelace Card
Add to your dashboard:
type: custom:as7341-spectrum-card
title: Light Spectrum Analysis
entities:
  f1: sensor.spectrum_415nm_violet
  f2: sensor.spectrum_445nm_blue
  f3: sensor.spectrum_480nm_cyan
  f4: sensor.spectrum_515nm_green
  f5: sensor.spectrum_555nm_yellow_green
  f6: sensor.spectrum_590nm_yellow
  f7: sensor.spectrum_630nm_orange
  f8: sensor.spectrum_680nm_red
  clear: sensor.spectrum_clear      # Optional
  nir: sensor.spectrum_nir          # Optional
Use Cases
This card is perfect for:
 Grow light monitoring - Ensure your plants get the right spectrum
 Light quality analysis - Compare different light sources
 Natural light tracking - Monitor sunlight spectrum throughout the day
- LED testing - Analyze LED bulb spectral output
- Color temperature monitoring - Visualize light color characteristics
Technical Details
The AS7341 sensor measures light at 8 specific wavelengths:
- F1 (415nm) - Violet
- F2 (445nm) - Blue
- F3 (480nm) - Cyan
- F4 (515nm) - Green
- F5 (555nm) - Yellow-Green
- F6 (590nm) - Yellow
- F7 (630nm) - Orange
- F8 (680nm) - Red
Plus Clear and Near-Infrared (NIR) channels for additional analysis.
The card uses cubic spline interpolation to create smooth curves between measurement points and automatically extends the spectrum to show natural drop-offs at the edges (380-750nm range).
Smart Features
Automatic Calibration Detection
The card monitors your sensor readings and alerts you if:
- Sensors are saturated - All channels showing similar high values
 Signal is too weak - Values are too low for accurate readings
- No light detected - Sensor might be covered or in darkness
It even suggests which ESPHome parameters to adjust!
Interactive Tooltips
Hover anywhere on the spectrum to see:
- Exact wavelength position
- Interpolated intensity value
- Specific channel data when near sensor points
- Clear and NIR values in their respective regions
Links
- GitHub Repository: GitHub - goatboynz/HA-par-spectrum-card
- Documentation: Full README with troubleshooting guide
- Issues/Feature Requests: GitHub Issues
Future Plans
I’m considering adding:
- Historical spectrum comparison
- Multiple sensor support on one card
- Export spectrum data to CSV
- PAR calculation display (optional)
Let me know if you have any suggestions or feature requests!
Credits
Built for the Home Assistant community with ![]()
Special thanks to:
- AMS for the AS7341 sensor
- ESPHome team for the integration
- Home Assistant community for inspiration
Questions? Issues? Suggestions?
Feel free to ask here or open an issue on GitHub. I’m happy to help with setup or troubleshooting!
If you find this useful, please ![]() star the repo on GitHub!
star the repo on GitHub!
#custom-card lovelace ESPHome #grow-lights #spectrum sensor #visualization