Hello,
I am trying to find a way to have a graph in a form of “stacked” bars or lines to represent how each sensor contributes to the overall value.
A tipical use case is this:
1 - one sensor representing the consumption from the grid
2 - one or more sensor representing the various appliances
3 - one template sensor that represent “other” obtained by doing 1-2
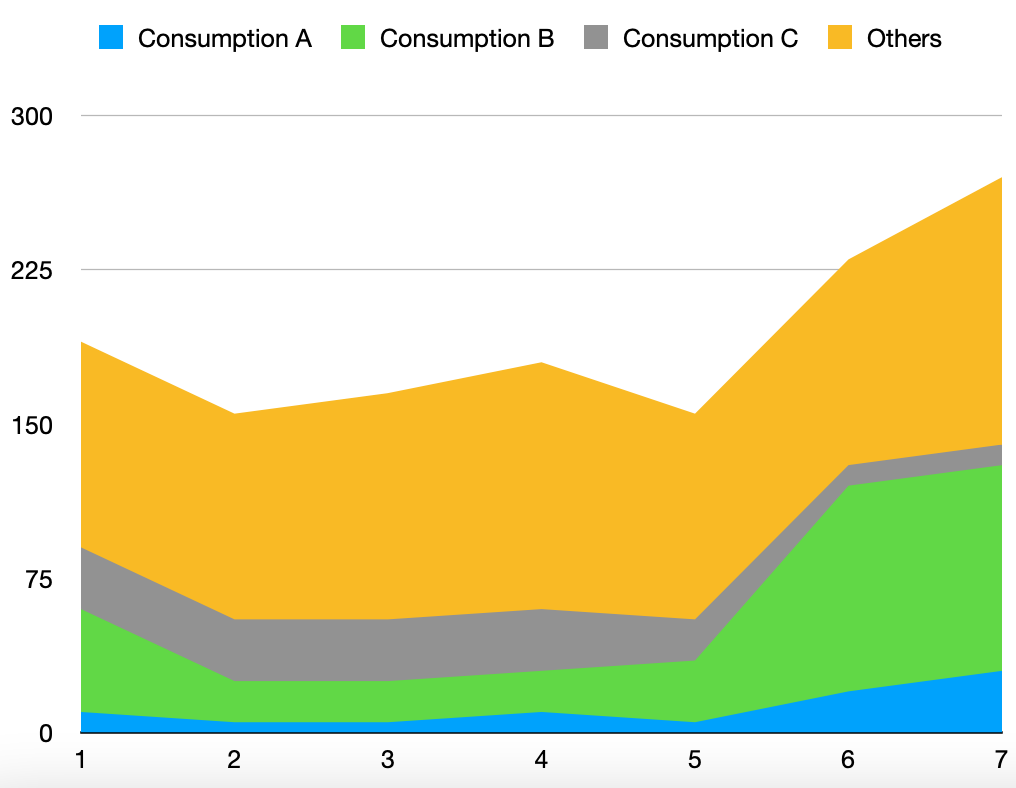
I would be able to graph the sensors 2(one for each appliance) and 3 in a stacked form:
Stacked: true only causes separated graphs to be shown on the same graph. But the entities are not stacked into one bar or curve. They are still shown as separate bars (besides each other).
@onstra12345 Could you please share your code, how you managed to have stacked the bars using multiple entities?
I’m trying and trying, but I’m unable to get it to work unfortunatly.
I would like to know this as well. I wasn’t able to acomplish it. In my case, I would like to have a stacked bar graph showing the energy usage and two line graphs on top showing the produced solar energy and the energy coming from the battery. Unfortunately the two line graphs are stacking as well.
Does anyone have a solution for this?
^^ Note in the above that the point highlighted shows the TV is using ~73W, and the Internet plug ~28W - and the axis on the left shows it to be above 90W - so that makes sense for stacked.
I’ve applied AREA to all_series_config so it applies to all entities, rather than have to do it separately, which would look like the below otherwise (snippet):
series:
  - entity: sensor.dish_washer_plug_current_power
    type: area
  - entity: sensor.washing_machine_plug_current_power
    type: area
  - entity: sensor.tv_plug_current_power
    type: area
  - entity: sensor.internet_plug_current_power
    type: area
I’m looking for a slightly more complicated example. Two stacked additive areas, one substractive area and one non-stacked line, all into the same chart. Does anyone know if this is possible?
I tried with the transform option but couldn’t get the sensor data from the same time period as the entity.
The transform option only gets the current value of the sensor, and not its historic value.
series:
  - entity: ...
    transform: "return x + hass.states['sensor.other_entity'].state;"
I have some of it working accidentally. Honestly I’m not understanding how I got here.
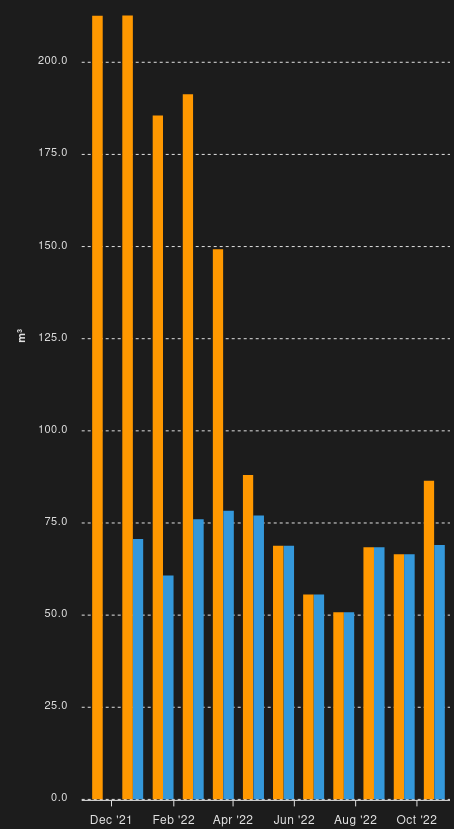
What we have here is the bars:
overlapped - in front of each other, but also the smaller bars are stacked in front of the bigger bar.
instead of:
stacked - on top of each other
Running on the latest everything - HA Core 2025.1.1 + apexcharts-card 2.1.2
The last bar is made of: 132-Total = 34.3 (it’s in the back, and matches the y axis = 34.3), then these two: 132-BC=8.5, and 132-WB=21.1 (these two are stacked on top of each other).
This works for me because the first value is the house total consumption (it’s always the largest value), and the others are portions of it (household appliances).
But how is it “guessing” that I want the first bar below, and the others stacked over it?
But I still have two other issues with this configuration:
The y max auto scaling is being calculated as the sum of all entities stacked, instead of the max value among all the entities.
This is where I’m lost - the only way I could stack the first group H100, is by naming its entities the same. If I change the name, they become stacked. However, the second group is working with different names.
I’ve been puzzling here, people saying it works, but it didn’t on my machine, and I just wanted 1 stacked bar… But I got it working with help of the last posts. I think this behavior changed in versions before, but not sure. For future readers wanting the same simple thing like me:
To me it seems like you now always need the stack_group if you add type
When I don’t add type I get stacked lines with stacked: true
When I add (any) type the lines aren’t stacked with stacked: true
When I add the stack_group: whatever the stacking is back,
If I use a data_generator, it only works with type: line and type: column, not type: area
So resume what works for me in the current versions:
Anyone have an idea how to get an “other” series in the stacked graphs?
In my case, I have energy meters on just some of my circuits. I can make a stacked graph of those, but it’s not showing 100% of my use. I also know the total energy use for the house, so the “other” series would be the difference.
What I’m after is having the “other”, which is total - sum(individuals) added onto of the first graph bars.
This becomes more useful if, say, drawing a pie graph.
I did try a bunch of things using transform, but I can’t really see how that could work w/o having access to the other data points in the series of the same time slice.