I’d just like to add my setup experience in case it helps anyone else. It wasn’t too difficult, but certainly not what I would call easy.
Firstly, install LocalTuya via HACS as has been covered plenty of times before and add your Power Meter device. Now getting all the sensors setup is the challenging thing, and I’ve noticed everyone’s devices seem to be reporting different DP ID values. Hopefully this will be a universal way for everyone to work out what they need to configure - no matter what random AliExpress device they ended up with or how many clamps it has. This should work for everyone…
You will need to have a Tuya Developer account and add your device to a Tuya app so it is visible in the Developer Portal to follow these steps. Once it’s in LocalTuya you should be able to kill it’s connection to the cloud, but I have not tested this.
In the native HA Tuya integration, I was only getting data from one clamp but the SmartLife app was getting both. Noting the steps here -
I was able to ensure all the data points for both clamps were being presented in the cloud, this is important for figuring out what DP ID = what data value. I found the native integration is not setup to ingest data for more than one clamp, so this change in the cloud data has no effect. LocalTuya is required to display what we want, however enabling DP mode is just for identifying the data that is coming from the device locally - you can turn it off again later if you want…
Now, In the Tuya Developer Platform if you are not there already find your Devices as described before and click ‘Debug Device’ on the far right.
This should launch a new window.
-
Find your power meter device again from the list on the left side (or search by it’s ID).
-
Click Device Logs tab
-
Right click anywhere and select ‘Inspect Element’ and put your hackerman hat on.
-
In the Developer window that has opened select the Network tab (would have been ‘2’ in the image but got cut off)
-
Choose any option from the ‘Select DP ID’ drop-down (1)
-
You should see network requests in the Network tab you opened in the previous step. Find the entry for ‘list’ (3) and click that.
-
Select the ‘Payload’ tab (4) this has data that is sent to the server to request information about what you selected in the drop down list. In this case ‘Add Energy’
-
Look for the ‘code’ entry at the top (5) and make note.
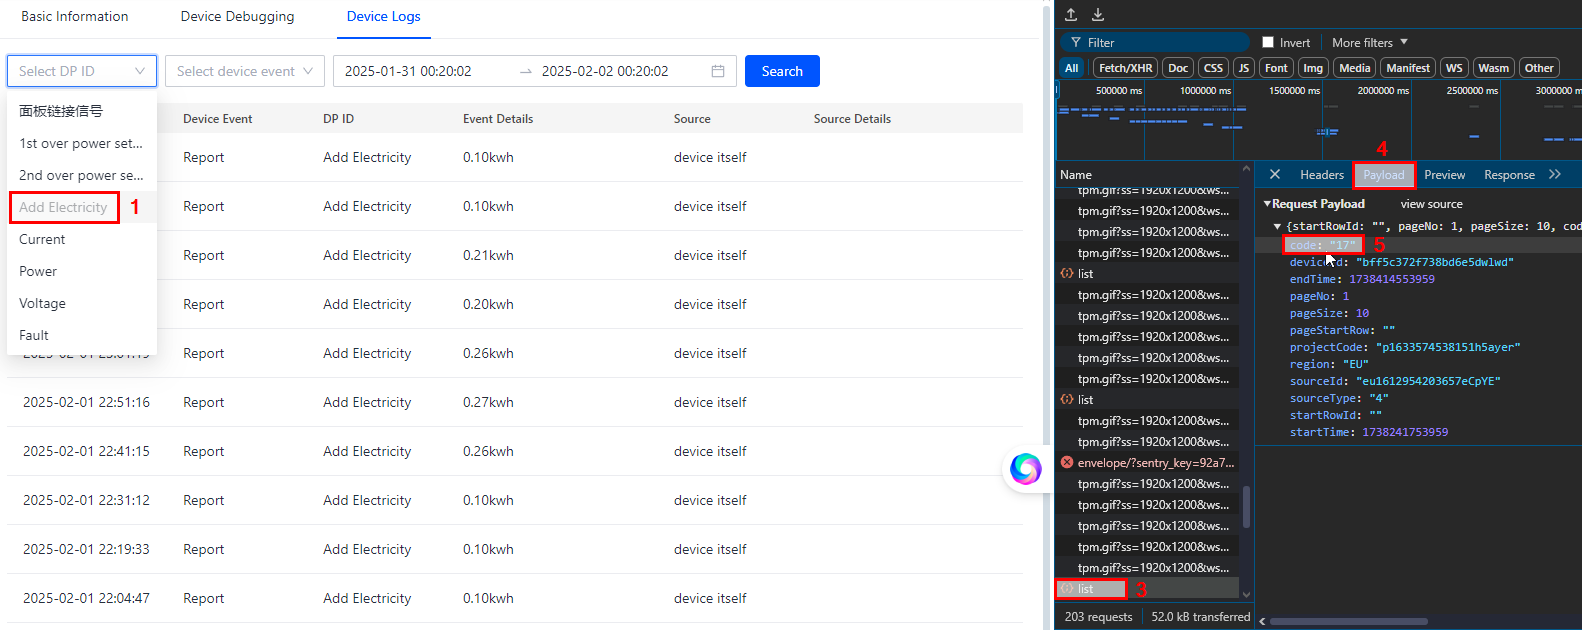
So in this example we have learned that my device has accumulative data in kWh for energy (not power) reported under DP ID of 17. Following the same steps for each DP ID in the drop down I got ID 18 for Current A, 19 Power W, 20 Volts V and so on for as many clamps as the device supports. There are some bonus overcurrent and fault states as well that may be useful.
This info was then easy enough to translate across into HA with a little fiddling of the scale factors to appear correct, noting airampg’s bug observation above.
There’s still a bit of data wrangling to do as these devices are not truly bi-directional as they often claim, but nothing a bit of maths can’t sort out.
Until the native integration is updated to accommodate x number of clamps, I hope this helps everyone get going with their energy dashboards.