hola
Al final puedes ver la potencia en home asistan, como lo haces?
I installed solar panels. However, from what I see, the measurement, although it says it is bi-directional, does not show me how much energy I produced. It seems like he always scores positive. I’m sorry for my ignorance, but how can I see these values you mentioned in the message above? I think some of them may contain how much was consumed from the network and how much was returned.
thank you for sharing. I have a similar device (looks same).
But my data may be different:
101: Voltage
102: frequency
103: total power
104: Power Factor b
106: power B
…
I have not all the data
Can someone help me please? I have a Tuya energy meter that I integrated very well but I can’t understand all the id. Thanks
This is my item https://it.aliexpress.com/item/1005007774329239.html?spm=a2g0o.productlist.main.21.5984nfNmnfNmlw&algo_pvid=ef58ffaf-3f08-465b-9a58-d5584c13b36b&algo_exp_id=ef58ffaf-3f08-465b-9a58-d5584c13b36b-10&pdp_npi=4%40dis!EUR!37.93!10.73!!!282.23!79.88!%402103985c17349599840852315eee56!12000042158277883!sea!IT!0!ABX&curPageLogUid=enZgiwL9pvSL&utparam-url=scene%3Asearch|query_from%3A
  "dps_strings": [
    "1 (value: True)",
    "2 (value: True)",
    "17 (value: 2)",
    "18 (value: 0)",
    "19 (value: 0)",
    "20 (value: 2305)",
    "26 (value: 0)",
    "101 (value: 113)",
    "102 (value: 2961)",
    "103 (value: 6682)",
    "104 (value: 2307)",
    "107 (value: 0)",
    "108 (value: 0)"
Hi all,
I got one of these as well and, unfortunately, had a different configuration to the other ones shown here. I will share my config in case it helps anyone.
101 - Current A - A - 0.001
103 - Power A - W - 0.1
115 - Forward total power A - Kw/h - 0.01
120 - Power Factor A - - 0.01

102 - Current B - A -  0.001
104 - Power B - W - 0.1
117 - Forward total power B - kW/h - 0.01
121 - Power Factor B - - 0.01

105 - Frequency - Hz - 0.01
110 - Forward total power (A+B) - kW/h - 0.01
19 - Total Power - W - 0.01
20 - Voltage - V - 0.1

The rest seem to be sensors for the in-app settings:
122 - dp_report_freq - s -
...
Note: there seems to be a bug with the scaling, but if you type 0.1 then move the cursor to just before the 1 you can add more zeroes.
I’d just like to add my setup experience in case it helps anyone else. It wasn’t too difficult, but certainly not what I would call easy.
Firstly, install LocalTuya via HACS as has been covered plenty of times before and add your Power Meter device. Now getting all the sensors setup is the challenging thing, and I’ve noticed everyone’s devices seem to be reporting different DP ID values. Hopefully this will be a universal way for everyone to work out what they need to configure - no matter what random AliExpress device they ended up with or how many clamps it has. This should work for everyone…
You will need to have a Tuya Developer account and add your device to a Tuya app so it is visible in the Developer Portal to follow these steps. Once it’s in LocalTuya you should be able to kill it’s connection to the cloud, but I have not tested this.
In the native HA Tuya integration, I was only getting data from one clamp but the SmartLife app was getting both. Noting the steps here -
I was able to ensure all the data points for both clamps were being presented in the cloud, this is important for figuring out what DP ID = what data value. I found the native integration is not setup to ingest data for more than one clamp, so this change in the cloud data has no effect. LocalTuya is required to display what we want, however enabling DP mode is just for identifying the data that is coming from the device locally - you can turn it off again later if you want…
Now, In the Tuya Developer Platform if you are not there already find your Devices as described before and click ‘Debug Device’ on the far right.
This should launch a new window.
-
Find your power meter device again from the list on the left side (or search by it’s ID).
-
Click Device Logs tab
-
Right click anywhere and select ‘Inspect Element’ and put your hackerman hat on.
-
In the Developer window that has opened select the Network tab (would have been ‘2’ in the image but got cut off)
-
Choose any option from the ‘Select DP ID’ drop-down (1)
-
You should see network requests in the Network tab you opened in the previous step. Find the entry for ‘list’ (3) and click that.
-
Select the ‘Payload’ tab (4) this has data that is sent to the server to request information about what you selected in the drop down list. In this case ‘Add Energy’
-
Look for the ‘code’ entry at the top (5) and make note.
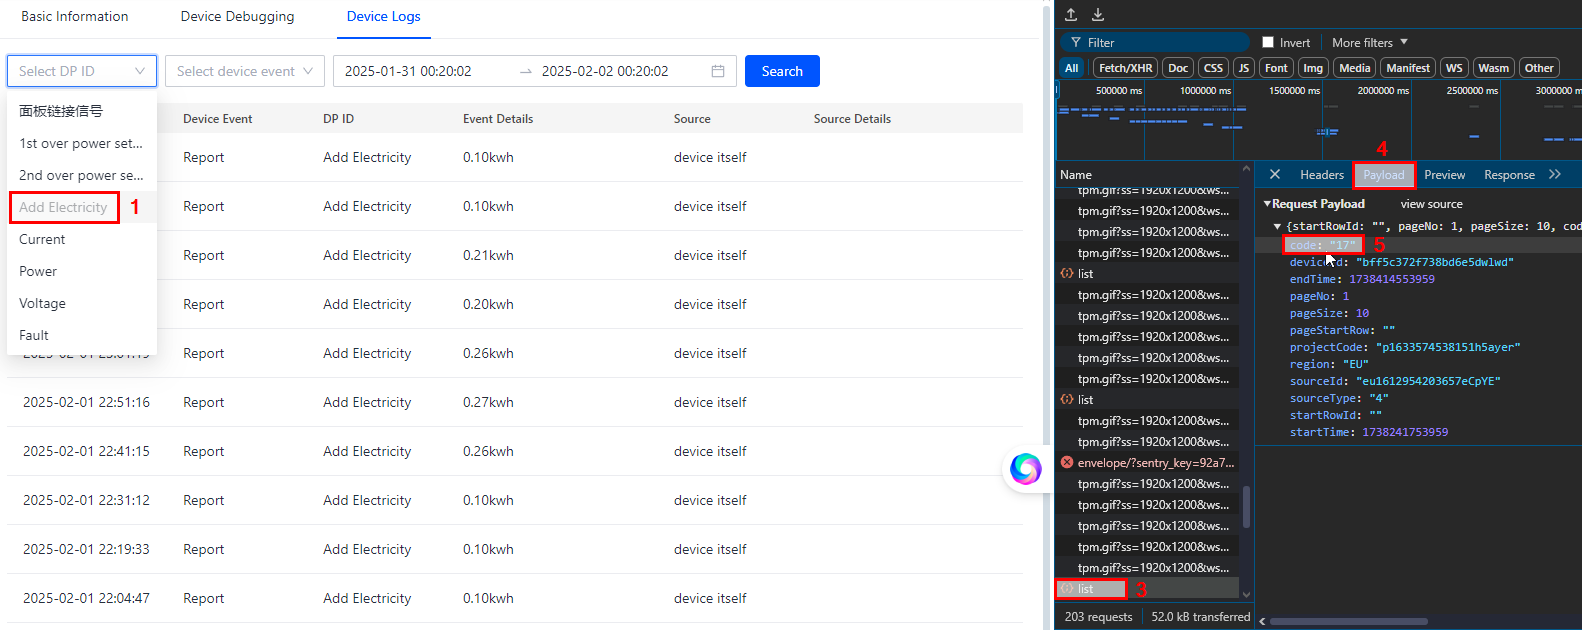
So in this example we have learned that my device has accumulative data in kWh for energy (not power) reported under DP ID of 17. Following the same steps for each DP ID in the drop down I got ID 18 for Current A, 19 Power W, 20 Volts V and so on for as many clamps as the device supports. There are some bonus overcurrent and fault states as well that may be useful.
This info was then easy enough to translate across into HA with a little fiddling of the scale factors to appear correct, noting airampg’s bug observation above.
There’s still a bit of data wrangling to do as these devices are not truly bi-directional as they often claim, but nothing a bit of maths can’t sort out.
Until the native integration is updated to accommodate x number of clamps, I hope this helps everyone get going with their energy dashboards.
1 Like
You’re definitely onto something with this - see my write up below as it was very helpful for me figure out what the ID’s and values actually represented. You’re tip about DP mode was the key to me working it out, so thank you!
Hey Alby,
Looks like the same values I had. Here’s what I found for mine
1 - Switch 1 : True/False - Use switch
2 - Switch 2 : True/False - Use switch
(Clamp 1)
17 - Add Energy : integer - Use sensor, kWh, device class energy, 0.01 scaling factor
18 - Current : integer - Use sensor, A, device class current, 0.001 scaling factor
19 - Power : integer - Use sensor, W, device class power, 0.1 scaling factor
20 - Voltage : integer - Use sensor, V, device class voltage, 0.1 scaling factor
26 - Fault detection : 0/1 - Use binary sensor, default value 0
(Clamp 2)
101 - Add Energy : integer - Use sensor, kWh, device class energy, 0.01 scaling factor
102 - Current : integer - Use sensor, A, device class current, 0.001 scaling factor
103 - Power : integer - Use sensor, W, device class power, 0.1 scaling factor
104 - Voltage : integer - Use sensor, V, device class voltage, 0.1 scaling factor
106 - Something about signal, maybe wifi strength. Wasn’t entirely clear from G Translate.
107 - 1st Over power setting
108 - 2nd Over power setting
Estou com o mesmo problema com PJ-1103C, achei os dpid mais nao funciona
Hi. I did the same job here. Just one observation. #115 and #116 seems to be Inactive Power and not Apparent power. If you observe them, they behave like reactive power. I could notice it after clamping in my solar grid circuits and checking it during cloudy days (where solar gen goes to zero).
I know it’s an old thread. Just an update, everything has been set up correctly for the past 1 year. But I realised there is a data mismatch / not reporting correctly eg: 12 pm, to 2 pm (Random time).
Using Local Tuya - Tuya integration doesn’t seem to show any entities.
Home Assistant:
0.07 kWh (12 to 1 PM)
0.09 kWh (1 to 2 PM)
Smart Life:
0.26 kWh (12 to 1 PM)
0.27 kWh (1 to 2 PM)
Anyone knows how to fix this or Tuya just suck?
Currently under integration/utility_meter - Periodically resetting (Disable)
Automation script to update data every 5 sec
Though out the year I didn’t bother to fix this, till now as I’m planning to integrate kWh cost.
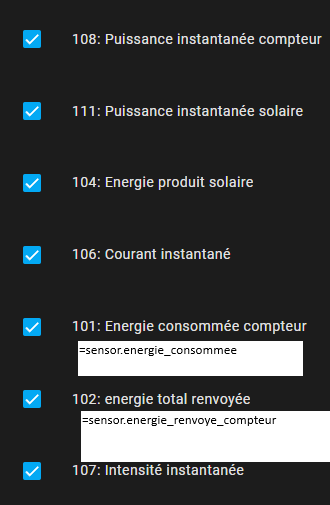
After 8 hours, I finaly succes to integrate PC311_W_TY with local tuya, unlock config in IOT tuya, get local key and add value to energy dashboard. For the last task create a virtual sensor in configuration.yaml from your energy sensor added previously in local tuya.
for me the reverse energy is id 102 (102 - Generation 1 - kW-h - 0.01 - Energy) ) and my configuration (change the sensor name)
# Loads default set of integrations. Do not remove.
default_config:

# Load frontend themes from the themes folder
frontend:
  themes: !include_dir_merge_named themes

automation: !include automations.yaml
script: !include scripts.yaml
scene: !include scenes.yaml
template:
  - sensor:
    - name: "Total reverse energy"
      state_class: total_increasing
      unit_of_measurement: kWh
      device_class: energy
      state: "{{ (states('sensor.energie_renvoye_compteur') | float(0)) }}"
I will check tomorrow if the values in the energy dashboard will be corrects.

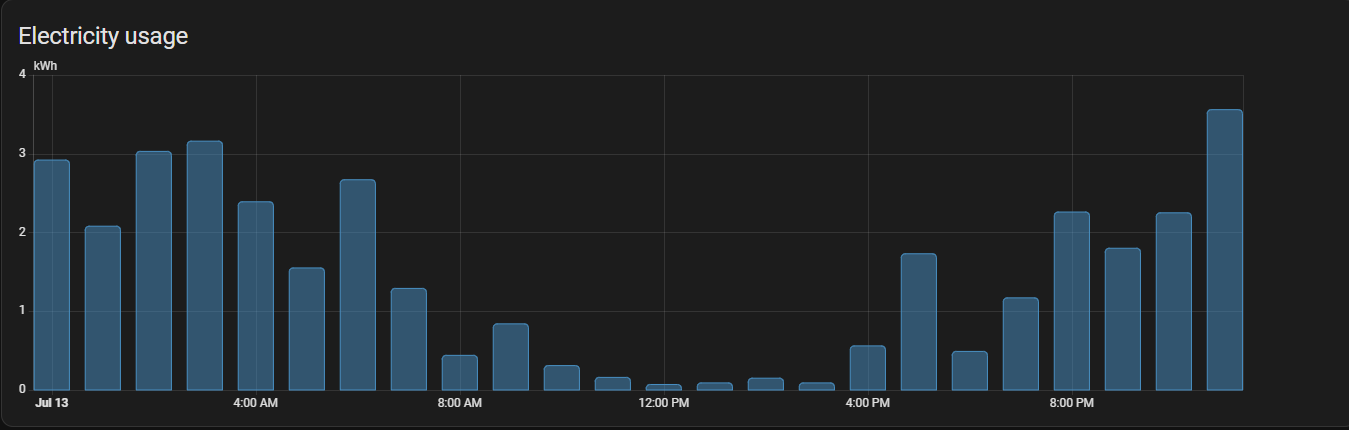
now it works fine and I have to consommed and reverse energy and my solar (ignore data from the 1 day)
template:
  - sensor:
    - name: "Total reverse energy"
      state_class: total_increasing
      unit_of_measurement: kWh
      device_class: energy
      state: "{{ (states('sensor.energie_renvoye_compteur') | float(0)) }}"
    - name: "Total buy energy"
      state_class: total_increasing
      unit_of_measurement: kWh
      device_class: energy
      state: "{{ (states('sensor.energie_consommee') | float(0)) }}"
1 Like
Hope this helps others as took me awhile to get my PJ-1103 (wifi version) connected to the tuya local.
- I would add entry manually (selecting 3.4 protocol) and after entering the details IP was local lan ip (not entering the 3 boxes at bottom) it would say connected but no DP’s found and not add and ask me to enter the details again.
- Next time I enter (1,17,18,19,20) in the ‘Manual DPS’ box below and it allowed me to get to the next selection.
- I chose ‘sensor’ and submit.
- You then get a list of the (1,17,18,19,20) which you need to do 1 at a time with first selection as 1 which you enter the details and submit. Enter ‘Energy Meter’ as Friendly name and leave rest of fields blank and click submit.
- You will go back to the type window always select sensor and make sure to untick about finishing entries. Once you submit you get back to the list again.
- Select 17 and Friendly Name: Current, Unit: A, Device Class: current, Scaling Factor:1000 and submit
- Again select sensor and untick box and submit
- Select 18 and Friendly Name: Power, Unit: W, Device Class: power and submit
- Selecting sensor again untick and submit
- Select 19 Friendly Name: Voltage, Unit: V, Device Class: voltage, Scaling Factor: 10 and submit
- Sensor again and untick and submit
- Select 20 and Friendly Name: Energy Total, Unit: kWh, Device Class: energy, Scaling Factor 100
1 Like
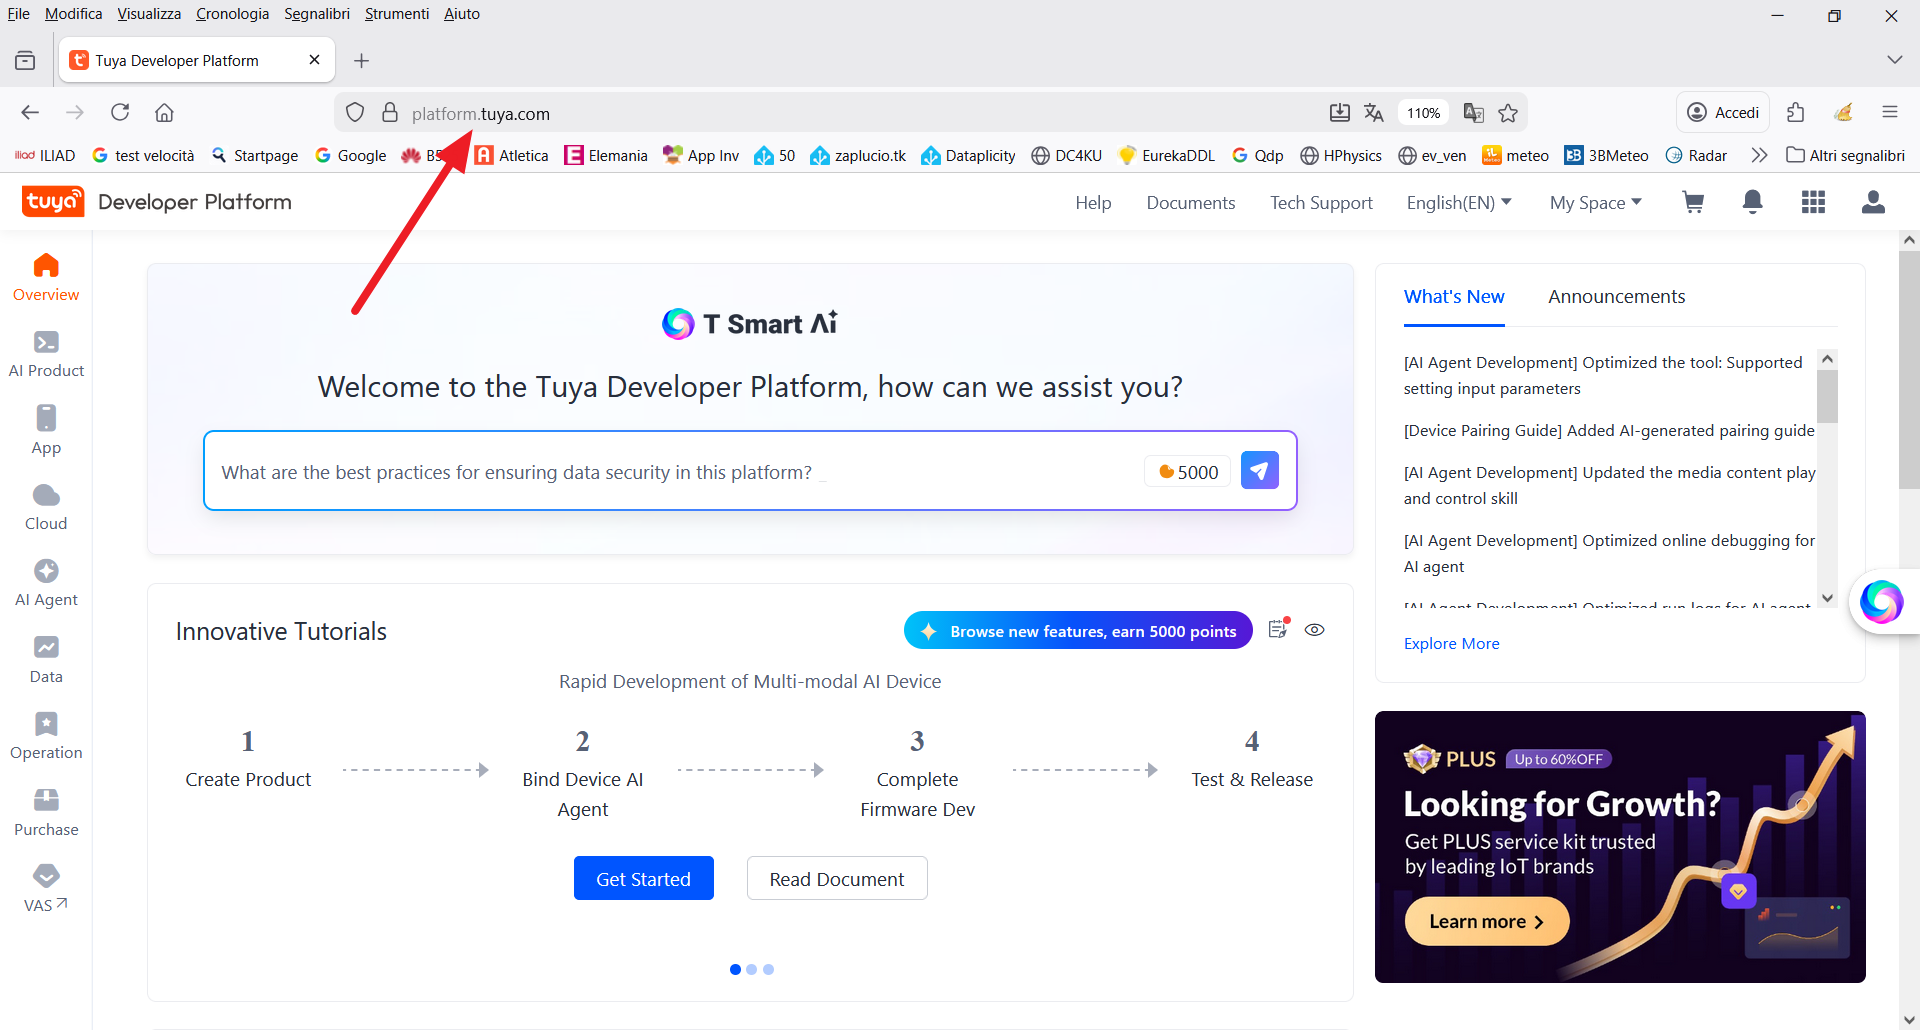
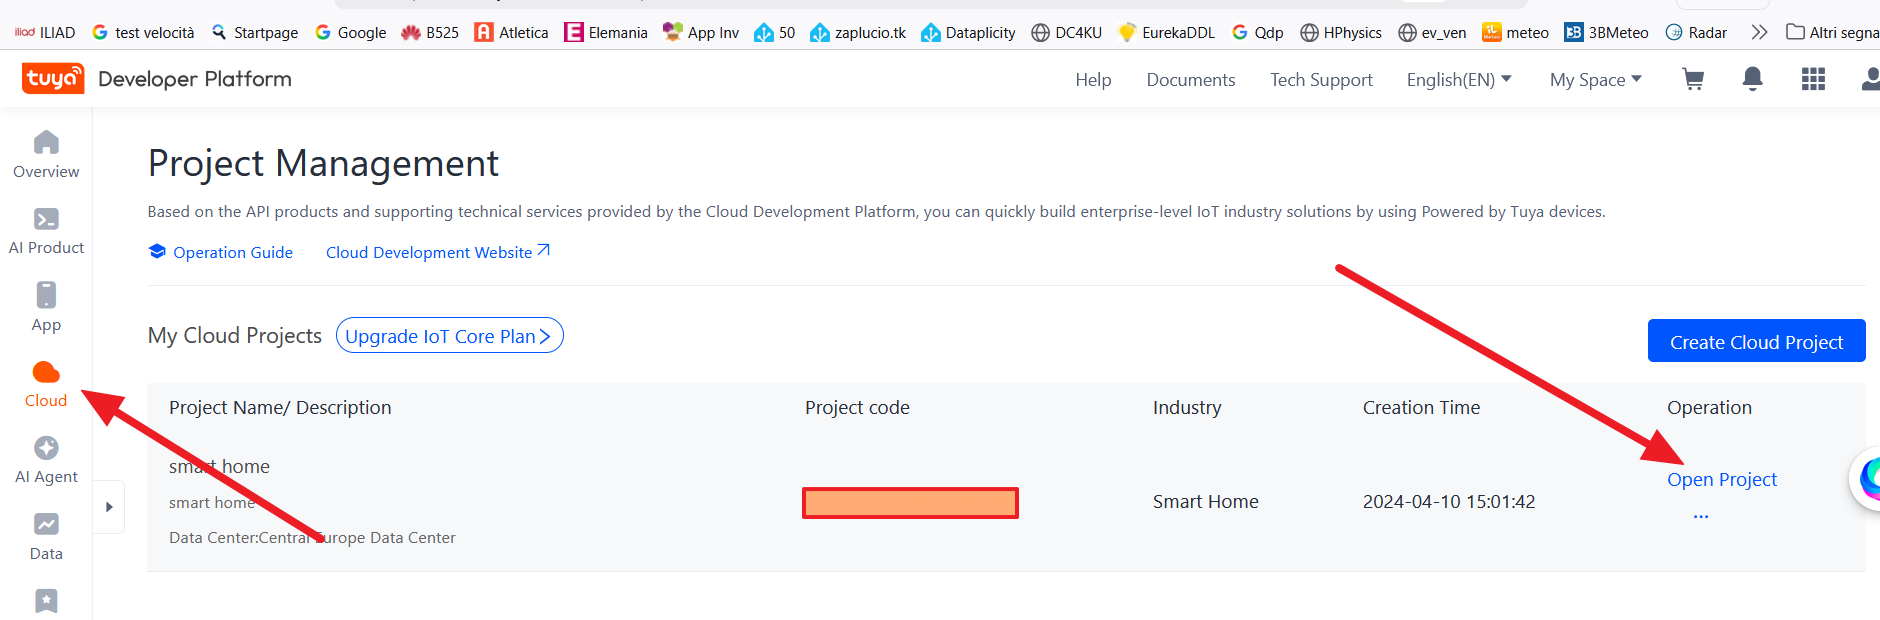
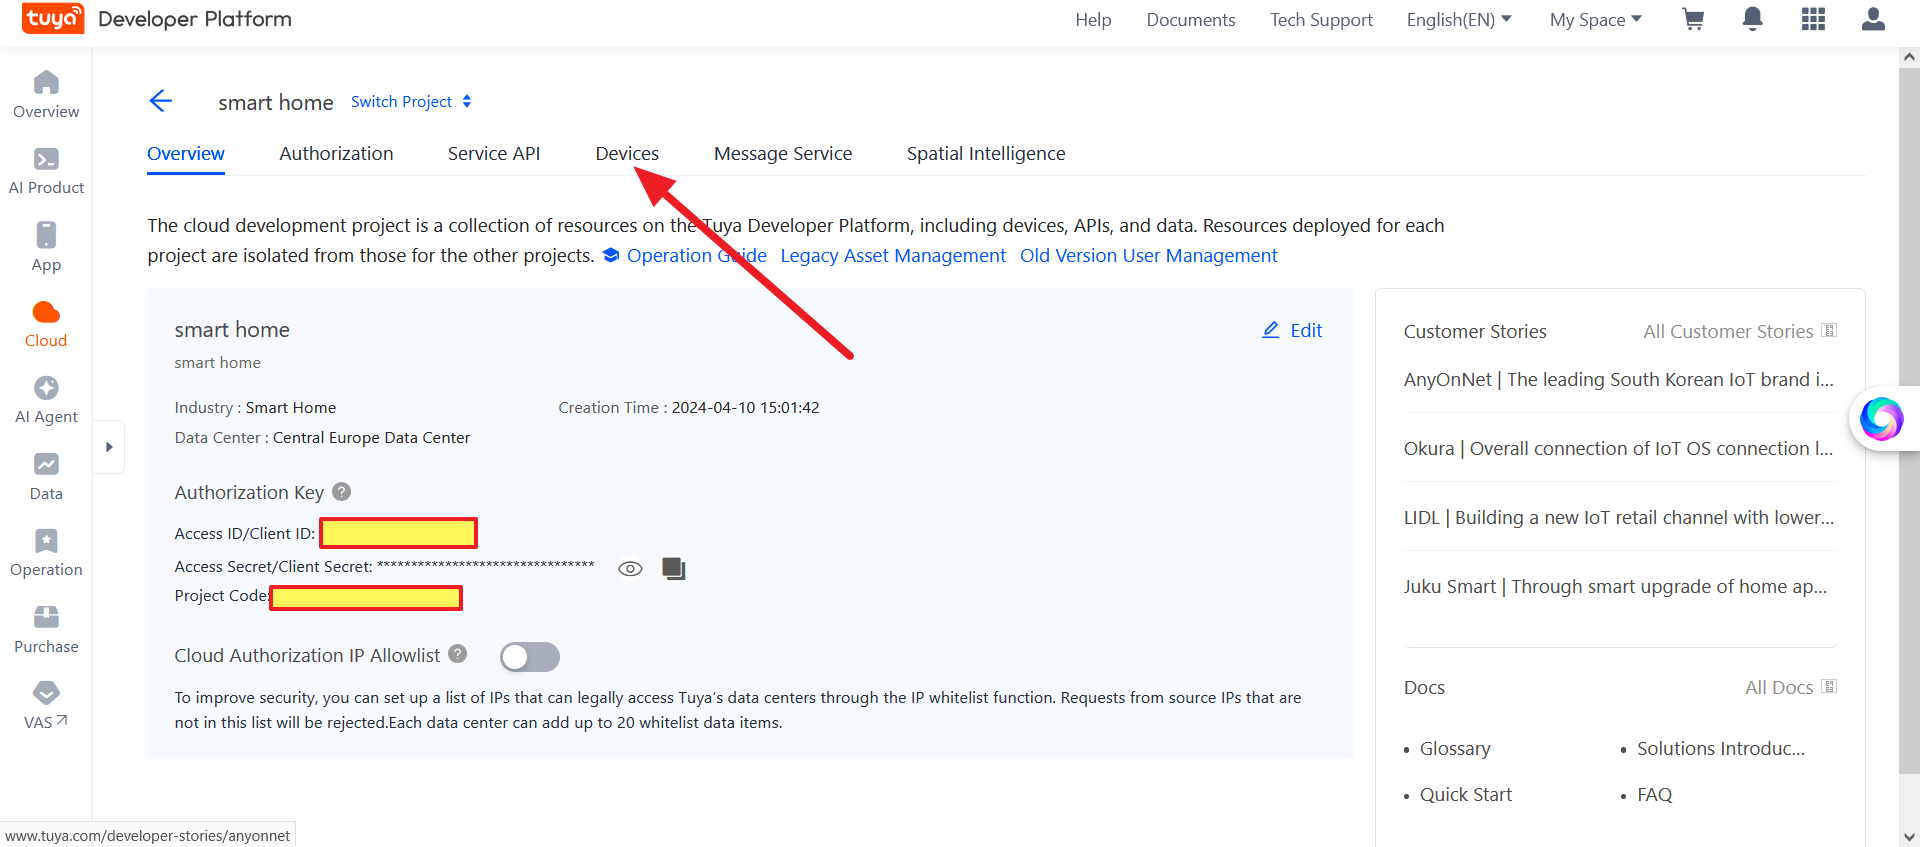
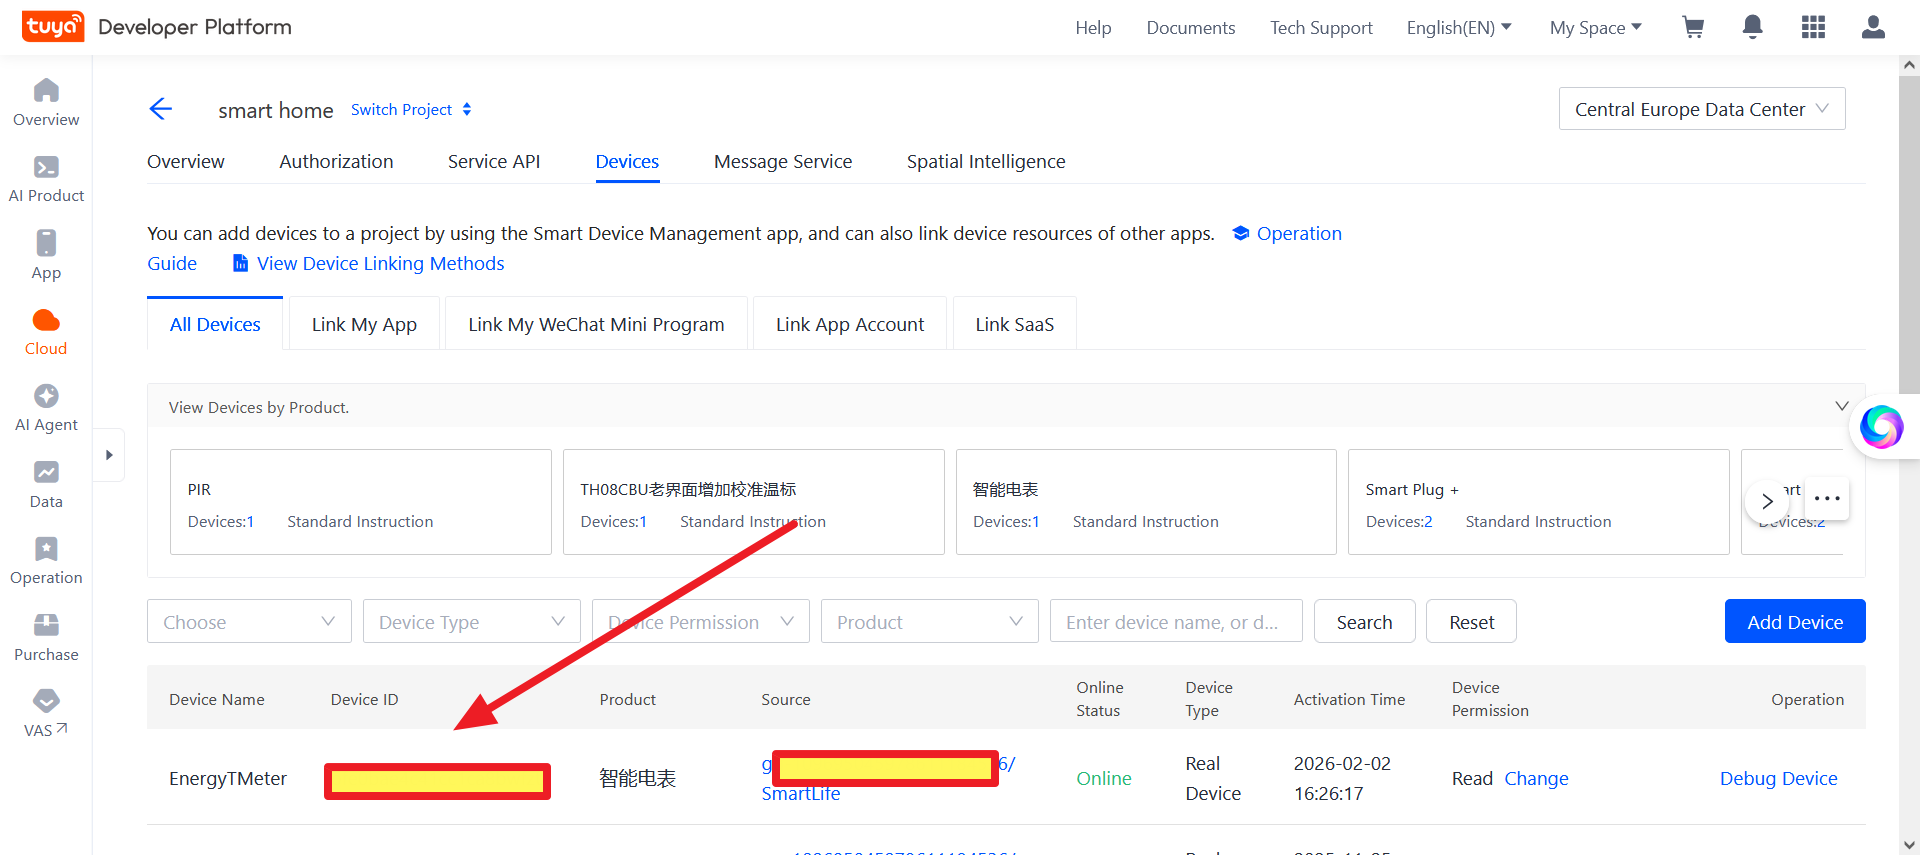
I’ve created a guide with all the steps to fully retrieve all the information needed to integrate TUYA WIFI devices into Home Assistant via LocalTuya.
Follow all the steps carefully, and after registering and logging in with your Tuya Account, you’ll have all the information at your fingertips from the website https://developer.tuya.com/en/.
Good luck!


Thank you a lot, sir.
Hi Guys, I just finished a 3 day rush to setup the wifi dual meter PJ-1103C. After a lot of tests the problem was the driver (3.5) not available on Local Tuya. I installed the Tuya Local (yes,they are not the same) that I manually added to hacs ( https://github.com/make-all/tuya-local) and the sensor worked like a charm. Even the metrics came automatically including their friendly names.
I hope it helps
I was supported by Gemini AI, (I tried GPT but it’s insane)
1 Like
I had been reading through this forum, and been a bit afraid of starting the process… But today when added my sensor to Tuya Local, it also went straight in without any issues. Recommend to try out!