Using Home Assistant and NodeRed to control EV Charging

Good day,

I have been running a simple Home Assistant/ESPHome/NodeRed solution to control the charging of my hybrid car for some time now. Now, I have received a fully electric car and thought it is the right time to make some changes. My goal is to use as much PV electricity as possible and keep my EV always at a minimum charging level to allow for day-to-day use (up to 100 km a day).

I evaluated EVCC, which is a great out-of-the-box solution, but I find it complicated to set up for my environment. Additionally, I may want to integrate phase switching in the future (1p ↔ 3p) and possibly integrate another wallbox for a second car. Therefore, I decided to extend my initial setup.

My setup looks like this:

  • Energy Meter EWE with an IR reading head to get what is currently feed to the grid
  • Energy Meter Wallbox is an Orno WE-517 with Modbus Controller connected to an ESP32
  • Heidelberg Energy Controll Wallbox, with Modbus Controller connected to an ESP32

This is a list of software components used to build the solution:

  • Home Assistant
    • Mushroom
    • Bar-card
    • Numberbox-card
  • ESPHome
  • NodeRed
  • InfluxDB

Variables / Helpers:
The current charging control uses the following variables (helpers):

  • Min Charging Threshold (Untere Ladegrenze)
    This is a % value which specifies the minimum charging threshold. If the level drops below this limit and the car is connected, the car should load even if no PV overage is available.
  • Max Charging Threshold (Obere Ladegrenze)
    This is a % value which specifies the maximum charging threshold. Some vendors say, don’t load your EV on a day-to-day basis more than 80%.
  • Overage Limit (PV Überschuss Schwellwert)
    This is a value that will be dynamically adjusted. The range is between 0 and 4100. 4100 is the minimum charging rate (3 phases * 230v * 6A = 4140w). The calculation for this Limit is currently very simple. Example:
    • Min Charging Threshold is 40%
    • Current Charging Threshold is 45%
    • Subtract Min Charging Threshold from Current Charging Level (45 – 40 = 5)
    • For each 1% increase or decrease the Overage Limit by 100w
    • In this case the Overage Limit it 500w – so charging starts if feed in is above 500w
  • Min Loading Time Window
    When Overage is above Overage Limit, charging should run for at least this time window (currently 15 Minutes, no helper created).
  • Target time (Ladeziel)
    If this is set and the target time is in the future:
    • Calculate hours to target time (e.g. 4,4h)
    • Calculate required charging (Charging Level is 78% ~ 16,26kw required)
    • Minimum Charging Rate for my car is 4,1kw
    • Charging time required is 3,97h, therefore charging starts with 4,1kw 3,97h before target time.
  • Current Charge Rate (wb_max_current).
    The minimum charge rate (without phase switching) is 4.1 kW. If there is still surplus despite charging, the charge rate will be adjusted. A small amount (100 W) should be available for feed-in. This helper is used in ESPHome to set the max_current per modbus in my Heidelberg Energy Control.

Node-RED:
The flow in Node-RED starts with the initialization:

  • The first node polls the charging state every 10 seconds.
  • The next node blocks all other than 4 to 7.
  • The current feed and the current charge rate (in kw) will be loaded. As the current feed is negative if I feed power to the grid I multiply this value with -1 and as the Current Charge is in kw I multiply it by 1000.
  • Next node joins the two messages.
  • Both messages include the overage and will be summarized in the next node to one value.
  • Add Msg Part add message information so that it can be joined with another message. The Node “PV Overage Limit” loads the ‘calculated’ Overage Limit. Both messages will be joined.

The next group will check if PV Overage is available:

  • The current feed will be compared to the calculated overage. If the overage is above, the timestamp will be saved to the context (Set PV Overage Timestamp).
  • The next node will remove the overage limit and set the overage to msg.payload.
  • The next node will check if we are in the time window (Min Loading Time Window). If false, the msg.payload will be set to 0 otherwise the Overage will be forwarded.

This group will now check if loading is required/allowed or not:

  • “Add Msg Part” will add msg.parts information to the message.
  • The other 4 nodes will load:
    • Charging Level (BMW Akku)
    • Minimum Load (Min Charging Threshold)
    • Maximum Load (Max Charging Threshold)
    • Targettime (Min Loading Time Window)
  • “Check of Override” checks if the Targettime is in the future. If yes it will flow up (Calc. Charging Time), if not it will go down (Check PV Overage);
    • “Calc Charging Time” calculates the hours required for 100% charging. The output is the required charge rate (in w)
    • “Check if Load required“ is below 4100w . If yes, loading will not be allowed, otherwise the node will forward the charging rate.
      • “Check PV Overage” will check if enough overage is available (msg.payload[0] > 0) and proceeds to “Upper Akku Limit Check”. Otherwise it will proceed with “Lower Akku Limit Check”:
        • "Lower Akku Limit Check” will check the Batterie is below the configured limit and then either allows loading or not
        • “Upper Akku Limit Check” will check if the Batterie is above the configured limit and then either allows loading or not

This group now configures loading:


The group has three entries:

  • The “Calculate Charge Rate (PV)” node will set the Charge Rate based on the available Overage
  • The “Std. Rate – Non PV” node will set the Charge Rate to 4100w / 6A. This is mainly used if the Batterie is below the lower limit.
  • The “Calculate Charge Rate (Time)” calculates the charging rate for time based charging.

The “Get current Charge Rate” loads the actual charge rate and the next nodes will just compare if something changed or not. If the charge rate changes the “Set Chargerate” node will set the new charge rate.
This group will stop charging. Either because one of the Group “Ladekontrolle” decided that charging is not required, or the charging state switched to 2 or 3 (no car connected):

Here the same logic applies. If the charging rate did not change, don’t do anything.
The next group will dynamically adjust the Overage Limit based on the above-described logic:

The next group will do the logging of the charging:


The “Charging Start” will check if the Charging State switches from anything other to 7. The “Charging Stop” will check if the Charging State switched from 7 to anything other and will finally log the information to the InfluxDB. “Charging Start” will store the different counters (Energy Meter Wallbox, …) in the flow context. So don’t forget to store the context on disc and not in memory. Otherwise, you may lose information during redeployment.

The Frontend

The Frontend in Home Assistant is based on the wonderful mushroom cards:

The calender icon is used to set the target time. If the target time is not in the future, the icon is set to grey.

Here is the YAML:

type: custom:stack-in-card
cards:
  - type: custom:mushroom-title-card
    title: Ladesteuerung
    card_mod:
      style: |
        ha-card {
          border: none;
          padding-top: 8px !important;
        }
  - type: custom:layout-card
    layout_type: custom:grid-layout
    layout:
      grid-template-columns: 45% 55%
      margin: '-4px -4px -8px -4px;'
    cards:
      - type: custom:mushroom-entity-card
        entity: sensor.ix3_m_sport_restreichweite_elektrisch
        name: Reichweite
        icon: mdi:car-battery
        icon_type: icon
        tap_action:
          action: navigate
          navigation_path: energia
        card_mod:
          style: |
            ha-card {
              border: none;
              padding: 12px;
              {% if states('sensor.esp_heizungunten_wallbox_aktuelle_leistung') | float(0) > 0 %}
                --card-mod-icon-color: orange;
              {% endif %}
            }
      - type: custom:bar-card
        entity: sensor.ix3_m_sport_verbleibende_batterie_in_prozent
        severity:
          - from: '0'
            color: red
            to: '20'
          - from: '21'
            to: '49'
            color: orange
          - from: '50'
            to: '100'
        name: ' '
        height: 42px
        min: '0'
        max: '100'
        entity_row: true
        positions:
          icon: 'off'
          indicator: 'off'
        card_mod:
          style: |
            ha-card {
              border: none;
              padding: 12px;
              margin-left: 12px;
            }
            bar-card-value {
              margin: 12px;
              font-size: 12px;
              font-weight: bolder;
            }
            bar-card-backgroundbar {
              border-radius: 8px;
              opacity: 0.2;
              filter: brightness(1);
            }
            bar-card-currentbar {
              border-radius: 8px;
            }
  - square: false
    columns: 3
    type: grid
    cards:
      - type: custom:numberbox-card
        entity: input_number.untere_ladegrenze
        name: false
        icon: false
        min: 20
        max: 60
        step: 5
        card_mod:
          style: >
            .body{display:block!important}
            .body::after{text-align:center;font-size:15px;content:"Untere
            Ladegrenze";display:block!important;padding-bottom:10px}
      - type: custom:mushroom-entity-card
        entity: input_datetime.ladeziel
        fill_container: false
        primary_info: none
        secondary_info: none
        layout: vertical
        card_mod:
          style: |
            ha-card {
              border: none;
              padding: 0px;
              font-size: 15px;
              font-weight: normal;
            }
            mushroom-shape-icon {           
              {% if as_timestamp(states('input_datetime.ladeziel')) < as_timestamp(now()) %}
                --shape-color: grey !important;
                --icon-color: white !important;
              {% endif %}
            }
      - type: custom:numberbox-card
        entity: input_number.obere_ladegrenze
        name: false
        icon: false
        min: 20
        max: 60
        step: 5
        card_mod:
          style: >
            .body{display:block!important}
            .body::after{text-align:center;font-size:15px;content:"Obere
            Ladegrenze";display:block!important;padding-bottom:10px}

Unfortunately, the JSON export for the Node-RED flows is too large to paste here. But I hope my explanation helps to understand.

Hopefully someone can reuse the idea. If I change something I will update this thread.

cheers
Walzing

I used Grafana for some time now to display the charging statistics. While upgrading to influxdb2 I thought it would be nice to have the statistics in Home Assistant. So I looked at the different ways how to integrate the statistics and ended with the custom Apex Card. First I tried to fetch the data with the influxdb integration, but it seems it shows only a single value.
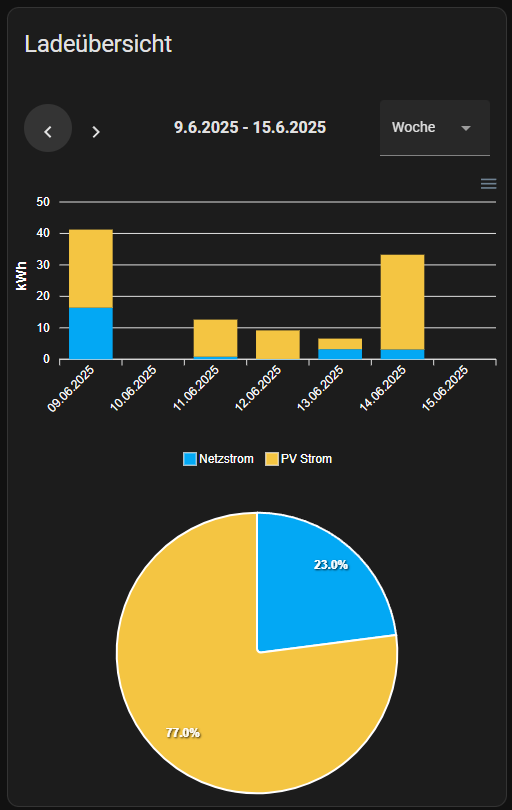
So I decided to give the data_generator a try and it worked perfectly – this is how it looks now:

And here is the code for the card:

type: custom:stack-in-card
cards:
  - type: custom:mushroom-title-card
    title: Ladeübersicht (30 Tage)
    card_mod:
      style: |
        ha-card {
          border: none;
          padding-top: 8px !important;
        }
  - type: custom:apexcharts-card
    stacked: true
    graph_span: 30d
    card_mod:
      style: |
        ha-card {
          border: none;
          padding-right: 20px;
        }
    apex_config:
      tooltip:
        enabled: true
        x:
          show: true
          format: dd.MM.yyyy
    series:
      - entity: sensor.influx_ladezyklen_7d_strom
        type: column
        name: Strom
        color: '#03a8f4'
        show:
          legend_value: false
        unit: kwh
        data_generator: |
          var myInit = { 
            method: 'POST',
              mode: 'cors',
              headers: {
                  'Authorization': 'Token ...',
                  'Accept': 'application/csv',
                  'Content-type': 'application/vnd.flux',
                  'Accept-Encoding': '*',
              },
              body: 'from(bucket: "Wallbox") ' +
              '|> range(start: -30d)' +
              '|> filter(fn: (r) => r["_measurement"] == "Ladezyklen")' +
              '|> filter(fn: (r) => r["_field"] == "Ladung (kWh)" or r["_field"] == "PV Strom (kWh)")' +
              '|> pivot(rowKey: ["_time"], columnKey: ["_field"], valueColumn: "_value")  ' +
              '|> map(fn: (r) => ({ r with "Strom (kWh)": r["Ladung (kWh)"] - r["PV Strom (kWh)"] }))' +
              '|> keep(columns: ["_time", "Ladung (kWh)", "Strom (kWh)", "PV Strom (kWh)"])' +
              '|> truncateTimeColumn(unit: 1d)' +
              '|> group(columns: ["_time", "_measurement"])' +
              '|> reduce(' +
              '  fn: (r, accumulator) => ({' +
              '    Strom: r["Strom (kWh)"] + accumulator.Strom,' +
              '  }),' +
              '  identity: {Strom: 0.0}' +
              '  )' +
              '|> group()'
          };

          const request = async () => {
              var result = [];
              const res = await fetch("http://192.168.178.2:8086/api/v2/query?orgID=4f290f78b2f9939a", myInit);
              if (res.status === 200) {
                  const data = await res.text();
                  var rows = data.split("\r\n");
                  for(var i=1; i<rows.length; i++){
                      var row = rows[i].split(',');
                      var _time = new Date(row[3]);
                      var _value = parseFloat(parseFloat(row[4]).toFixed(2));
                      if(row.length == 5) {
                          result.push([_time, _value]);
                      }
                  }
              } else {
                  console.log(`Error code ${res.status}`);
              }
              return result; 
          };
          return request();
      - entity: sensor.influx_ladezyklen_7d_strom_pv
        type: column
        name: PV Strom
        color: orange
        show:
          legend_value: false
        unit: kwh
        data_generator: |
          var myInit = { 
            method: 'POST',
            mode: 'cors',
            headers: {
                'Authorization': 'Token ...',
                'Accept': 'application/csv',
                'Content-type': 'application/vnd.flux',
                'Accept-Encoding': '*',
            },
            body: 'from(bucket: "Wallbox") ' +
            '|> range(start: -30d)' +
            '|> filter(fn: (r) => r["_measurement"] == "Ladezyklen")' +
            '|> filter(fn: (r) => r["_field"] == "Ladung (kWh)" or r["_field"] == "PV Strom (kWh)")' +
            '|> pivot(rowKey: ["_time"], columnKey: ["_field"], valueColumn: "_value")  ' +
            '|> keep(columns: ["_time", "PV Strom (kWh)"])' +
            '|> truncateTimeColumn(unit: 1d)' +
            '|> group(columns: ["_time", "_measurement"])' +
            '|> reduce(' +
            '  fn: (r, accumulator) => ({' +
            '    PVStrom: r["PV Strom (kWh)"] + accumulator.PVStrom,' +
            '  }),' +
            '  identity: {PVStrom: 0.0}' +
            '  )' +
            '|> group()'
          };
            
          const request = async () => {
              var result = [];
              const res = await fetch("http://192.168.178.2:8086/api/v2/query?orgID=4f290f78b2f9939a", myInit);
              if (res.status === 200) {
                  const data = await res.text();
                  var rows = data.split("\r\n");
                  for(var i=1; i<rows.length; i++){
                      var row = rows[i].split(',');
                      var _time = new Date(row[3]);
                      var _value = parseFloat(parseFloat(row[4]).toFixed(2));
                      if(row.length == 5) {
                          result.push([_time, _value]);
                      }
                  }
              } else {
                  console.log(`Error code ${res.status}`);
              }
              return result; 
          };
          return request();
    update_interval: 5m
  - type: custom:apexcharts-card
    update_interval: 5m
    chart_type: donut
    card_mod:
      style: |
        ha-card {
          border: none;
          padding-right: 20px;
          padding-bottom: 20px;
        }
    graph_span: 30d
    span:
      end: day
    apex_config:
      legend:
        show: false
      dataLabels:
        formatter: |
          EVAL:function(value) {
            return value.toFixed(0) + "%";
          }
      plotOptions:
        pie:
          donut:
            labels:
              show: true
              total:
                show: true
                showAlways: true
                formatter: |
                  EVAL:function(w) {
                    return w.globals.seriesTotals.reduce((a, b) => {return (a + b)},0).toFixed(1) + " kWh";
                  }
    series:
      - entity: sensor.influx_ladezyklen_7d_strom
        name: Strom
        color: '#03a8f4'
        group_by:
          func: sum
          duration: 30d
        show:
          legend_value: false
        unit: kwh
        data_generator: |
          var myInit = { 
            method: 'POST',
              mode: 'cors',
              headers: {
                  'Authorization': 'Token ...',
                  'Accept': 'application/csv',
                  'Content-type': 'application/vnd.flux',
                  'Accept-Encoding': '*',
              },
              body: 'from(bucket: "Wallbox") ' +
              '|> range(start: -30d)' +
              '|> filter(fn: (r) => r["_measurement"] == "Ladezyklen")' +
              '|> filter(fn: (r) => r["_field"] == "Ladung (kWh)" or r["_field"] == "PV Strom (kWh)")' +
              '|> pivot(rowKey: ["_time"], columnKey: ["_field"], valueColumn: "_value")  ' +
              '|> map(fn: (r) => ({ r with "Strom (kWh)": r["Ladung (kWh)"] - r["PV Strom (kWh)"] }))' +
              '|> keep(columns: ["_time", "Ladung (kWh)", "Strom (kWh)", "PV Strom (kWh)"])' +
              '|> truncateTimeColumn(unit: 1d)' +
              '|> group(columns: ["_time", "_measurement"])' +
              '|> reduce(' +
              '  fn: (r, accumulator) => ({' +
              '    Strom: r["Strom (kWh)"] + accumulator.Strom,' +
              '  }),' +
              '  identity: {Strom: 0.0}' +
              '  )' +
              '|> group()'
          };

          const request = async () => {
              var result = [];
              const res = await fetch("http://192.168.178.2:8086/api/v2/query?orgID=4f290f78b2f9939a", myInit);
              if (res.status === 200) {
                  const data = await res.text();
                  var rows = data.split("\r\n");
                  for(var i=1; i<rows.length; i++){
                      var row = rows[i].split(',');
                      var _time = new Date(row[3]);
                      var _value = parseFloat(parseFloat(row[4]).toFixed(2));
                      if(row.length == 5) {
                          result.push([_time, _value]);
                      }
                  }
              } else {
                  console.log(`Error code ${res.status}`);
              }
              return result; 
          };
          return request();
      - entity: sensor.influx_ladezyklen_7d_strom_pv
        name: PVStrom
        color: orange
        group_by:
          func: sum
          duration: 30d
        show:
          legend_value: false
        unit: kwh
        data_generator: |
          var myInit = { 
            method: 'POST',
            mode: 'cors',
            headers: {
                'Authorization': 'Token ...',
                'Accept': 'application/csv',
                'Content-type': 'application/vnd.flux',
                'Accept-Encoding': '*',
            },
            body: 'from(bucket: "Wallbox") ' +
            '|> range(start: -30d)' +
            '|> filter(fn: (r) => r["_measurement"] == "Ladezyklen")' +
            '|> filter(fn: (r) => r["_field"] == "Ladung (kWh)" or r["_field"] == "PV Strom (kWh)")' +
            '|> pivot(rowKey: ["_time"], columnKey: ["_field"], valueColumn: "_value")  ' +
            '|> keep(columns: ["_time", "PV Strom (kWh)"])' +
            '|> truncateTimeColumn(unit: 1d)' +
            '|> group(columns: ["_time", "_measurement"])' +
            '|> reduce(' +
            '  fn: (r, accumulator) => ({' +
            '    PVStrom: r["PV Strom (kWh)"] + accumulator.PVStrom,' +
            '  }),' +
            '  identity: {PVStrom: 0.0}' +
            '  )' +
            '|> group()'
          };
            
          const request = async () => {
              var result = [];
              const res = await fetch("http://192.168.178.2:8086/api/v2/query?orgID=4f290f78b2f9939a", myInit);
              if (res.status === 200) {
                  const data = await res.text();
                  var rows = data.split("\r\n");
                  for(var i=1; i<rows.length; i++){
                      var row = rows[i].split(',');
                      var _time = new Date(row[3]);
                      var _value = parseFloat(parseFloat(row[4]).toFixed(2));
                      if(row.length == 5) {
                          result.push([_time, _value]);
                      }
                  }
              } else {
                  console.log(`Error code ${res.status}`);
              }
              return result; 
          };
          return request();


For now the time range is fixed to 30 days. But I will implement a selectable time range next week.