I have a sensor connected with MQTT. Sometimes the values are displayed in two graphs like shown below:

Only sensors with exactly the same measurement unit will be displayed on the same graph.
So if you have one sensor with °C units and another with 'C or C units they will be displayed on separate graphs.
It’s just a single sensor sending a single MQTT message which is just an integer number.
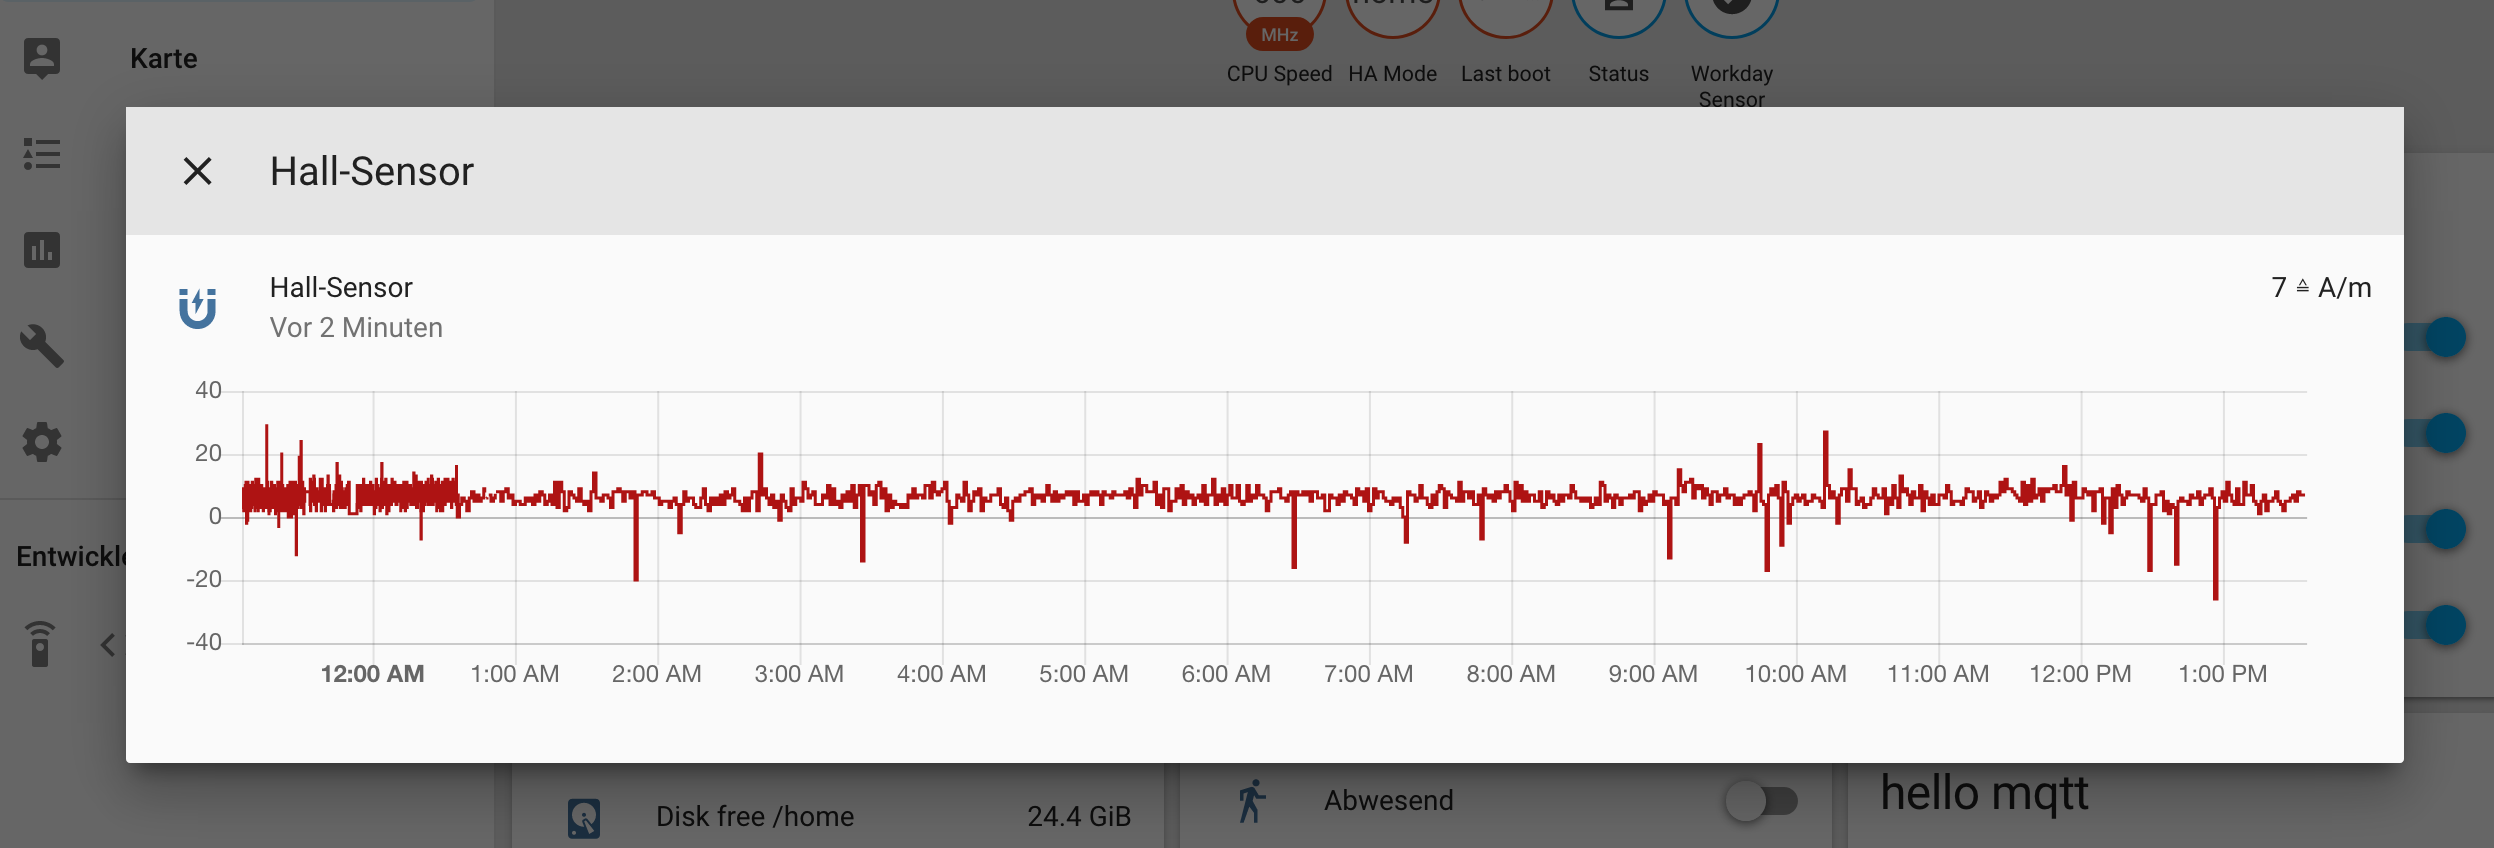
Look at the top of the first graph. it has units (≜ A/m).
Looks like sometimes it is reporting units and other times not?
Yes, but the units comes from the sensor definition and not from the message itself.
(I thought there have to be a unit_of_measurement defined to get a graph?)
sensors.yaml:
# mqtt-Spielkram
  - platform: mqtt
    name: "Hall-Sensor"
    state_topic: "home-assistant/ESP32/hall"
    value_template: "{{ (value | int) }} "
    icon: mdi:magnet-on
    unit_of_measurement: " ≙ A/m"
graph: lineFor some reason the database has some values of the sensor with different units. Did you update the sensor unit definition today perhaps?
You thought right.
No. Last change yesterday…
Well that’s just weird and I can’t explain it. Database corruption? Any relevant errors in the log?
Unfortunately I’m new and not familiar how to check database or logs, yet. ![]()
When I hoover over the graph, I see just a number, on both graphs:


Well that blows my other theory out of the water. I was thinking the bottom graph could be from yesterday morning.
Click the info button in the developer tools menu (lower left menu, looks like an ‘i’ in a circle. A summary of the log is there.
What happens when you hover the mouse over the actual line of the bottom graph (you might have to try both the top and bottom of a step/corner in value). Clicking on the title of the graph will expand it to make this easier.
10:11 is a minute before the last entry in the upper graph. Last value reported there is 10:12 o’clock.
Disconnected: Did not receive auth message within 10 seconds
10:11 components/websocket_api/http.py (WARNING)
Got unexpected response: None
01:51 components/updater.py (ERROR)
cpuspeed: Error on device update!
00:51 components/sensor/cpuspeed.py (ERROR)
You are using a custom component for hello_mqtt which has not been tested by Home Assistant. This component might cause stability problems, be sure to disable it if you do experience issues with Home Assistant.
00:51 loader.py (WARNING)
Not sure what you ask me to do. I have hovered over the graphs to get the small screenshots…
Click on the graph heading to expand the graph.
Hover directly over one of the corners of the line where it steps in value on the lower plot. Either at the top or bottom of the step in value you should get a time and date for just that sensor, not both as in your previous screenshot.
Like this:

Looks like you are going with lovelace? When I open that, the curves do not appear and the switches for the group itself are visible. But that’s one of the next things I have to look at:

But regarding the two graphs: The second one has gone 
And all I have changed is to have opened lovelace UI - with no graph. Last HA restart was late evening:
![]()
Yay! Problem solved AIBM 
Also I meant click on the sensor text in the group (rather than the group heading, as you have done in the first screenshot) you will then get a graph pop up. Then click on the graph pop up heading to expand it. As you have done in your second screenshot.
And no, I’m not using Lovelace, yet.
Unfortunately not ![]() Problem is back…
Problem is back…
And I’m not at home changing something…

No new entry in the log summary

