WTH: Why can't we see what's bloating the Recorder database?

I came across an archived WTH post raising a similar issue that apparently didn’t go anywhere, but I think this is important enough to bring up again.

Home Assistant offers very little visibility into what’s being stored in the Recorder database, what’s consuming the most space, and how much data is being written at any given time.

While developing and testing my own ESPHome devices, I’ve occasionally managed to cripple HA by unintentionally flooding the database with excessive updates. It’s also easy to forget to reduce sensor update frequencies after testing, or have malfunctioning devices, noisy sensors, or integrations generating unnecessary records.

I’d love to see a built-in diagnostic tool showing:

  • Database usage: What’s consuming the most space, broken down by entities, devices, or integrations.

  • Write activity: Which entities are generating the most records, including real-time write rates.

  • Historical trends: Database growth and activity over time to help identify problems.

I know SQL tools can accomplish much of this, and I’ve used them in the past. However, I’m no SQL expert, and it would be great to have some basic visibility into what’s bloating the database without having to manually query it.

We can monitor CPU, memory, disk, and network usage. Why not Recorder activity too? WTH :grin:

On another thread this was recommended:

GUI Recorder

While it may not address 100% of what I discussed above, it is an AWESOME tool, with a nice UI to look into DB bloat but only if you are on the default SQLite db. I’ll leave the WTH as I think some of this functionality should be in HA, but for now this fill most of the gap.

There’s also this:

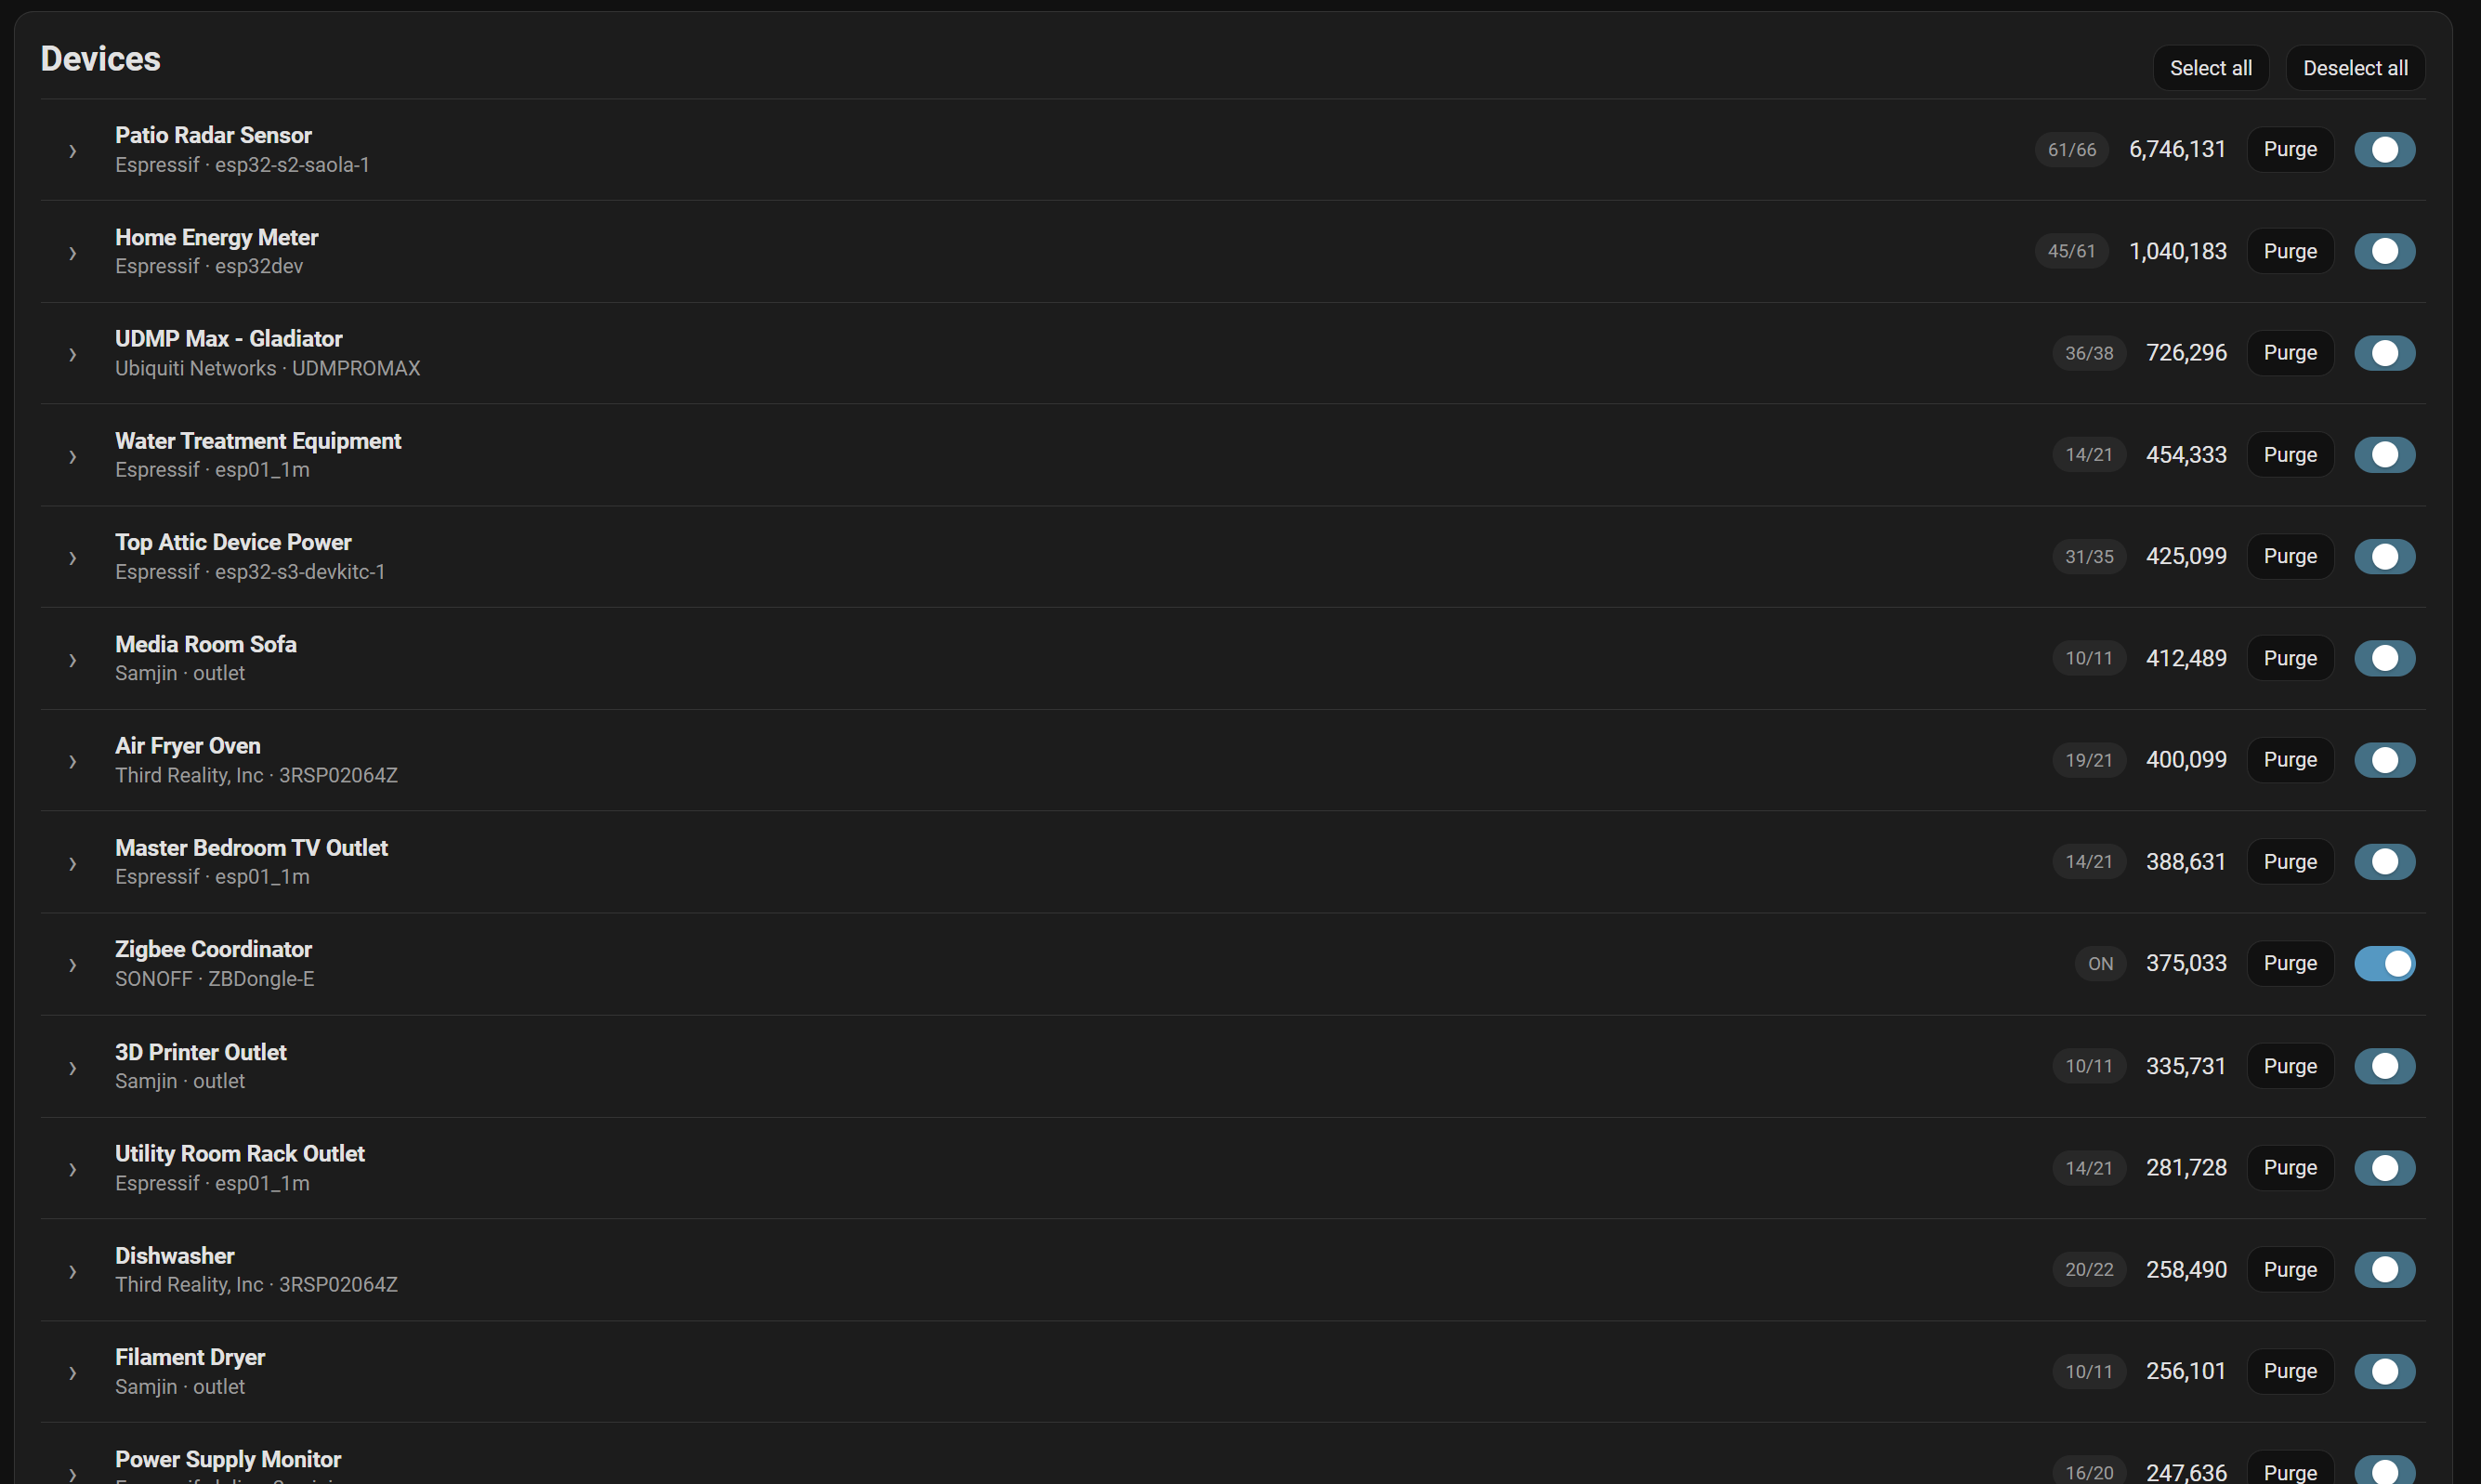
@Rusty Thanks, I’ll check it out. GUI-Recorder is looking pretty nice… below is a summary view (all entries can be expanded) that shows the largest contributors to the bloat:

The top one, is an ESPHome sensor I never finished working on so I am not surprised… but now I have proof and will quiet it down asap.

EDIT: It would be AWESOME if this were part of HA for completeness of the toolset and visibility at the very least.

Good call. You have my vote.

The rise of the LLM Marketplace integrations not improving this situation.

If you discover your DB is growing exponentially you’ll also probably see the word telemetry in the slop integration code and description.

I have now worked with several AI partnered developers to ask them to rein in the AI they use, and to revisit the code they have created, with a reconsideration of people’s CPU, IO, and disk space.

The level of, poor design of and non contextual spamming of telemetry makes some otherwise useful integrations unusable.

Implementing this WTH might open their eyes before going to market.

This is HA’s awesome community in a nutshell: just when I read the topic title and wanted to share my handcrafted and over the years collected SQL select statements for identifying the largest database entries, I scroll down the comments and discover posts of other users having the same or even much better solutions.

Of course such thing should be part of Core to get insights on why database sizes increase, so I need to automatically upvote this.

Could all of this be incorporated into Spook?

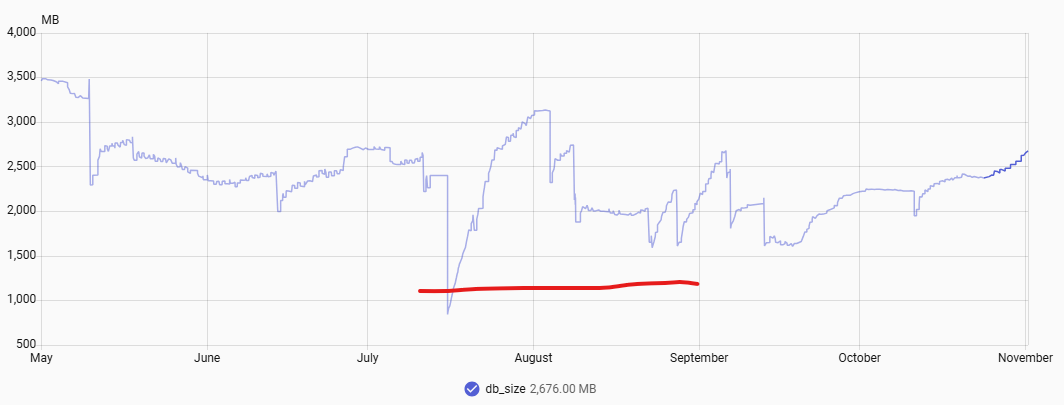
Where you see the red line I have drawn is where my database should really be. Then I try out something new :frowning: and the journey starts over…

I can usually manage to bring it down to 900-1000Mb with

  • Recorder Exclusion
  • Sensor Throttling
  • Template sensors that manage precision and remove attributes (wish we could exclude those)
  • Retention control using Labels
  • Correspondence with integration developers

With this WTH, I am not suggesting that I want the least amount of data possible. Quite the opposite, actually. I like having granular, abundant data that more accurately reflects real-world conditions.

For example, in the graph below, both lines represent the temperature in the same room. However, the blue line has a higher reporting frequency and is therefore able to capture the small temperature fluctuations caused by the HVAC system, while the orange line provides a smoother, more averaged representation. The only difference between the two is how frequently they report data points back to HA.

I prefer my measurements to reflect actual conditions as accurately as possible. Any averaging should be something I choose to apply where and when I need it. When I build my own ESP32-based sensors, I tend to send significantly more data points back to HA, and I’m perfectly fine with the resulting increase in database size.

However, there comes a point where performance starts to suffer. I’ve hit that point several times already, and each time I’ve had to go hunting, essentially blind, to figure out what was overwhelming my system.

GUI-Recorder is an excellent tool for identifying problems once they’ve become significant, and it allows me to address them by purging unnecessary historical data. However, this WTH is about gaining visibility into the current flow of data so that potential problems can be identified and addressed before they start affecting performance.

My UniFi camera system shows me the data flowing back to my NVR. My UniFi network provides visibility into the traffic generated by every device on the network.

What I’m asking for is something similar within HA: visibility into how much data is being written to the database, at what rate, and which devices, entities, or integrations are responsible for it.

The goal isn’t necessarily to reduce the amount of data being collected. It’s to understand it, identify abnormal or excessive activity, and make informed decisions about what, if anything, needs to be optimized.

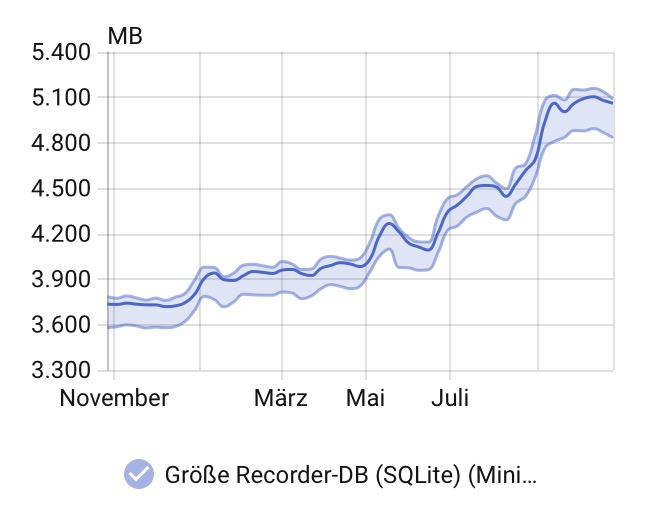
I don’t know if it’s caused by the recorder database but since a few months creating a HA backup takes almost an hour!

So, yeah, being able to inspect the recorder database, which is what I suspect to be the culprit, would be useful for sure.

Thanks Rusty for the link to gui-recorder, I’ll definitely install it.