J4yDubs
June 30, 2025, 11:18pm
1
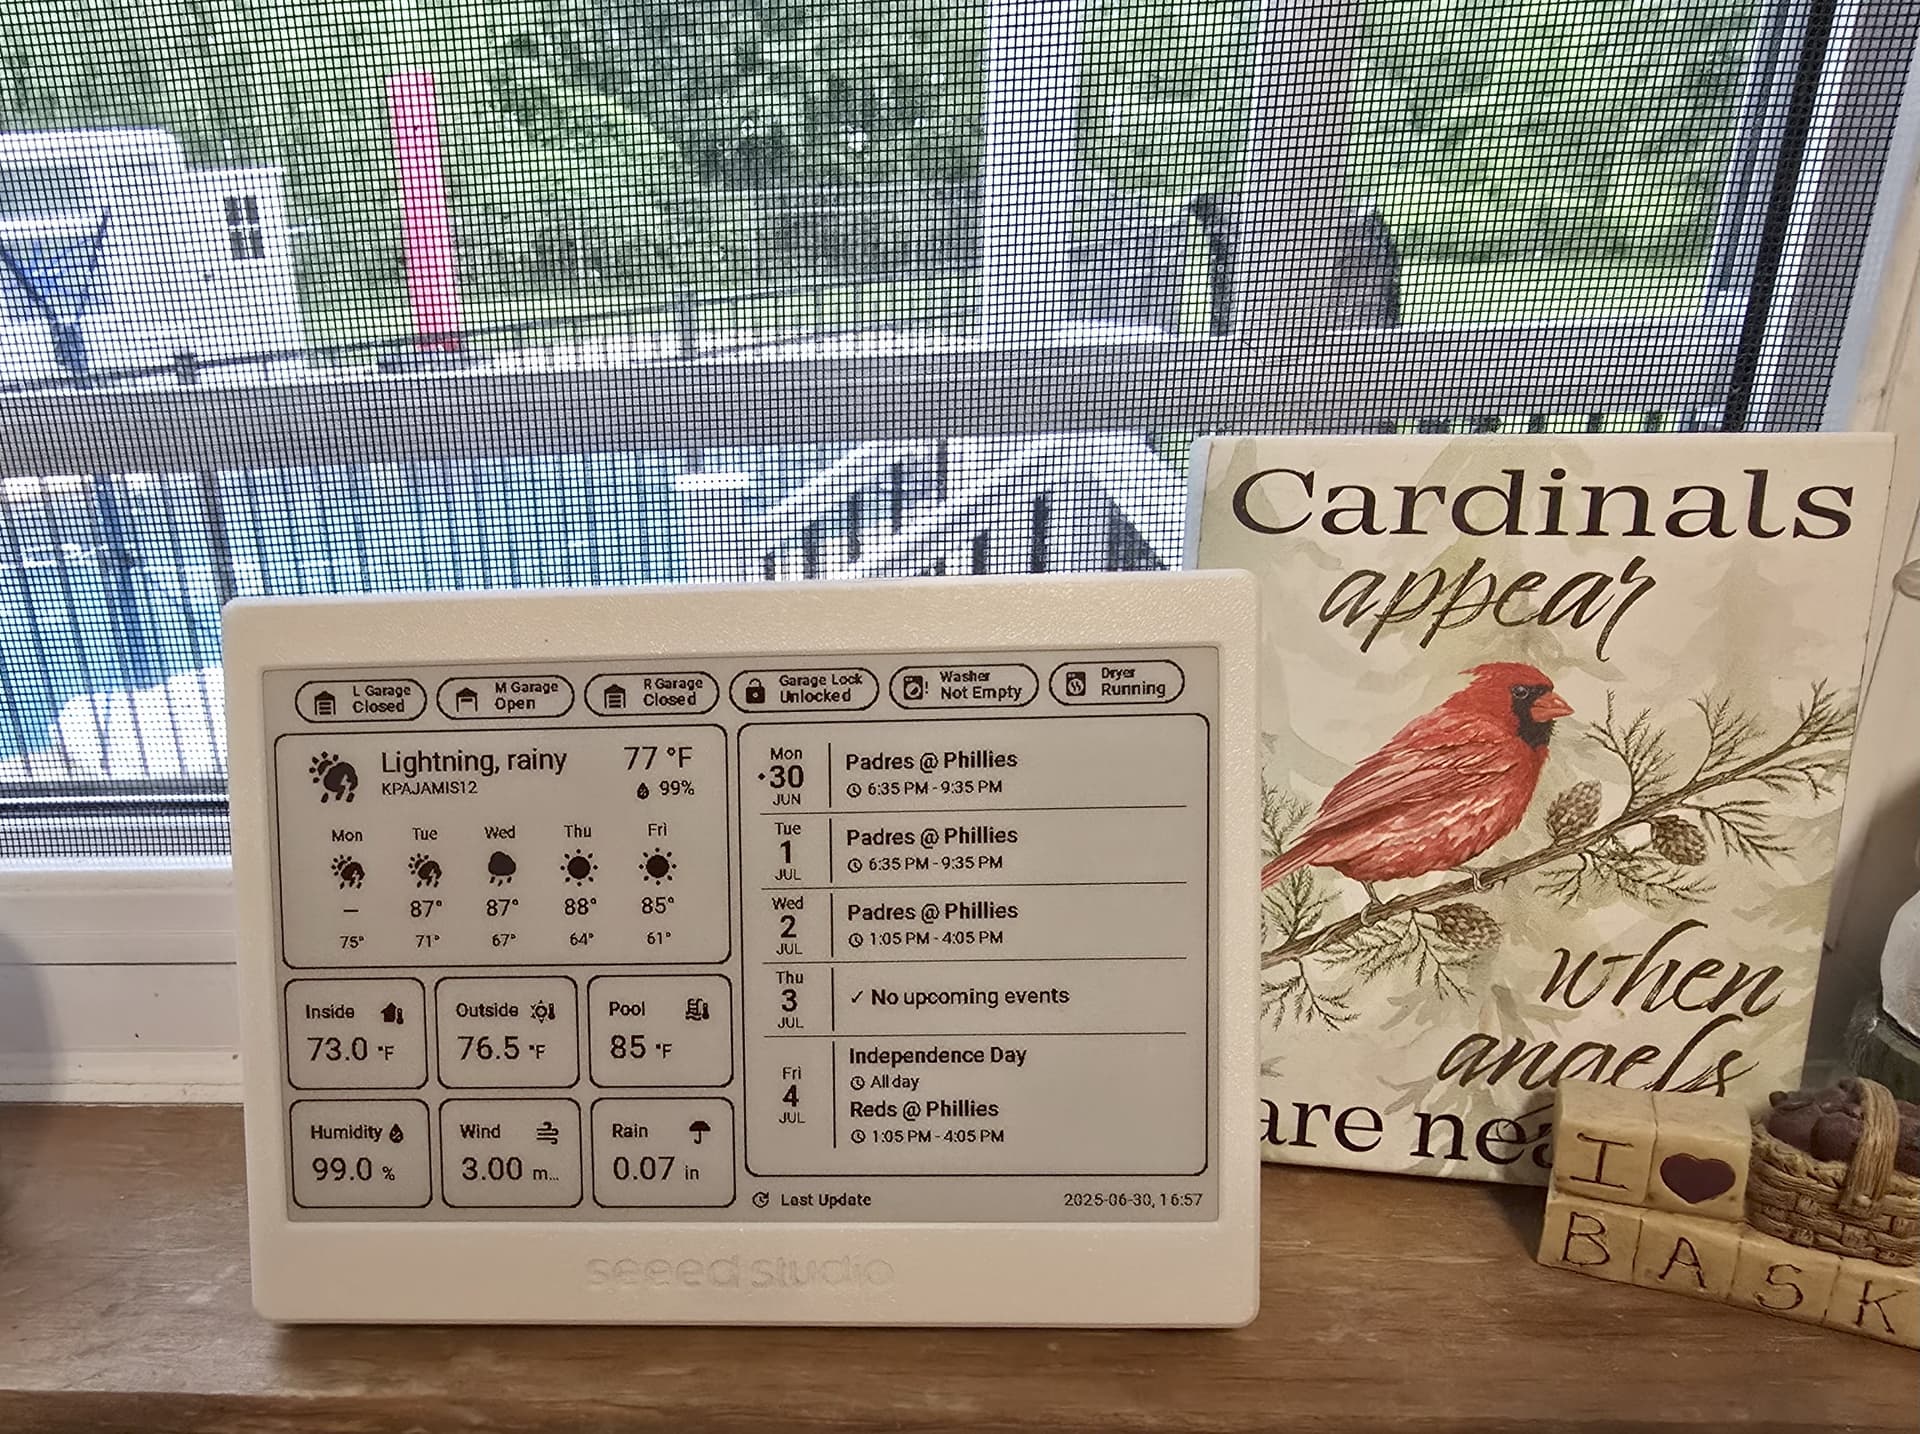
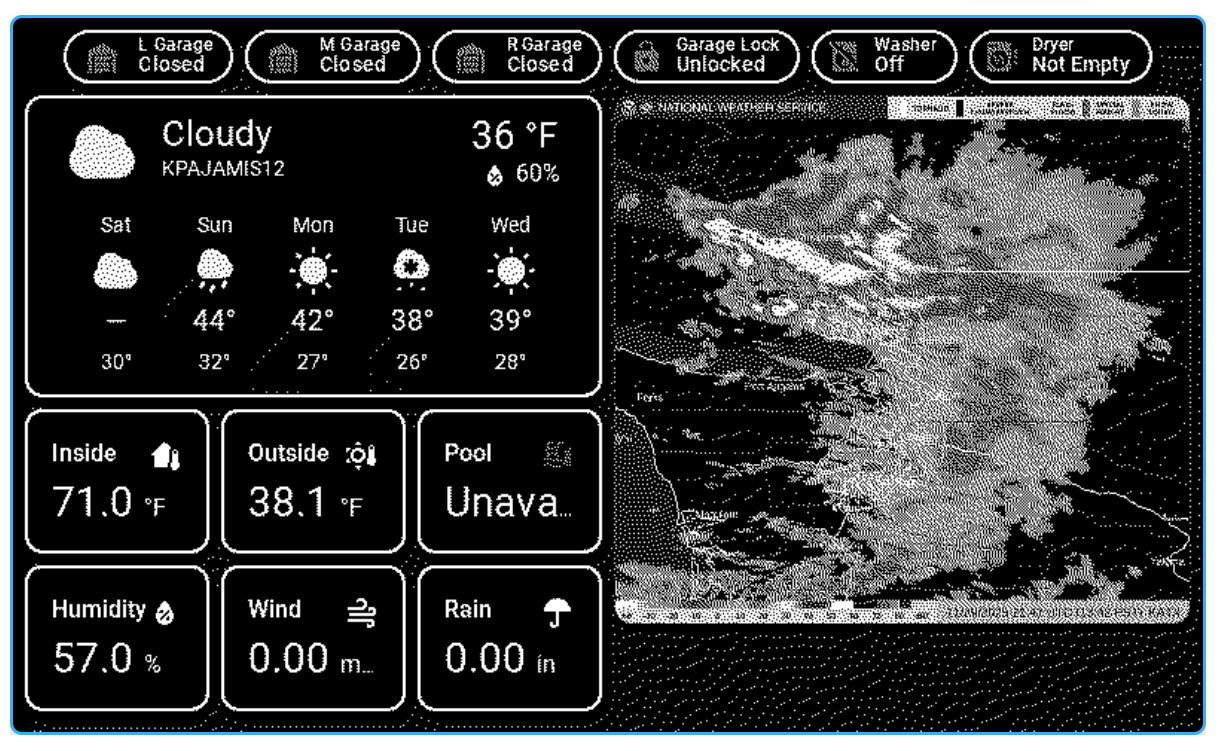
I got a XIAO 7.5" ePaper Panel (early build) while it was on a flash sale from Seeed Studio. This is something you can make yourself, but I took the lazy route.
After playing with it for a little bit, I’ve got a nice battery powered eink display that shows a bunch of Home Assistant entities. I think it looks good and it replaces several of those LCD displays that come with temp probes.
When I first got it I thought I was going to have to build what’s displayed using YAML in ESPHome Builder, but then I read about the Puppet add-on and decided to give that a try instead. Much easier! You just have to create a dashboard in Home Assistant and get it to look right on the 800x480 B&W display. That was the hardest part; getting it to display nicely in B&W. After a bunch of card_mod changes, I got it to look pretty good. I’m still tweaking it, but I’m happy with what I have now.
The big unknown is battery life. They say it’ll last 3 months if you refresh every 6 hours. I’m refreshing every 30 mins, so I’m curious to see how long it last. the one draw back to this product is that there’s currently no way to see the battery status. From some reading, I’m pretty sure I can mod it to so battery status is available, but I’ll hold off on that for now. Hopefully the release version has battery status (it sounds like a fairly easy change).
JGK
July 3, 2025, 7:47pm
2
That looks really cool! I just bought one of these to try out in our new home - any chance you’d be happy to share some of your YAML for the dashboard?
J4yDubs
July 3, 2025, 9:16pm
3
Sure, no problem. You’ll want to use Puppet or something that will snapshot the dashboard and create a image file to display on the ePaper.
Here’s the YAML for ESPHome:
esphome:
  name: kitchendisplay
  friendly_name: KitchenDisplay

esp32:
  board: esp32-c3-devkitm-1
  framework:
    type: arduino

# Enable logging
logger:

# Enable Home Assistant API
api:
  encryption:
    key: "YourKey"

ota:
  - platform: esphome
    password: "YourPassword"

globals:
  - id: wifi_status
    type: int
    restore_value: no
    initial_value: "0"
  - id: recorded_display_refresh
    type: int
    restore_value: yes
    initial_value: '0'

wifi:
  ssid: !secret wifi_ssid
  password: !secret wifi_password
  on_connect:
    then:
      - lambda: |-
          id(wifi_status) = 1;
  on_disconnect:
    then:
      - lambda: |-
          id(wifi_status) = 0;
  ap:
    ssid: "Kitchendisplay Fallback Hotspot"
    password: "YourPassword"


captive_portal:

# Here is deep sleep part
deep_sleep:
  id: deep_sleep_1
  run_duration: 1min  # Device wake up and run 60s (enough to pull data and update)
  sleep_duration: 30min  # deep sleep for 30m

http_request:
  verify_ssl: false
  timeout: 10s
  watchdog_timeout: 15s

online_image:
  - id: dashboard_image
    format: PNG
    type: BINARY
    buffer_size: 30000
    url: http://192.168.1.101:10000/dashboard-robin/display?viewport=800x480&eink=2&invert #change this link to your screenshot link
    update_interval: 20s
    on_download_finished:
      - delay: 0ms
      - component.update: main_display

spi:
  clk_pin: GPIO8
  mosi_pin: GPIO10

display:
  - platform: waveshare_epaper
    id: main_display
    cs_pin: GPIO3
    dc_pin: GPIO5
    busy_pin:
      number: GPIO4
      inverted: true
    reset_pin: GPIO2
    model: 7.50inv2
    update_interval: never
    lambda: |-
      it.image(0, 0, id(dashboard_image));

time:
  - platform: homeassistant
    id: homeassistant_time

sensor:
  - platform: wifi_signal # Reports the WiFi signal strength/RSSI in dB
    name: "WiFi Signal dB"
    id: wifi_signal_db
    update_interval: 120s
    entity_category: "diagnostic"

  - platform: copy # Reports the WiFi signal strength in %
    source_id: wifi_signal_db
    name: "WiFi Signal Percent"
    id: wifi_signal_percent
    filters:
      - lambda: return min(max(2 * (x + 100.0), 0.0), 100.0);
    unit_of_measurement: "Signal %"
    entity_category: "diagnostic"

  - platform: uptime
    name: Uptime

  - platform: internal_temperature
    name: "Internal Temperature"

  - platform: template
    name: "Display Last Update"
    device_class: timestamp
    entity_category: "diagnostic"
    id: display_last_update
    lambda: 'return id(homeassistant_time).now().timestamp;'

  - platform: template
    name: "Display Refresh Count"
    accuracy_decimals: 0
    unit_of_measurement: "Refreshes"
    state_class: "total_increasing"
    entity_category: "diagnostic"
    lambda: 'return id(recorded_display_refresh) += 1;'


# Battery read ADC
#  - platform: adc
#    pin: GPIO4
#    name: "A2 Voltage"
#    id: LIION
#    update_interval: never
#    attenuation: 2.5db
#    internal: true
#  - platform: template
#    name: "Battery Voltage"
#    id: bat_v
#    unit_of_measurement: 'V'
#    update_interval: never
#    accuracy_decimals: 2
#    icon: "mdi:battery"
#    lambda: |-
#      return (id(LIION).state * 4);
#  - platform: template
#    name: "Battery Percentage"
#    id: bat_percent
#    unit_of_measurement: '%'
#    update_interval: never
#    accuracy_decimals: 0
#    device_class: battery
#    lambda: |-
#      if(id(bat_v).state < 1)
#      {return 0;}
#      return ((id(bat_v).state-3) /1.2 * 100.00);
Here’s the YAML for the dashboard:
type: masonry
path: display
title: Display
cards:
- type: vertical-stack
cards:
- show_current: true
show_forecast: true
type: weather-forecast
entity: weather.kpajamis12
forecast_type: daily
secondary_info_attribute: humidity
card_mod:
style: |
:host {
--weather-icon-clear-night: url("/local/community/weather-card-pics/icons8-moon-and-stars-100.png");
--weather-icon-cloudy: url("/local/community/weather-card-pics/icons8-cloud-100.png");
--weather-icon-fog: url("/local/community/weather-card-pics/icons8-fog-100.png");
--weather-icon-lightning: url("/local/community/weather-card-pics/icons8-cloud-lightning-100.png");
--weather-icon-lightning-rainy: url("/local/community/weather-card-pics/icons8-stormy-weather-100.png");
--weather-icon-partlycloudy: url("/local/community/weather-card-pics/icons8-partly-cloudy-day-100.png");
--weather-icon-pouring: url("/local/community/weather-card-pics/icons8-torrential-rain-100.png");
--weather-icon-rainy: url("/local/community/weather-card-pics/icons8-rain-100.png");
--weather-icon-hail: url("/local/community/weather-card-pics/icons8-snow-storm-100.png");
--weather-icon-snowy: url("/local/community/weather-card-pics/icons8-snow-100.png");
--weather-icon-snowy-rainy: url("/local/community/weather-card-pics/icons8-snow-100.png");
--weather-icon-sunny: url("/local/community/weather-card-pics/icons8-sun-100.png");
--weather-icon-windy: url("/local/community/weather-card-pics/icons8-wind-100.png");
--weather-icon-windy-variant: url("/local/community/weather-card-pics/icons8-wind-100.png");
--weather-icon-exceptional: url("/local/community/weather-card-pics/icons8-rainbow-100.png");
}
ha-card {
border: 2px solid black;
padding: 10px !important;
}
.name-state .name {
color: black;
#font-size: 2px;
}
.name-state .state {
color: black;
#font-size: 7px;
}
.temp-attribute .temp {
color: black;
font-size: 26px !important;
}
.temp-attribute .temp span {
color: black;
#font-size: 7px !important;
}
.temp-attribute .attribute {
color: black;
font-size: 16px;
}
.forecast .temp {
color: black;
font-size: 20px;
}
.forecast .templow {
color: black;
font-size: 14px;
}
.forecast div {
color: black;
}
ha-card div.forecast div.temp {
font-size: 14pt;
}
- type: horizontal-stack
cards:
- graph: none
type: sensor
detail: 2
entity: sensor.home_thermostat_air_temperature
name: Inside
icon: mdi:home-thermometer
hours_to_show: 12
card_mod:
style: |
.header .icon {
color: black;
}
ha-card {
border: 2px solid black;
--secondary-text-color: black;
}
- graph: none
type: sensor
detail: 2
name: Outside
icon: mdi:sun-thermometer-outline
hours_to_show: 12
entity: sensor.acurite_5n1_a_3430_temperature
card_mod:
style: |
.header .icon {
color: black;
}
ha-card {
border: 2px solid black;
--secondary-text-color: black;
}
- graph: none
type: sensor
detail: 2
entity: sensor.aqualogic_pool_temperature
name: Pool
icon: mdi:pool-thermometer
hours_to_show: 12
card_mod:
style: |
.header .icon {
color: black;
}
ha-card {
border: 2px solid black;
--secondary-text-color: black;
}
- type: horizontal-stack
cards:
- graph: none
type: sensor
detail: 2
icon: ""
hours_to_show: 12
entity: sensor.acurite_5n1_a_3430_humidity
name: Humidity
card_mod:
style: |
.header .icon {
color: black;
}
ha-card {
border: 2px solid black;
--secondary-text-color: black;
}
- graph: none
type: sensor
detail: 2
entity: sensor.topwindspeedhr
name: Wind
icon: mdi:weather-windy
hours_to_show: 12
card_mod:
style: |
.header .icon {
color: black;
}
ha-card {
border: 2px solid black;
--secondary-text-color: black;
}
- graph: none
type: sensor
detail: 2
name: Rain
icon: ""
hours_to_show: 24
entity: sensor.kpajamis12_precipitation_today
card_mod:
style: |
.header .icon {
color: black;
}
ha-card {
border: 2px solid black;
--secondary-text-color: black;
}
- type: vertical-stack
cards:
- entities:
- entity: calendar.birthdays
show_time: true
- entity: calendar.philadelphia_phillies
show_time: true
- entity: calendar.carolina_panthers
show_time: true
- entity: calendar.holidays_in_united_states
show_time: true
split_multiday_events: false
- entity: calendar.north_carolina_tar_heels_men_s_basketball
show_time: true
- entity: calendar.philadelphia_eagles
show_time: true
- entity: calendar.email_gmail_com
show_time: true
days_to_show: 5
show_empty_days: true
filter_duplicates: true
title_color: ""
accent_color: Black
day_spacing: 4px
event_spacing: 2px
day_separator_width: 1px
day_separator_color: var(--primary-text-color)
today_indicator: dot
today_indicator_color: var(--primary-text-color)
event_font_size: 18px
time_font_size: 14px
time_color: var(--primary-text-color)
show_location: false
weather:
position: none
date:
show_conditions: true
show_high_temp: true
show_low_temp: false
icon_size: 14px
font_size: 12px
color: var(--primary-text-color)
event:
show_conditions: true
show_temp: true
icon_size: 14px
font_size: 12px
color: var(--primary-text-color)
entity: weather.kpajamis12
type: custom:calendar-card-pro
height: 350px
card_mod:
style: |
ha-card {
border: 2px solid black;
}
- type: heading
icon: mdi:update
heading: Last Update
heading_style: subtitle
badges:
- type: entity
show_state: true
show_icon: false
entity: sensor.date_time
color: black
card_mod:
style: |
ha-card .title p {
font-size: 14px;
padding: 0px !important;
}
badges:
- type: custom:mod-card
card:
type: custom:mushroom-template-badge
content: "{{states('cover.ratgdov25i_1bdf3a_door') | capitalize }}"
icon: |
{% if is_state('cover.ratgdov25i_1bdf3a_door', 'closed') %}
mdi:garage
{% else %}
mdi:garage-open
{% endif %}
color: grey
entity: cover.ratgdov25i_1bdf3a_door
label: L Garage
tap_action:
action: more-info
card_mod:
style:
mushroom-template-badge:
$: |
.badge {
--divider-color: black;
--ha-card-border-width: 2px;
--mdc-icon-size: 32px !important;
.info {
.label {
font-size: 12px;
--secondary-text-color: black;
}
.content {
font-size: 14px;
}
}
.: |
ha-card {
background: none;
border: none;
}
- type: custom:mod-card
card:
type: custom:mushroom-template-badge
content: "{{states('cover.ratgdov25i_1ba3c0_door') | capitalize }}"
icon: |
{% if is_state('cover.ratgdov25i_1ba3c0_door', 'closed') %}
mdi:garage
{% else %}
mdi:garage-open
{% endif %}
color: grey
entity: cover.ratgdov25i_1ba3c0_door
label: M Garage
tap_action:
action: more-info
card_mod:
style:
mushroom-template-badge:
$: |
.badge {
--divider-color: black;
--ha-card-border-width: 2px;
--mdc-icon-size: 32px !important;
.info {
.label {
font-size: 12px;
--secondary-text-color: black;
}
.content {
font-size: 14px;
}
}
.: |
ha-card {
background: none;
border: none;
}
- type: custom:mod-card
card:
type: custom:mushroom-template-badge
content: "{{states('cover.ratgdov25i_1ba3c8_door') | capitalize }}"
icon: |
{% if is_state('cover.ratgdov25i_1ba3c8_door', 'closed') %}
mdi:garage
{% else %}
mdi:garage-open
{% endif %}
color: grey
entity: cover.ratgdov25i_1ba3c8_door
label: R Garage
tap_action:
action: more-info
card_mod:
style:
mushroom-template-badge:
$: |
.badge {
--divider-color: black;
--ha-card-border-width: 2px;
--mdc-icon-size: 32px !important;
.info {
.label {
font-size: 12px;
--secondary-text-color: black;
}
.content {
font-size: 14px;
}
}
.: |
ha-card {
background: none;
border: none;
}
- type: custom:mod-card
card:
type: custom:mushroom-template-badge
content: "{{states('lock.side_door_lock') | capitalize }}"
icon: |
{% if is_state('lock.side_door_lock', 'locked') %}
mdi:lock
{% else %}
mdi:lock-open
{% endif %}
color: grey
entity: lock.side_door_lock
label: Garage Lock
tap_action:
action: more-info
card_mod:
style:
mushroom-template-badge:
$: |
.badge {
--divider-color: black;
--ha-card-border-width: 2px;
--mdc-icon-size: 24px !important;
.info {
.label {
font-size: 12px;
--secondary-text-color: black;
}
.content {
font-size: 14px;
}
}
.: |
ha-card {
background: none;
border: none;
}
- type: custom:mod-card
card:
type: custom:mushroom-template-badge
content: "{{states('input_select.washing_machine_status') }}"
icon: |
{% if is_state('input_select.washing_machine_status', 'Off') %}
mdi:washing-machine-off
{% elif is_state('input_select.washing_machine_status', 'Not Empty') %}
mdi:washing-machine-alert
{% else %}
mdi:washing-machine
{% endif %}
color: grey
entity: input_select.washing_machine_status
label: Washer
tap_action:
action: more-info
card_mod:
style:
mushroom-template-badge:
$: |
.badge {
--divider-color: black;
--ha-card-border-width: 2px;
--mdc-icon-size: 24px !important;
.info {
.label {
font-size: 12px;
--secondary-text-color: black;
}
.content {
font-size: 14px;
}
}
.: |
ha-card {
background: none;
border: none;
}
- type: custom:mod-card
card:
type: custom:mushroom-template-badge
content: "{{states('input_select.dryer_status') }}"
icon: |
{% if is_state('input_select.dryer_status', 'Off') %}
mdi:tumble-dryer-off
{% elif is_state('input_select.dryer_status', 'Not Empty') %}
mdi:tumble-dryer-alert
{% else %}
mdi:tumble-dryer
{% endif %}
color: grey
entity: input_select.dryer_status
label: Dryer
tap_action:
action: more-info
card_mod:
style:
mushroom-template-badge:
$: |
.badge {
--divider-color: black;
--ha-card-border-width: 2px;
--mdc-icon-size: 24px !important;
.info {
.label {
font-size: 12px;
--secondary-text-color: black;
}
.content {
font-size: 14px;
}
}
.: |
ha-card {
background: none;
border: none;
}
I also changed the icons in the weather card to black and white icons. The default ones work, but sometimes multiple colors blend. I got the icons from icons8.com
philjn
July 7, 2025, 11:47pm
4
+1 to @JGK . Your dashboard is great and packs in a lot of information and thank you for sharing your YAML. What weather forecast integration are you using?
J4yDubs
July 8, 2025, 12:36am
5
I’m using Wundergroundpws (Weather Underground) that gets data from a AcuRite Iris (5-in-1) that’s in my backyard (KPAJAMIS12). I’ll probably be replacing the AcuRite at some point. It’s worked well for a long time, but the wind speed has never been that actuate.
walter-ve
October 4, 2025, 9:22am
6
Any update on the battery life?
J4yDubs
October 16, 2025, 1:43pm
7
Battery life is around 1 month. This is with 30 minute refreshes that run for 1 min. Not bad, but not great.
I can’t get it to work, I get a heap allocation error. Even when I remove some components.
[14:11:52.908][I][online_image:109]: Updating image http://192.168.1.18:10000/dashboard-epaper/display?viewport=800x480&eink=2&invert&format=PNG
[14:11:53.092][D][http_request.arduino:134]: Received response header, name: etag, value:
[14:11:53.095][D][http_request.arduino:134]: Received response header, name: last-modified, value:
[14:11:53.095][D][http_request.arduino:140]: Content-Length: 290
[14:11:53.098][D][online_image:175]: Starting download
[14:11:53.109][D][online_image:194]: Allocating PNG decoder
[14:11:53.109][I][online_image:212]: Downloading image (Size: 290)
[14:11:53.109][D][online_image:089]: Allocating new buffer of 48000 bytes
[14:11:53.109][E][online_image:092]: allocation of 48000 bytes failed. Biggest block in heap: 26624 Bytes
[14:11:53.109][E][online_image.png:086]: Error decoding image: Incorrect PNG signature
[14:11:53.111][E][online_image:250]: Error when decoding image.
J4yDubs
November 16, 2025, 2:37pm
9
Try using a bmp file instead of png. Add “&format=bmp” to you URL.
Thanks tried this also but not working either since I got a heap allocation error. I believe the firmware and components are too big. But I removed everything non essential.
Got it working by switching to esp-idf and buffer_size: 10000
No idea why I had to adjust this. Maybe they switched chipsets with reduced sram?
J4yDubs
November 16, 2025, 8:22pm
12
Good to hear and thanks for updating the post with what worked,
@J4yDubs I really don’t like that HA has to run in http mode because of puppet.
eriol
November 21, 2025, 10:45pm
14
which puppet addon are you using? I have been spending the last two hours trying to make this work. If I use png, decoding takes too much memory, but if i use bmp, the image is >1 Mb, so too much memory too.
Thank you in advance
J4yDubs
November 22, 2025, 2:10am
15
This is the one I’m using.
schuss42
November 29, 2025, 7:08pm
16
Thank you @J4yDubs ! Having the YAML helped a lot.
I got this working on the reTerminal E1001 model with the following in the ESPHome builder:
captive_portal:
    # define font to display words

http_request:
  verify_ssl: false
  timeout: 10s
  watchdog_timeout: 15s

online_image:
  - id: dashboard_image
    format: PNG
    type: BINARY
    buffer_size: 30000
    url: http://192.168.2.222:10000/wall-display/display?viewport=800x480&colors=000000%2CFFFFFF%2C0000FF%2C00FF00%2CFF0000%2CFFFF00&palette_colors=191E21%2CE8E8E8%2C2157BA%2C125F20%2CB21318%2CEFDE44&dithering=sierra-lite&zoom=0.8&lang=en&invert=&next=300
    update_interval: 300s
    on_download_finished:
      - delay: 0ms
      - component.update: epaper_display

spi:
  clk_pin: GPIO7
  mosi_pin: GPIO9

display:
  - platform: waveshare_epaper
    id: epaper_display
    cs_pin: GPIO10
    dc_pin: GPIO11
    busy_pin:
      number: GPIO13
      inverted: true
    reset_pin:
      number: GPIO12
      inverted: false
    model: 7.50inv2
    update_interval: never
    lambda: |-
      it.image(0, 0, id(dashboard_image));

time:
  - platform: homeassistant
    id: homeassistant_time
I just can’t figure out how to keep it refreshed without the screen flickering so much. It goes black, flashes a couple times, displays the whole dash inverted, and then settles into a display like yours, just to refresh the screen. Is there any way to make that smoother? I’m trying to show some statuses with <5 min intervals so want it to refresh pretty often.
schuss42
November 29, 2025, 7:14pm
17
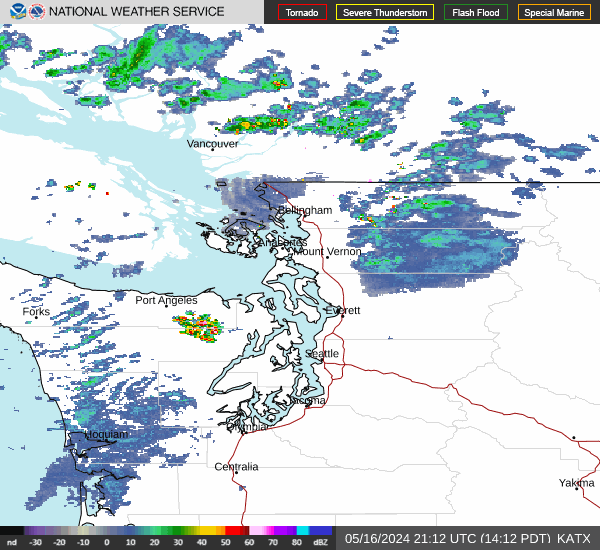
I’m also fighting to get a radar map included. I’ve got a static one that works great on my dashboard but seems to choke in puppet. I’m running puppet with a delay time of 8s and have tried less and more, but it only loads the image 1/20 times. When I do get the image to load, it renders surprisingly well and I wish it would work!
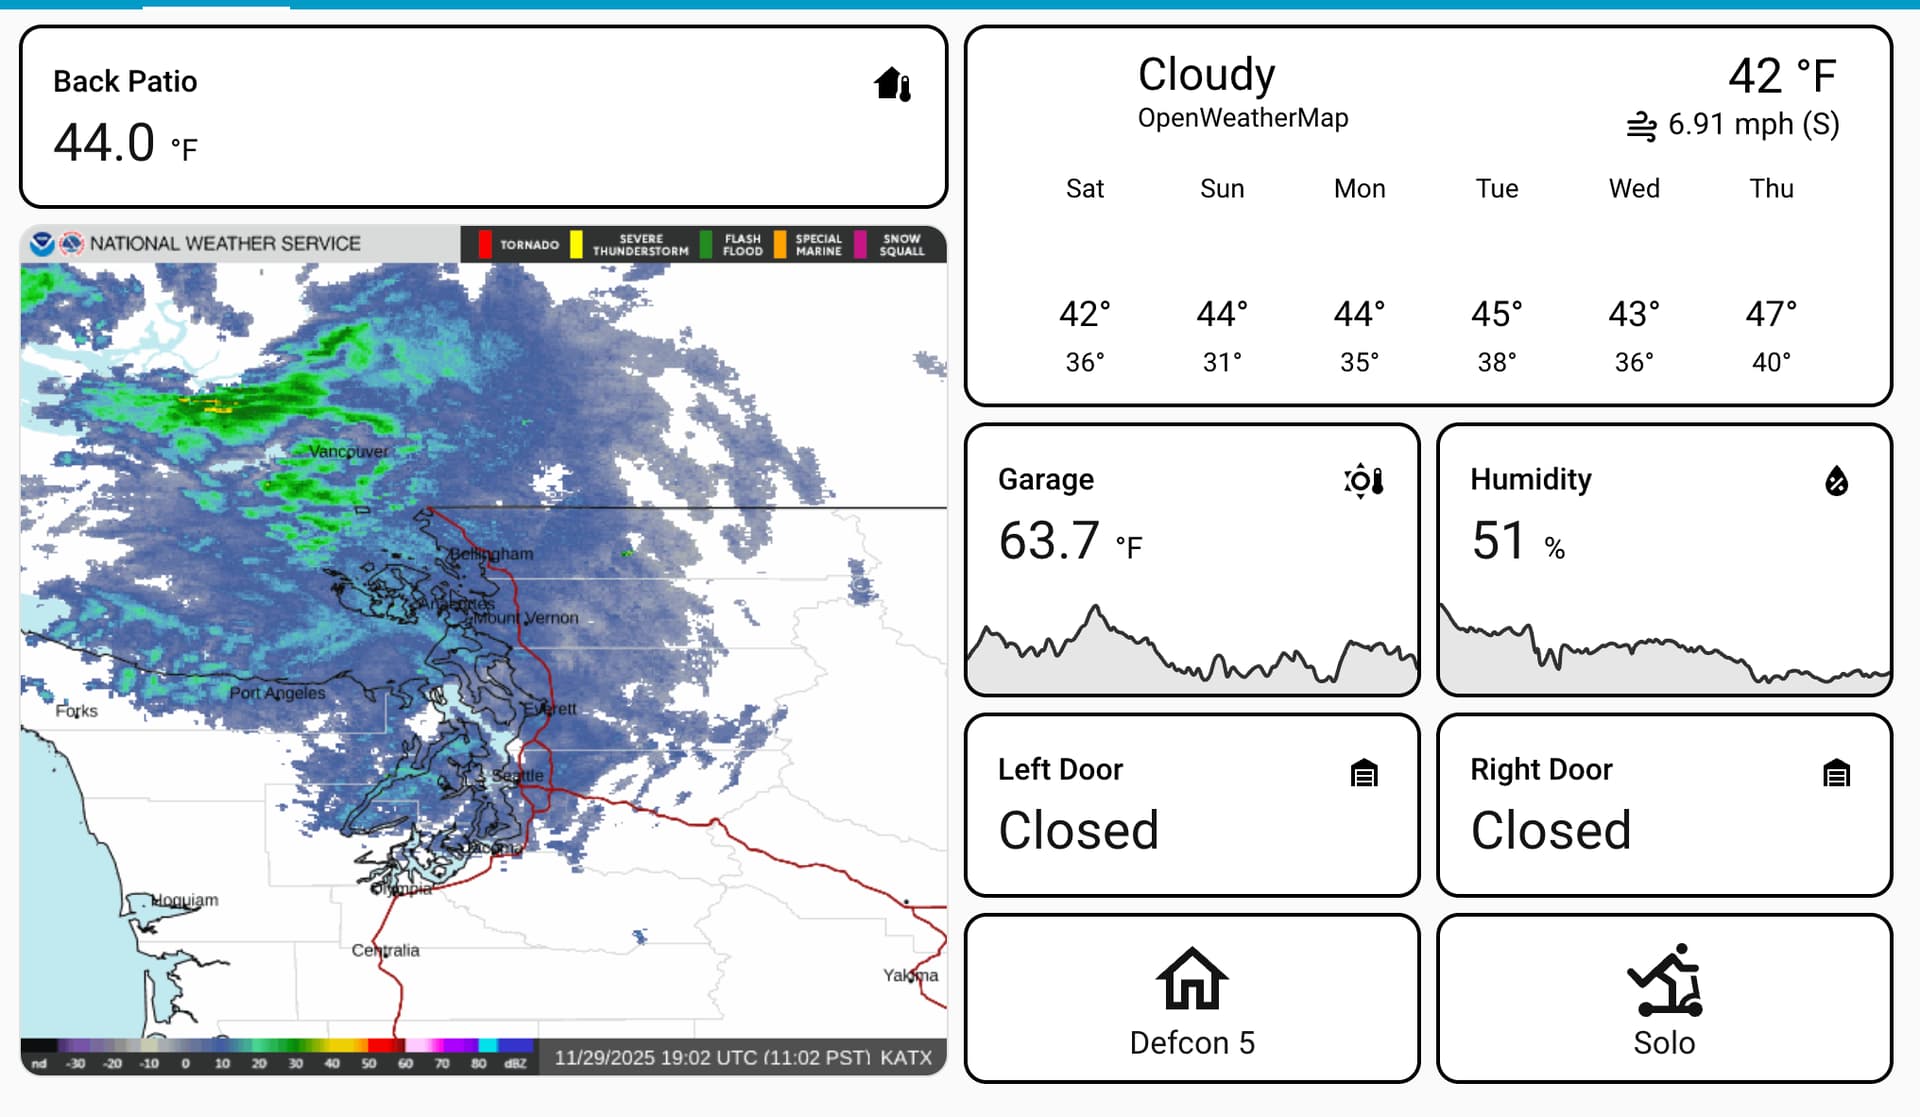
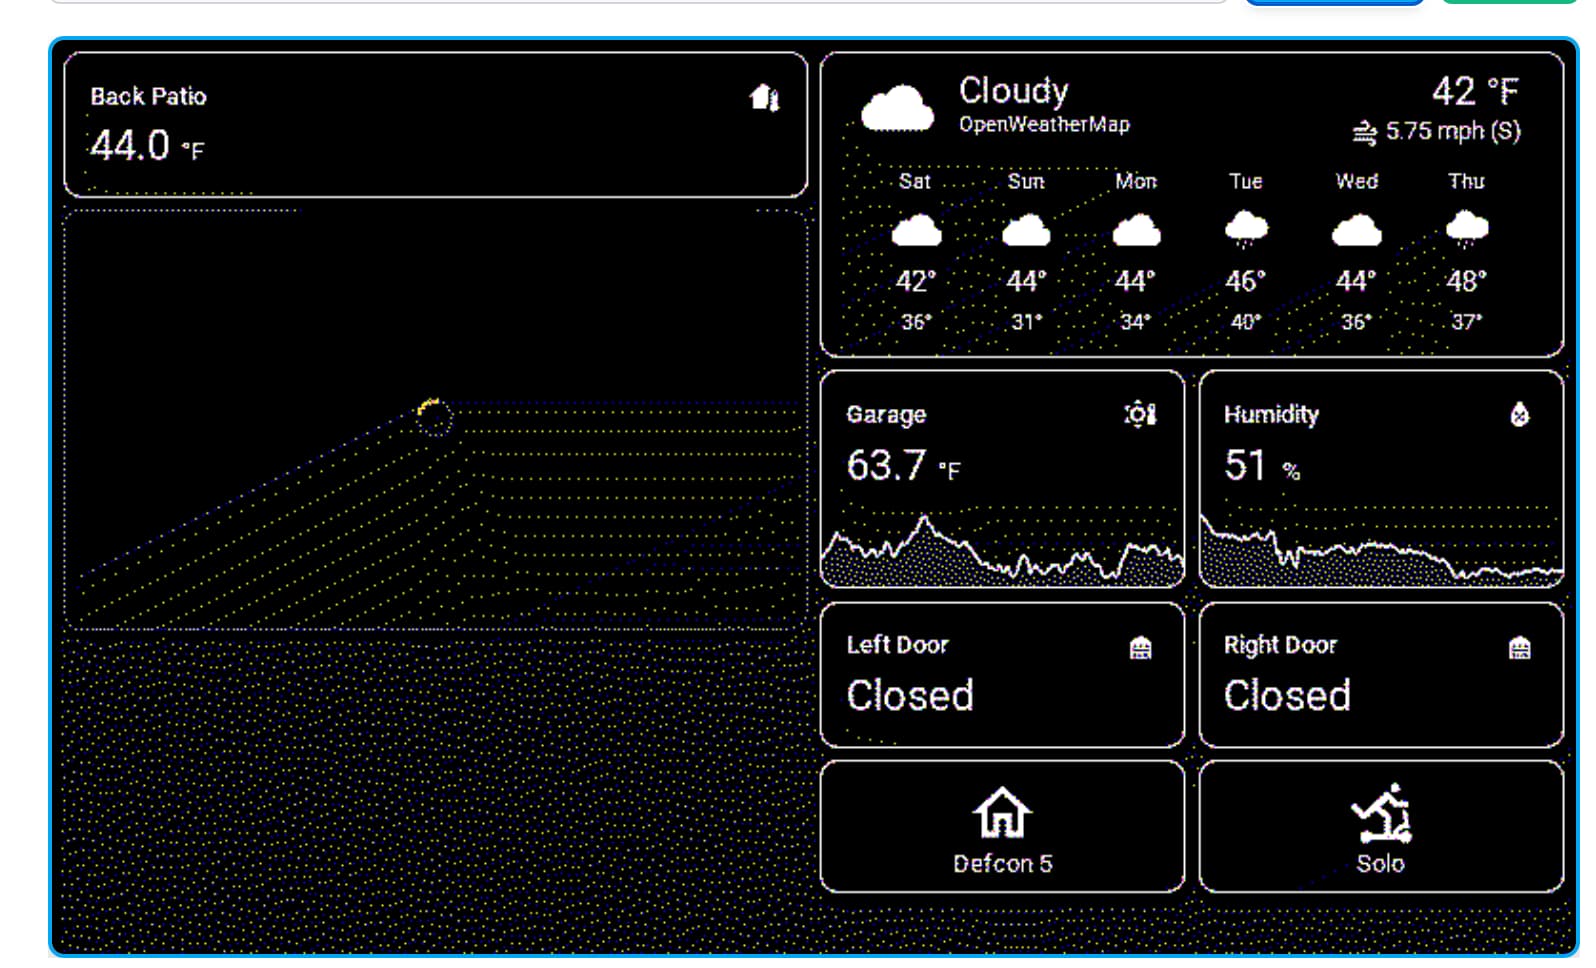
The image is set up as a generic camera, with this as the source: https://radar.weather.gov/ridge/standard/KATX_0.gif . Maybe it’s something to do with it being a gif (even though it’s not animated?) Has anyone tried an image on these?
Dashboard:
Puppet preview:
J4yDubs
November 29, 2025, 9:34pm
18
schuss42:
I just can’t figure out how to keep it refreshed without the screen flickering so much. It goes black, flashes a couple times, displays the whole dash inverted, and then settles into a display like yours, just to refresh the screen. Is there any way to make that smoother? I’m trying to show some statuses with <5 min intervals so want it to refresh pretty often.
That’s, unfortunately, by design. e-ink pixels are persistent meaning that once they are set they stay in that state, even without power. The get the display to change, it sets and then unsets all the pixels, before setting the pixels again. Some displays are smart and can refresh just the parts of the screen that change, but most don’t do that.
J4yDubs
November 29, 2025, 9:55pm
19
I haven’t tried images, but I did just try to put your image on a test dashboard and it displays OK. I tried the different dithering options and they all worked. all of the formats (PNG, BMP, etc) worked as well.
I used a picture entity. Maybe the generic camera is to heavy?
type: picture
image:
  media_content_id: https://radar.weather.gov/ridge/standard/KATX_0.gif
What are you running Home Assistant on? Might be running into a hardware sizing issue? I’m running on an old i7 with 16GB of memory, so CPU and memory are usually not an issue.
schuss42
November 30, 2025, 12:36am
20
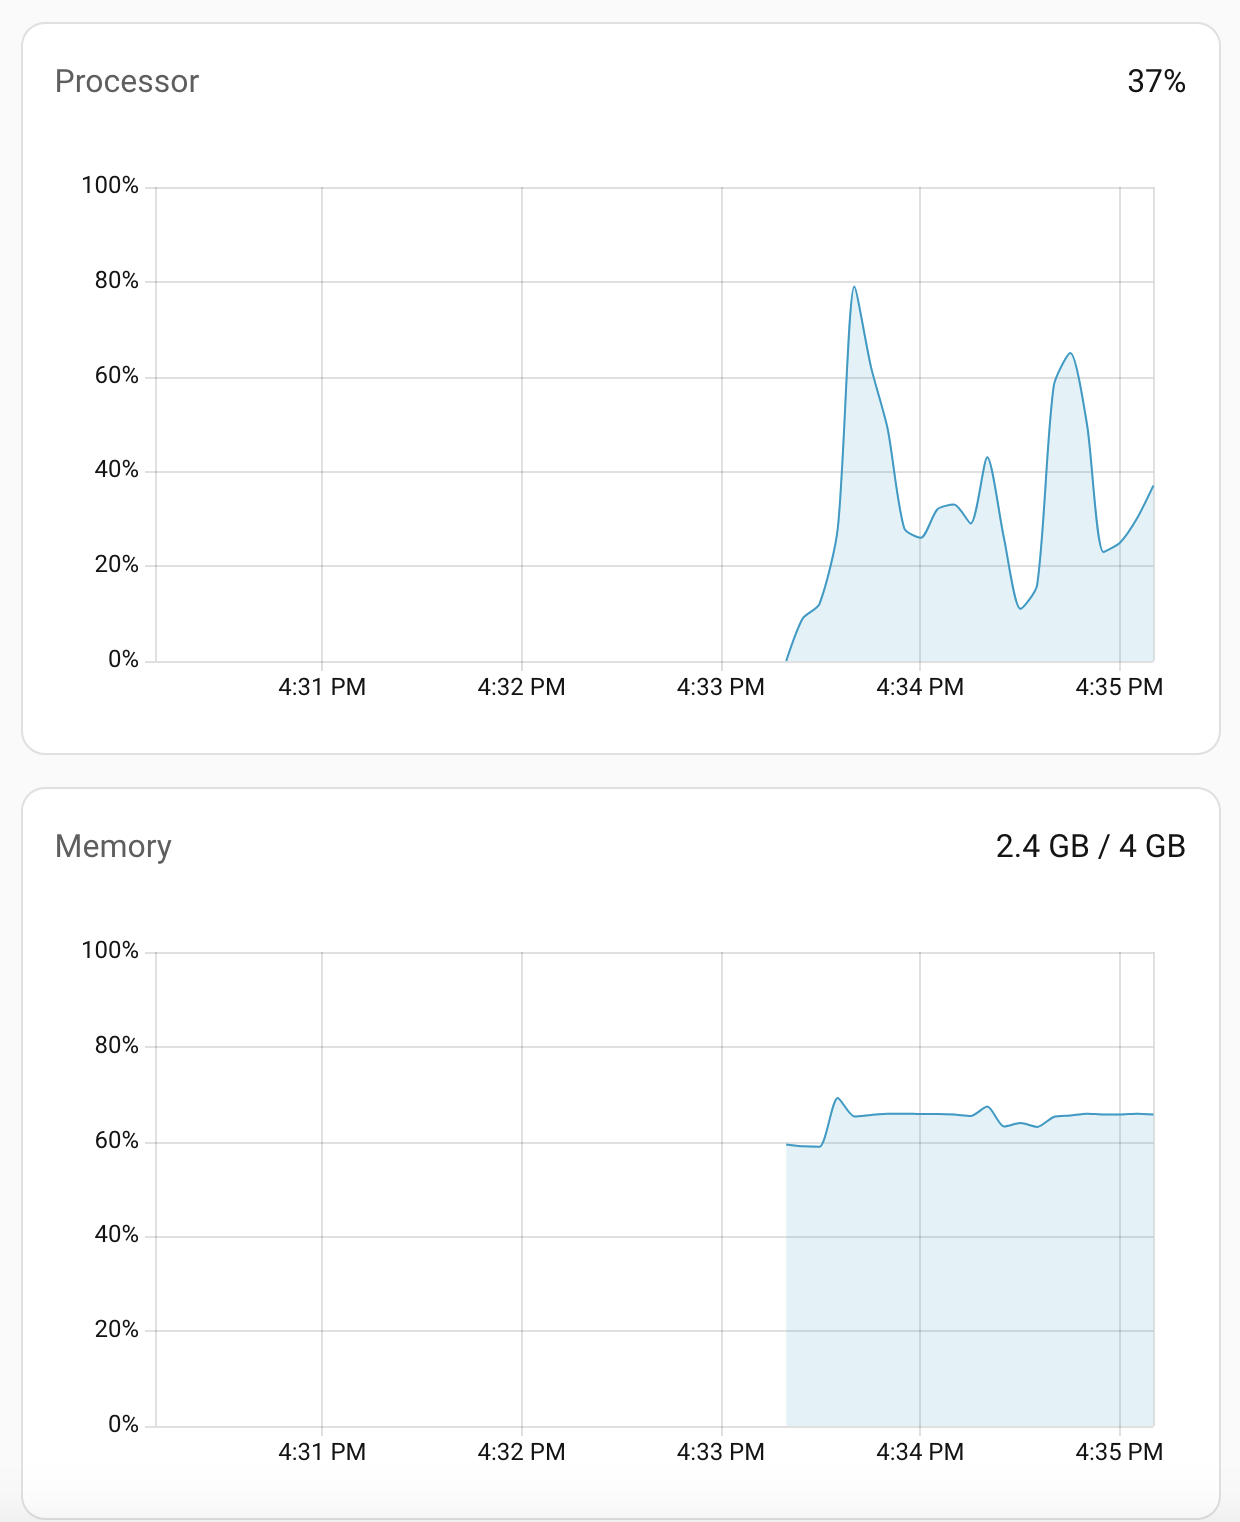
I’m running on an Rpi4 so it only has 4GB but it doesn’t seem to be maxing out from what I can tell. It spikes up when I generate the puppet page but isn’t paging to disk.