Yellow Core Restarts Regularly - Please guide me for further troubleshooting

Hello,
I’m trying to diagnose why my Core restarts three to ten times per day so that I can solve the issue.
The time is not regular, although one of them is often around when my children go to bed → lights don’t turn off, WAF reduces rapidly, sadtimes.
Although as I say it isn’t always exactly the same time and may be a red herring.

I’m fairly technical, but having difficulty finding an error message that I can get my teeth into, and this is where I would appreciate some guidance.

I’ve been looking into this on and off for months, and have got nowhere useful!

Indication

2025-05-13 12:45:11.331 ERROR (MainThread)[homeassistant.components.hassio.handler] Timeout on /info request**
2025-05-13 12:45:11.350 ERROR (MainThread) [homeassistant.components.hassio.handler] Timeout on /core/info request
2025-05-13 12:45:11.354 ERROR (MainThread) [homeassistant.components.hassio.handler] Timeout on /supervisor/info request
2025-05-13 12:45:11.361 ERROR (MainThread) [homeassistant.components.hassio.handler] Timeout on /os/info request
2025-05-13 12:45:11.365 ERROR (MainThread) [homeassistant.components.hassio.handler] Timeout on /network/info request
2025-05-13 12:45:11.373 ERROR (MainThread) [homeassistant.components.hassio.handler] Timeout on /host/info request
2025-05-13 12:45:12.452 WARNING (MainThread) [asyncio] Executing <Handle _SelectorSocketTransport._read_ready()> took 1.052 seconds
2025-05-13 12:45:13.040 WARNING (MainThread) [asyncio] Executing <Handle _SelectorSocketTransport._read_ready()> took 0.531 seconds
2025-05-13 12:45:13.050 WARNING (MainThread) [homeassistant.components.hassio] Can't read Supervisor data: 
2025-05-13 12:45:13.318 WARNING (MainThread) [asyncio] Executing <Task finished name='System Monitor update coordinator - System Monitor - refresh' coro=<DataUpdateCoordinator._handle_refresh_interval() done, defined at /usr/src/homeassistant/homeassistant/helpers/update_coordinator.py:265> result=None created at /usr/src/homeassistant/homeassistant/util/async_.py:45> took 0.263 seconds
2025-05-13 12:45:13.699 WARNING (MainThread) [asyncio] Executing <Handle _SelectorSocketTransport._read_ready()> took 0.348 seconds

What my family experiences is buttons/motionlights not working.

What I experience is the GUI timing out, and the restarting, and then all the usual messages at the bottom of the screen “XYZ is starting, HA won’t be ready until all blah blahs has started”, which tells me the Core has just restarted.

H/W

I run a HA Yellow

S/W

The most recent updates, 2025.5.1.

However, I’ve noticed this issue for the last ~6 months at a rough guess.
At first it was “oh this button isn’t working for 30seconds”, but then I saw a wider problem. I’m busy so haven’t solved the problem yet!

Stats

Although timeouts of the Core appear to be why the Supervisor restarts it, it doesn’t appear to be due to high utilisation:

The spikes don’t correlate with the times of restarts. The big 5:20am spikes are backups, but even then I don’t get high util. Sunday/Monday util is higher, but because of the next points.

Debugging

As per 2024.5+: Tracking down instability issues caused by integrations

I have enabled debug:

homeassistant:
  enabled: true
  debug: true

I have booted into safemode.

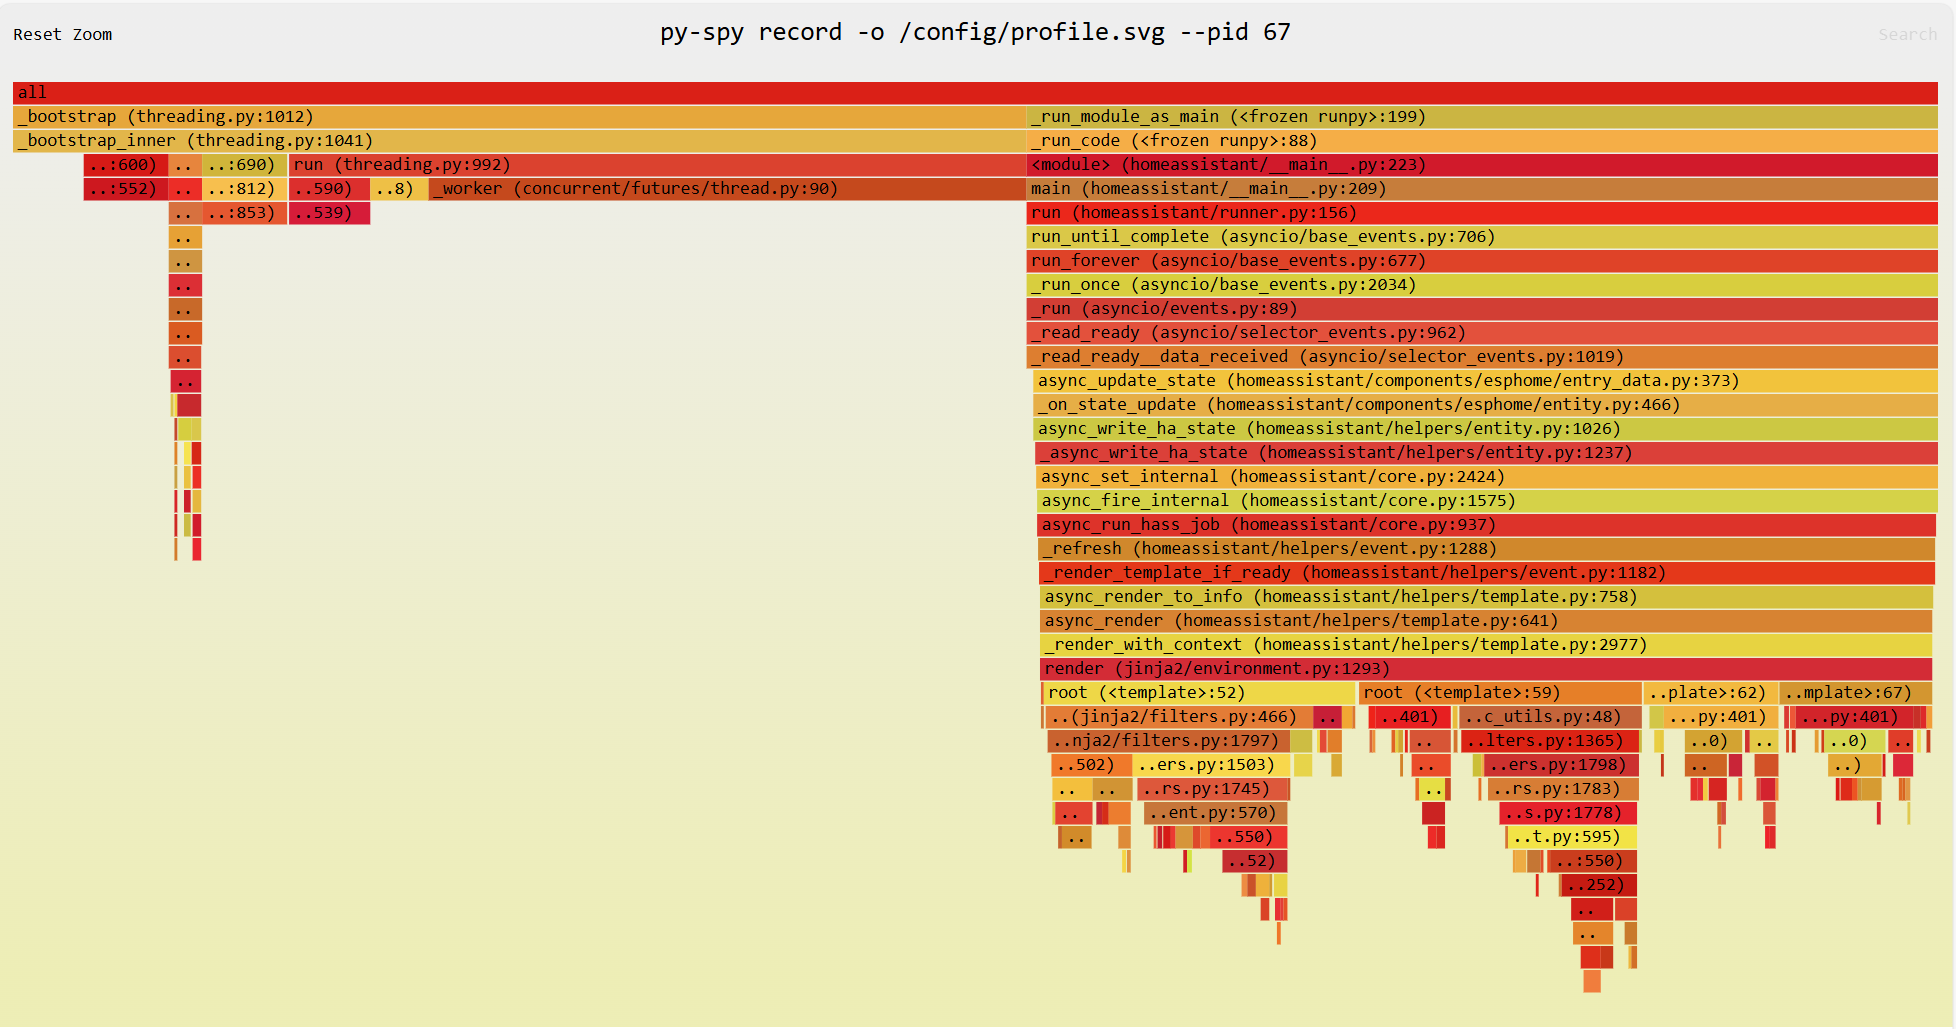
I have installed Profiler.

I have enabled Asyncio Debug Mode at Runtime.

I have also disabled a number of built-in integrations that are not necessary for my house to function, although not all integrations are disabled.

I have disabled my main complicated automations, i.e. a multi-templated motion/light one that I wrote - it’s beautiful - all the house in one automation, but I digress, it’s disabled.

I cannot see any particular “related” errors in any logs, other than the timeouts. I appreciate there are errors in the logs, but they don’t seem to be the faults!

A WLED light seems to have invalid response, generic error.
[homeassistant.components.websocket_api.http.connection] [546876652928] Error handling message: Unknown error (unknown_error) - great, thanks for that.
WARNING (MainThread) [idasen] [E4:DB:71:37:B9:DF] Failed to connect, retrying (1/3)... buggy since I got it, but it works.
Occasional PiHole (on separate Pi) connection errrors, but not always at same time as restarts.

I can’t see any particular problems in Supervisor or Host logs. I may have missed something of course! I can’t see how to attach the logs though!

I disabled the main erroring integrations/automations last night, and so the later logs have less mention of those!

Although no automations in particular appear to be hanging, just the whole system when it restarts.

Any advice on other steps I can take to diagnose would be appreciated. I have the logs although I can’t find where to upload them during the topic creation!

Thanks,
Richard

New user can only attach one image!

You have checked most on this list but you might want to try the remaining ones:

How to Troubleshoot Raspberry Pi Crashing.

See this:

Hi, thanks for the responses.
I believe I’ve checked the relevant items - which did you mean?
I’ve not mentioned the power supply as it’s not the whole device that restarts, just the Core container, and I’ve tried changing the cable to no avail.

I’ve basically disabled all addons, integrations, and automations, and enabled them two or three at a time. Hence the long period before thanking the responses!
Guess what, no repeat of this particular problem yet after a week of having everything re-enabled.

I iregularly have:

WARNING (MainThread) [homeassistant.components.go2rtc] Could not connect to go2rtc instance on http://my-go2rtc-instance:1984 ()
Invalid response from WLED API
[homeassistant.components.websocket_api.http.connection] [547455079168] from 10.XXX.XXX.XXX (Home Assistant/2025.5 (io.robbie.HomeAssistant; build:2025.1264; iOS 18.5.0)): Unexpected error inside websocket API
ERROR (MainThread) [frontend.js.modern.202505160] Uncaught error from WebKit 605.1.15 on iOS 18.5

The last one has a follow-on message about a custom card that I’ve already removed. No idea about that one.

Not sure if I can fix any of the other problems. I don’t use cameras. The WLED strip is on the latest fw. And some API errors. None of them seem related to my Core reboots.

Unless anyone has any suggestions about these other errors then I guess my restarting Core issue is resolved until it happens again :slight_smile: .

Thanks again for the responses.

It’s taken a while but I think I’ve figured it out. I’m “circling back” in case the info helps anyone who stumbles across this thread.

I continued to investigate my issues and confirmed the HA Core container was utilising 100% of one core. It couldn’t communicate with the Supervisor container and so the Supervisor rebooted it after the appropriate timeout time period (as it should).

This made things difficult using the GUI, and so all diagnoses and troubleshooting had to be performed through the CLI which I accessed through SSH, using an ssh key I set up. This had the added benefit of enabling me direct access to the Docker command.

While digging around in the Core container I noticed I had a sqlite.db of around 2 GB. Not good. And considering I had set up MariaDB+InfluxDB over a year ago I was a little confused. It turned out that I had missed the step of setting up a recorder. I had either misunderstood what the recorder was, or decided that “I’ll get around to that later”. (recorders are the data sink configurations for anyone unaware, i.e. where your logs and entity data goes)

Aha that must be the culprit! SQLite isn’t designed for 2 GB databases! Ok, this time I’ll set it up properly: I’ll exclude items that update too frequently for MariaDB and are suited for InfluxDB, and I’ll include specific items for InfluxDB that I want a timeseries for over a long period.

But how do I know the difference?

I don’t expect anyone to use this but I created a python script that connects to the SQLite database and analyses the noisy entities, it can also be configured to connect to a MariaDB and do the same. The script “assists” your “home” by producing some a table and some files to split the entities. The repo explains in more detail:

Feel free to make merge requests, or just suggestions for improvement, in here or in the repo.

I ran it, and set up the recorders correctly.

All is well for about 2 minutes when I realise the GUI is timing out. Further troubleshooting and work is required, but at least one thing is sorted.


Second go round the mullberry bush

Using top inside the Core container showed me that it was the homeassistant.py script heavily using the CPU. Time to roll my sleeves up. I used py-spy (GitHub - benfred/py-spy: Sampling profiler for Python programs) to profile the script.

I found a few quirks due to the script running in a container on an ARM Raspberry Pi without the right libraries and so had to use the following setup:

LD_LIBRARY_PATH=/usr/local/lib/python3.13/site-packages/py_spy.libs \
py-spy record \
  --pid 67 \
  --rate 5 \
  --duration 20 \
  -o /config/profile.svg

Alternatively you can use the dump feature if the svg creation is b0rked by whatever you’re trying to diagnose:

LD_LIBRARY_PATH=/usr/local/lib/python3.13/site-packages/py_spy.libs py-spy dump --pid 67 > /config/stack.txt

(for each methos replace the pid of the python script process → the second column from ps -aux | grep homeassistant)

A beautiful flamegraph output:

Looking at the dump text I saw lots of:

attrgetter (jinja2/filters.py:73)
sync_do_map / sync_do_unique / select_or_reject (jinja2/filters.py)
root (<template>:52)
render (_render_with_context / async_render / _render_template_if_ready)
_refresh (helpers/event.py:1288)

This, combined with the SVG image led me to templating. I slammed my template_sensors.yaml into ChatGPT as a first shot and I hit gold:

I can see exactly what’s causing your CPU spikes. The culprit is the first template for the devices attribute, specifically this part:

{% set batt_sensors = states.sensor
   | selectattr('attributes.device_class', 'defined')
   | selectattr('attributes.device_class', 'eq', 'battery') %}
{% set ns = namespace(batt_low=[]) %}
{% for s in batt_sensors if s.state | float(101) <= threshold %}
  {% set ns.batt_low = ns.batt_low + [device_attr(s.entity_id, 'name_by_user') or device_attr(s.entity_id, 'name') or s.name] %}
{% endfor %}
{{ ns.batt_low }}

Why it’s slow:

  1. states.sensor iterates over all sensors every template evaluation — potentially hundreds of entities.
  2. For each sensor, it calls selectattr multiple times.
  3. Then the loop constructs a new list every iteration: ns.batt_low = ns.batt_low + [...] → list concatenation is O(n) each time. For 50+ sensors, that quickly becomes expensive.
  4. This template runs every time Home Assistant refreshes the template, leading to the 59% CPU usage.

Long story short that template sensor is meant to check all the devices with batteries and see if they are low. But it fires all the freaking time, and does so incredibly inefficiently. It was fine before I added more and more and more and more devices. And more devices.

So after playing around I currently have a helper automation that constructs the list of devices that have batteries by creating a group from them:

actions:
  - action: group.set
    metadata: {}
    data:
      object_id: low_battery_devices
      entities: |
        {% set threshold = 10 %}
        {% set batt_sensors = states.sensor
          | selectattr('attributes.device_class', 'equalto', 'battery') | list %}
        {% set ns = namespace(low=[]) %}
        {% for s in batt_sensors if s.state | float(101) <= threshold %}
          {% set ns.low = ns.low + [ s.entity_id ] %}
        {% endfor %}
        {{ ns.low | join(', ') }}

Nice.

Tidy, and now I do not have homeassistant destroying a core, itself, my sanity, and resulting in 20% PAF.