That’s completely normal for a few minutes after a restart before the Z-wave network fully initializes. Try in a few minutes.
Awesome tool; I need some work to do it would appear:

I’ve just gone through and assigned locations to all my devices and my graph looks even better than before now - fantastic update!
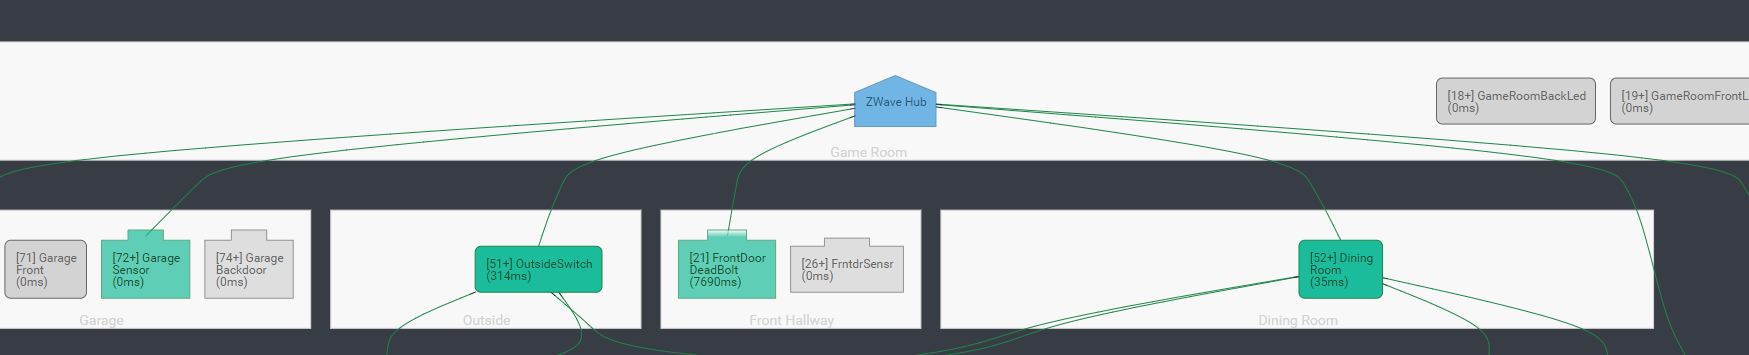
It’s a very minor thing, but would it be possible to reduce the amount of crossover some lines have? For example here, there’s a connection going from my hub to devices in 3 different rooms. However, the room that’s on the left of the screenshot is the righthand most line from the hub. Equally, the room on the right of the screenshot comes from the lefthand most line. As a result, they cross over in the middle. It’s still readable but if the lefthand most line went to the left box and vice-versa for the right hand, it would make it look even neater and cleaner - is this possible?
Unfortunately, this is not something that is controlled by our code but rather within the library. My own graph is a big joyful mess as well, that’s why I’ve added the mouse hover functionality so I can see clearly the connection of the node that is hovered over. You might want to look in the code and play with this line
curve: d3.curveBundle
and see if any of the other options listed here will help:
1 Like
@AdamNaj - This is an excellent piece of work!
I’ve only recently switched to Z-Wave for my battery powered TRVs and there has been a steep learning curve. I’ve got a couple of mains devices on order to help with routing, but this tool allows me to easily visualise the state of my mesh (or current lack of it!!!).
I only found this by accident today in the Latest Configuration Topics section due to others posting.
Thanks again,
bikefright.
Looks great, I like the improvements. Why does it stil look the old style on iPhone app? I assume it is cached or something but can’t figure out how to reset the cache.
How did you do this in HA?
@AdamNaj I don’t think this graph is entirely accurate. After I posted my graph (above) I moved one of my extenders around and saw this in the log:
2019-01-12 16:18:39.050 Detail, Node008, Queuing (Controller) Request Node Neighbor Update
2019-01-12 16:18:39.050 Detail, Node008, Queuing (Controller) Delete All Return Routes
2019-01-12 16:18:39.050 Detail, Node008, Queuing (Controller) Assign Return Route
2019-01-12 16:18:39.050 Info, Requesting Neighbor Update for node 8
2019-01-12 16:18:39.050 Detail, Node008, Queuing (Command) ControllerCommand_RequestNodeNeighborUpdate (Node=8): 0x01, 0x05, 0x00, 0x48, 0x08, 0x65, 0xdf
2019-01-12 16:18:39.050 Detail, Notification: ControllerCommand - Starting
2019-01-12 16:18:39.052 Detail,
2019-01-12 16:18:39.052 Info, Node008, Sending (Command) message (Callback ID=0x65, Expected Reply=0x48) - ControllerCommand_RequestNodeNeighborUpdate (Node=8): 0x01, 0x05, 0x00, 0x48, 0x08, 0x65, 0xdf
2019-01-12 16:18:39.094 Detail, Node008,   Received: 0x01, 0x05, 0x00, 0x48, 0x65, 0x21, 0xf6
2019-01-12 16:18:39.094 Detail,
2019-01-12 16:18:39.094 Info, Node008, REQUEST_NEIGHBOR_UPDATE_STARTED
2019-01-12 16:18:39.094 Detail, Node033,   Expected callbackId was received
2019-01-12 16:18:39.094 Detail, Node033,   Expected reply was received
2019-01-12 16:18:39.094 Detail, Node033,   Message transaction complete
2019-01-12 16:18:39.094 Detail,
2019-01-12 16:18:39.094 Detail, Node008, Removing current message
2019-01-12 16:18:39.094 Detail, Notification: ControllerCommand - InProgress
2019-01-12 16:18:39.095 Info, WriteNextMsg Controller nothing to do
2019-01-12 16:18:39.811 Detail,   Received: 0x01, 0x05, 0x00, 0x48, 0x65, 0x22, 0xf5
2019-01-12 16:18:39.811 Detail,
2019-01-12 16:18:39.811 Info, REQUEST_NEIGHBOR_UPDATE_DONE
2019-01-12 16:18:39.811 Detail, Requesting routing info (neighbor list) for Node 8
2019-01-12 16:18:39.811 Detail, Node008, Queuing (Command) Get Routing Info (Node=8): 0x01, 0x07, 0x00, 0x80, 0x08, 0x00, 0x00, 0x03, 0x73
2019-01-12 16:18:39.811 Detail, Notification: ControllerCommand - Completed
2019-01-12 16:18:39.812 Detail,
2019-01-12 16:18:39.812 Info, Node008, Sending (Command) message (Callback ID=0x00, Expected Reply=0x80) - Get Routing Info (Node=8): 0x01, 0x07, 0x00, 0x80, 0x08, 0x00, 0x00, 0x03, 0x73
2019-01-12 16:18:39.820 Detail, Node008,   Received: 0x01, 0x20, 0x01, 0x80, 0x72, 0x01, 0x00, 0x00, 0x00, 0x00, 0x00, 0x00, 0x00, 0x00, 0x00, 0x00, 0x00, 0x00, 0x00, 0x00, 0x00, 0x00, 0x00, 0x00, 0x00, 0x00, 0x00, 0x00, 0x00, 0x00, 0x00, 0x00, 0x00, 0x2d
2019-01-12 16:18:39.820 Detail,
2019-01-12 16:18:39.820 Info, Node008, Received reply to FUNC_ID_ZW_GET_ROUTING_INFO
2019-01-12 16:18:39.820 Info, Node008,     Neighbors of this node are:
2019-01-12 16:18:39.820 Info, Node008,     Node 2
2019-01-12 16:18:39.820 Info, Node008,     Node 5
2019-01-12 16:18:39.820 Info, Node008,     Node 6
2019-01-12 16:18:39.820 Info, Node008,     Node 7
2019-01-12 16:18:39.820 Info, Node008,     Node 9
2019-01-12 16:18:39.820 Detail, Node001,   Expected reply was received
2019-01-12 16:18:39.821 Detail, Node001,   Message transaction complete
2019-01-12 16:18:39.821 Detail,
2019-01-12 16:18:39.821 Detail, Node008, Removing current message
2019-01-12 16:18:39.821 Info, Deleting all return routes from node 8
2019-01-12 16:18:39.821 Detail, Node008, Queuing (Command) ControllerCommand_DeleteAllReturnRoutess (Node=8): 0x01, 0x05, 0x00, 0x47, 0x08, 0x66, 0xd3
2019-01-12 16:18:39.821 Detail, Notification: ControllerCommand - Starting
2019-01-12 16:18:39.822 Detail,
2019-01-12 16:18:39.822 Info, Node008, Sending (Command) message (Callback ID=0x66, Expected Reply=0x47) - ControllerCommand_DeleteAllReturnRoutess (Node=8): 0x01, 0x05, 0x00, 0x47, 0x08, 0x66, 0xd3
2019-01-12 16:18:39.945 Detail, Node008,   Received: 0x01, 0x04, 0x01, 0x47, 0x01, 0xbc
2019-01-12 16:18:39.945 Detail,
2019-01-12 16:18:39.945 Info, Node008, Received reply to FUNC_ID_ZW_DELETE_RETURN_ROUTE - command in progress
2019-01-12 16:18:39.945 Detail, Notification: ControllerCommand - InProgress
2019-01-12 16:18:40.343 Detail, Node008,   Received: 0x01, 0x05, 0x00, 0x47, 0x66, 0x00, 0xdb
2019-01-12 16:18:40.343 Detail,
2019-01-12 16:18:40.343 Info, Node008, Received reply to FUNC_ID_ZW_DELETE_RETURN_ROUTE for node 8 - SUCCESS
2019-01-12 16:18:40.343 Detail,   Expected callbackId was received
2019-01-12 16:18:40.343 Detail,   Expected reply was received
2019-01-12 16:18:40.343 Detail,   Message transaction complete
2019-01-12 16:18:40.343 Detail,
2019-01-12 16:18:40.343 Detail, Node008, Removing current message
2019-01-12 16:18:40.343 Detail, Notification: ControllerCommand - Completed
2019-01-12 16:18:40.344 Info, Assigning return route from node 8 to node 1
2019-01-12 16:18:40.344 Detail, Node008, Queuing (Command) ControllerCommand_AssignReturnRoute (Node=8): 0x01, 0x06, 0x00, 0x46, 0x08, 0x01, 0x67, 0xd1
2019-01-12 16:18:40.344 Detail, Notification: ControllerCommand - Starting
2019-01-12 16:18:40.345 Detail,
2019-01-12 16:18:40.345 Info, Node008, Sending (Command) message (Callback ID=0x67, Expected Reply=0x46) - ControllerCommand_AssignReturnRoute (Node=8): 0x01, 0x06, 0x00, 0x46, 0x08, 0x01, 0x67, 0xd1
2019-01-12 16:18:40.528 Detail, Node008,   Received: 0x01, 0x04, 0x01, 0x46, 0x01, 0xbd
2019-01-12 16:18:40.528 Detail,
2019-01-12 16:18:40.529 Info, Node008, Received reply to FUNC_ID_ZW_ASSIGN_RETURN_ROUTE - command in progress
2019-01-12 16:18:40.529 Detail, Notification: ControllerCommand - InProgress
2019-01-12 16:18:41.355 Detail, Node008,   Received: 0x01, 0x05, 0x00, 0x46, 0x67, 0x00, 0xdb
2019-01-12 16:18:41.355 Detail,
2019-01-12 16:18:41.355 Info, Node008, Received reply to FUNC_ID_ZW_ASSIGN_RETURN_ROUTE for node 8 - SUCCESS
2019-01-12 16:18:41.355 Detail,   Expected callbackId was received
2019-01-12 16:18:41.355 Detail,   Expected reply was received
2019-01-12 16:18:41.356 Detail,   Message transaction complete
2019-01-12 16:18:41.356 Detail,
2019-01-12 16:18:41.356 Detail, Node008, Removing current message
2019-01-12 16:18:41.356 Detail, Notification: ControllerCommand - Completed
It shows Node008 (extender) has a return route to Node001 (controller; zstick) and has neighbors but I don’t see this represented in the graph. I see Node008 connected to Node009 (another extender) and other nodes connecting to Node009 but not to Node008 as the logs seem to imply?
EDIT: After looking (hard) at the graph; I guess it does represent redundancy/mesh as those that are 2 hops all live on the same level (where Node008 is) and while some have a path through Node009, they all pass through Node008 which passes through Node009 (although there’s no redundancy otherwise to Node001, not sure how to fix that.)
In order to get this working in the iPhone app I tried the following to prevent old version from loading from cache.
- Changed name of file from zwavegraph2.html to zwacegraph.html
- Changed config to use new name and to change url_path from zwave to zwave-graph.
- changed name insize zwavegraph.html from ha-panel-zwavegraph2 to ha-panel-zwavegraph
This results in the browser still working on PC.
Browser still working on iPhone from chrome.
But now the iPhone app displays a blank page and I can’t get it to refresh and load the page.
Should this new version of the panel work in the iPhone app, the old version did?
UPDATE: Got it working. Had to delete the app and reinstall. That seems like a bug in the app if it can’t clear cache or allow reload to force a new load. I was trying to avoid this because I was worried it would be a pain to re-install the app with tracking, notifications etc but it was easy to just configure them again once I re-installed.
1 Like
You need to edit the Open Z-Wave config and for nodes that you want to listed in a group fill-in the location attribute.
<Node id="4" name="Living Room TV Plug" location="Living Room" ...>
...
</Node>
1 Like
The graph is not showing all routes. @NigelL - implemented it quite cleverly in a way that it shows only routes where both nodes have each other other in neighbors list. and will show routes only to nodes with lesser number of hops. Therefore this graph should technically show the stable routes but may not show some routes that would be sub-optimal. It’s not really showing the full state of your network (you can still see the reported neighbors in the tooltip) or the routes that the network will pick but you can use it to detect the nodes that were orphaned by the mesh or are otherwise in trouble so you can pick a good spot in the house for the extenders. In your case, I would run the Heal procedure a couple of times and give the mesh some time for the battery-powered devices to wake and fully heal. It usually takes a few days for me for the network to fully recover after some extender changes.
1 Like
This section is responsible for styling the groups:
.cluster > rect
      {
        stroke: lightgray;
        fill: #f8f8f8;
        stroke-width: 1px;
        stroke-linecap: round;
      }
you can change the fill attribute value to transparent.
For anyone attempting to change the background colors of grouped Z-Wave entities while using a custom theme, you will need to refresh the page AND switch away and back to the Z-Wave Graph tab a few times before the changes will take effect.
What would it take to get this added to the standard Z wave configuration menu? It would be a nice standard component of Home Assistant.
Alternatively you could clear browser cache and reload the page once 
Ctrl+Shift+Delete on Chrome

I am not sure a whole other section only for a graph is what the platform would accept. Additionally it’s not mobile optimized like the rest of the UI
My zwave mesh shows the following graph:

For some reason, some of my entities still don’t show any connections, although neighbors are defined when looking at the entity info.
Any ideas why?
@tomoqv How long did you wait for the graph to configure? It takes a while for all devices to populate their mesh configuration, especially battery devices.
If you viewed the graph right after startup, this is normal.
Last reboot was over 20 hours ago. The graph posted was 4 hours ago. Now it looks like this:

Only the main door sensor has been added. On a sidenote, I am not sure that my zwave network is completely healthy. I still get some remnants of entities that are no long recognized by hass.io. I really wanted to rebuild my whole mesh, and therefore removed all of the zwave references in the core.* files and deleted the zwcfg*.xlm. To get most of my entities to populate again though, I had to restore a previous version of the latter.