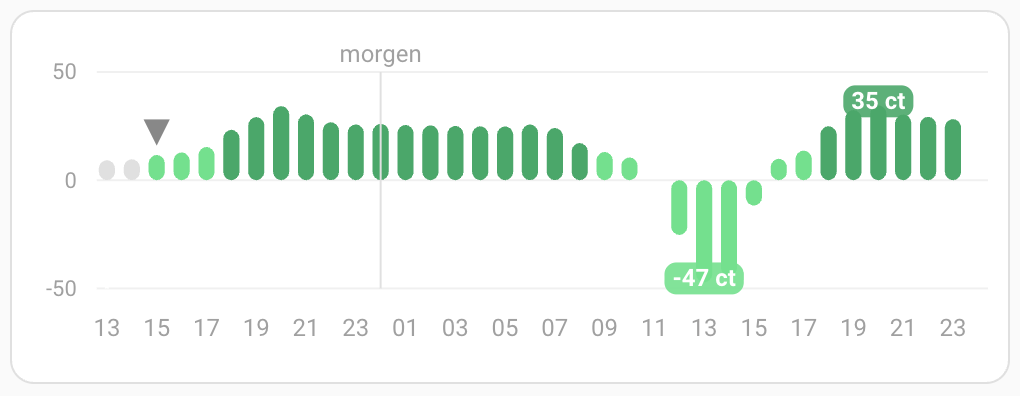
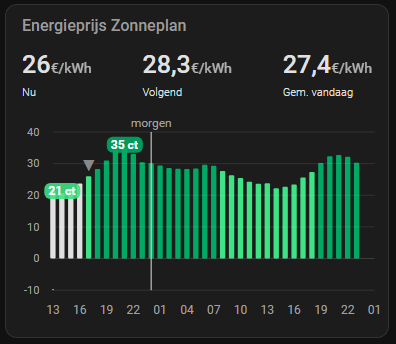
created a Apex Chart dahboard with some options about current, next hour price and average of today
type: custom:apexcharts-card
graph_span: 36h
span:
  start: hour
  offset: "-4h"
header:
  show: true
  title: Energieprijs Zonneplan
  show_states: true
  colorize_states: false
apex_config:
  chart:
    height: 220
    fontFamily: inherit
    stacked: true
  legend:
    show: false
  tooltip:
    shared: false
    x:
      format: d MMM, HH:00
    "y":
      formatter: |
        EVAL:function(value) {
          if (value === null || typeof value === 'undefined') return "";
          return value.toFixed(1).replace('.', ',') + " ct";
        }
  plotOptions:
    bar:
      borderRadius: 1
      columnWidth: 60%
  grid:
    borderColor: rgba(255,255,255,0.06)
    strokeDashArray: 0
    xaxis:
      lines:
        show: false
    yaxis:
      lines:
        show: false
  dataLabels:
    background:
      enabled: true
      borderWidth: 0
      borderRadius: 6
      dropShadow:
        enabled: false
    formatter: |
      EVAL:function(value) {
        if (value === null || typeof value === 'undefined') return "";
        return Math.round(value) + " ct";
      }
  xaxis:
    labels:
      format: HH
      style:
        colors: "#a0a0a0"
    axisBorder:
      show: false
    axisTicks:
      show: false
    tooltip:
      enabled: false
  yaxis:
    min: -10
    labels:
      formatter: |
        EVAL:function(value) {
          return Math.round(value);
        }
      style:
        colors: "#a0a0a0"
  annotations:
    xaxis:
      - x: EVAL:new Date().setHours(24,0,0,0)
        strokeDashArray: 0
        borderColor: "#e0e0e0"
        borderWidth: 1
        label:
          text: morgen
          borderWidth: 0
          orientation: horizontal
          offsetY: -9
          style:
            color: "#a0a0a0"
            background: transparent
            fontSize: 12px
    yaxis:
      - "y": -10
        borderColor: rgba(255,255,255,0.10)
        borderWidth: 1
        strokeDashArray: 0
      - "y": 0
        borderColor: rgba(255,255,255,0.15)
        borderWidth: 1
        strokeDashArray: 0
      - "y": 10
        borderColor: rgba(255,255,255,0.10)
        borderWidth: 1
        strokeDashArray: 0
      - "y": 20
        borderColor: rgba(255,255,255,0.10)
        borderWidth: 1
        strokeDashArray: 0
      - "y": 30
        borderColor: rgba(255,255,255,0.10)
        borderWidth: 1
        strokeDashArray: 0
      - "y": 40
        borderColor: rgba(255,255,255,0.10)
        borderWidth: 1
        strokeDashArray: 0
    points:
      - x: EVAL:new Date().setMinutes(0,0,0)
        "y": |
          EVAL:(parseFloat(
            document.querySelector('home-assistant')?.hass?.states['sensor.zonneplan_current_electricity_tariff']?.state || 0
          ) * 100)
        marker:
          size: 0
        label:
          text: ▼
          borderWidth: 0
          offsetY: 5
          style:
            color: "#888888"
            background: transparent
            fontSize: 16px
series:
  - entity: sensor.zonneplan_current_electricity_tariff
    name: Nu
    unit: ""
    show:
      in_chart: false
      in_header: true
    transform: |
      return (Number(x) * 100).toFixed(0);
  - entity: sensor.zonneplan_current_electricity_tariff
    name: Volgend
    unit: ""
    show:
      in_chart: false
      in_header: true
    data_generator: >
      const now = new Date();

      now.setMinutes(0,0,0);


      const forecast = entity.attributes.forecast || [];

      const next = forecast.find(e => new Date(e.datetime).getTime() >
      now.getTime());


      if (!next) return [];


      const t = new Date(next.datetime).getTime();

      const p = (next.electricity_price / 10000000) * 100;


      return [[t, p]];
    transform: |
      return Number(x).toFixed(1);
  - entity: sensor.zonneplan_current_electricity_tariff
    name: Gem. vandaag
    unit: ""
    show:
      in_chart: false
      in_header: true
    data_generator: |
      const forecast = entity.attributes.forecast || [];
      const today = new Date().toDateString();

      const prices = forecast
        .filter(e => new Date(e.datetime).toDateString() === today)
        .map(e => (e.electricity_price / 10000000) * 100);

      if (!prices.length) return [];

      const avg = prices.reduce((a, b) => a + b, 0) / prices.length;
      return [[Date.now(), avg]];
    transform: |
      return Number(x).toFixed(1);
  - entity: sensor.zonneplan_current_electricity_tariff
    name: Tarief verleden
    type: column
    color: "#e0e0e0"
    show:
      datalabels: false
      in_header: false
    data_generator: |
      const currentHourStart = new Date().setMinutes(0,0,0);
      const forecast = (entity.attributes.forecast || []).slice()
        .sort((a, b) => new Date(a.datetime) - new Date(b.datetime));

      return forecast.map(e => {
        const t = new Date(e.datetime).getTime();
        const p = (e.electricity_price / 10000000) * 100;
        return t < currentHourStart ? [t, p] : [t, null];
      });
  - entity: sensor.zonneplan_current_electricity_tariff
    name: Tarief laag
    type: column
    color: "#3de385"
    show:
      datalabels: false
      in_header: false
    data_generator: |
      const currentHourStart = new Date().setMinutes(0,0,0);
      const forecast = (entity.attributes.forecast || []).slice()
        .sort((a, b) => new Date(a.datetime) - new Date(b.datetime));

      return forecast.map(e => {
        const t = new Date(e.datetime).getTime();
        const p = (e.electricity_price / 10000000) * 100;
        const low = (e.tariff_group || "").includes("low") || p < 0;
        return (t >= currentHourStart && low) ? [t, p] : [t, null];
      });
  - entity: sensor.zonneplan_current_electricity_tariff
    name: Tarief normaal
    type: column
    color: "#00a964"
    show:
      datalabels: false
      in_header: false
    data_generator: |
      const currentHourStart = new Date().setMinutes(0,0,0);
      const forecast = (entity.attributes.forecast || []).slice()
        .sort((a, b) => new Date(a.datetime) - new Date(b.datetime));

      return forecast.map(e => {
        const t = new Date(e.datetime).getTime();
        const p = (e.electricity_price / 10000000) * 100;
        const low = (e.tariff_group || "").includes("low") || p < 0;
        return (t >= currentHourStart && !low) ? [t, p] : [t, null];
      });
  - entity: sensor.zonneplan_current_electricity_tariff
    name: Max
    type: line
    color: "#00a964"
    stroke_width: 0
    show:
      datalabels: true
      in_header: false
    data_generator: |
      const forecast = entity.attributes.forecast || [];
      const today = new Date().toDateString();

      let max = { p: -999, t: null };

      forecast.forEach(e => {
        const t = new Date(e.datetime).getTime();
        const d = new Date(e.datetime).toDateString();
        const p = (e.electricity_price / 10000000) * 100;

        if (d === today && p > max.p) {
          max = { p, t };
        }
      });

      let placed = false;
      return forecast.map(e => {
        const t = new Date(e.datetime).getTime();
        const d = new Date(e.datetime).toDateString();
        const p = (e.electricity_price / 10000000) * 100;

        if (!placed && d === today && Math.abs(p - max.p) < 0.01) {
          placed = true;
          return [t, p];
        }
        return [t, null];
      });
  - entity: sensor.zonneplan_current_electricity_tariff
    name: Min
    type: line
    color: "#3de385"
    stroke_width: 0
    show:
      datalabels: true
      in_header: false
    data_generator: |
      const forecast = entity.attributes.forecast || [];
      const today = new Date().toDateString();

      let min = { p: 999, t: null };

      forecast.forEach(e => {
        const t = new Date(e.datetime).getTime();
        const d = new Date(e.datetime).toDateString();
        const p = (e.electricity_price / 10000000) * 100;

        if (d === today && p < min.p) {
          min = { p, t };
        }
      });

      let placed = false;
      return forecast.map(e => {
        const t = new Date(e.datetime).getTime();
        const d = new Date(e.datetime).toDateString();
        const p = (e.electricity_price / 10000000) * 100;

        if (!placed && d === today && Math.abs(p - min.p) < 0.01) {
          placed = true;
          return [t, p];
        }
        return [t, null];
      });