0.117.0 continual memory increase

I’m using a Rpi4 with 8GB ram. Add-ons are: DuckDNS, ESPHome, Grafana, InfluxDB, Google Drive Backup, Network UPS Tools, Node-RED, Samba Share, deCONZ.

I went from HA 0.116.4 to 0.117.0 and I noticed on my Grafana graphs for Rpi memory that there was a gradual increase in memory usage, which was unusual. To the point it was double “normal” use in a few hours.

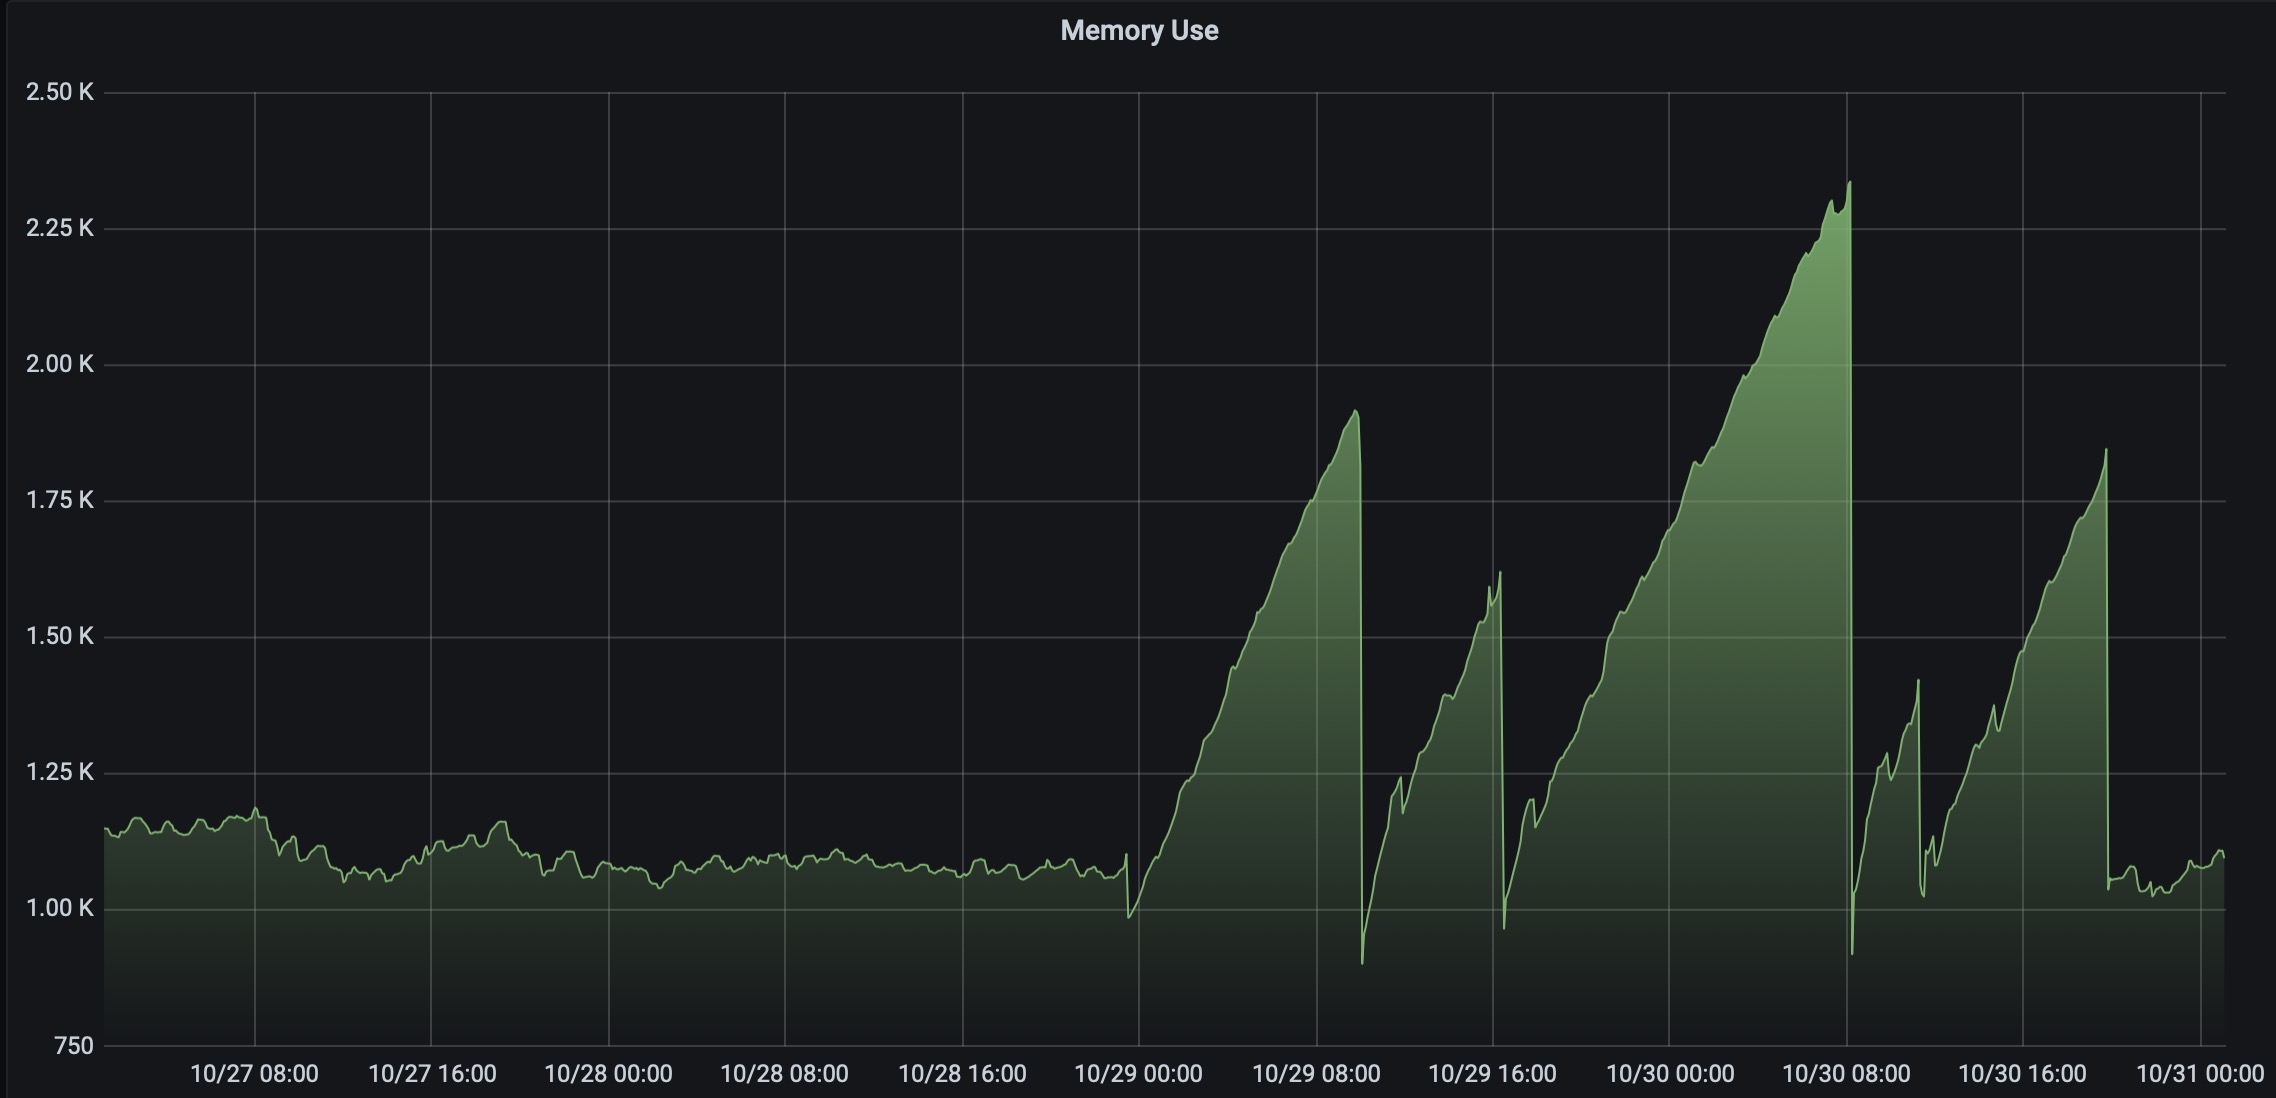
The attached image is over 4 days, and there are five sloping increases which I will explain. I’ve included previous time when I was using 0.116.4 to show it was “calm”. The first ramp increase is when I upgraded from 0.116.4 to 0.117.0. This is abnormal behaviour from what I have seen previously over the past nine months. On the same day HA updated, Grafana also updated from 5.3.2 to 5.3.3, and I will come to this later.

When the first ramp peak started, I rebooted the machine to clear the ram and maybe stop something running that was causing it. I left it for a few hours and so there is a second ramp up in memory use.

After the second ramp up after the soft reboot, I physically shut the RPi down completely. Shutdown, power off, power on. This then caused the third ramp to develop.

I then tried to eliminate Grafana from being the problem by rolling that back to 5.3.2 (which solved an iOS Grafana panel issue, but that’s another thing) but the memory continued to increase into a fourth ramp, which got as high as 2.3GB of ram used as compared to just over 1GB normally.

I noticed 0.117.1 was available, so I updated to that, thinking maybe that would solve the problem. That’s when the fifth ramp developed.

As a last resort, I rolled back to 0.116.4, low and behold the memory has levelled back out again to what it was before.

So the culprit is something in 0.117.0 and above which is causing the RPi to gobble up memory usage. In correlation to memory usage, it’s also increasing CPU usage which follows a similar pattern, and then also that obviously causes a temperature increase which also follows the same pattern.

So, has anyone else who is monitoring their RPi parameters using Grafana seeing a similar increase in memory usage after updating to 0.117.0 and above?

I have mentioned this in the Discord channels.

Steady ram usage: 0.116.4
Ramp 1: update to 0.117.0
Ramp 2: soft reboot
Ramp 3: hard reboot
Ramp 4: Grafana rollback
Ramp 5: Update to 0.117.1
Back to steady ram usage: rolled back to 0.116.4

2 Likes

Likely related to https://github.com/home-assistant/core/issues/42390
With the fix PR here: https://github.com/home-assistant/core/pull/42651

Those graphs do look very similar, so I’m glad it’s being looked into But I’m not running any ONVIF cameras or add-ons. Would this possible bug still affect users not using ONVIF cameras?

Mine is on an RPi3B. The high RAM usage started either when Supervisor 2020.10.0 was installed or upgrading to 0.117.0.

Add-ons are:
AdGuard Home
AirCast
File Editor
Node-Red
Samba Share
Terminal & SSH

Supervisor logs are constantly repeating the same error.

20-10-31 16:45:29 WARNING (MainThread) [supervisor.misc.tasks] Watchdog/Docker found a problem with observer plugin!
20-10-31 16:45:29 INFO (MainThread) [supervisor.plugins.observer] Starting observer plugin
20-10-31 16:45:29 WARNING (MainThread) [supervisor.misc.tasks] Watchdog/Application found a problem with observer plugin!
20-10-31 16:45:29 ERROR (MainThread) [supervisor.utils] Can't execute stop while a task is in progress
20-10-31 16:45:29 INFO (MainThread) [supervisor.plugins.observer] Starting observer plugin
20-10-31 16:45:29 ERROR (MainThread) [supervisor.utils] Can't execute run while a task is in progress
20-10-31 16:45:29 INFO (SyncWorker_5) [supervisor.docker.interface] Cleaning hassio_observer application
20-10-31 16:46:01 ERROR (SyncWorker_5) [supervisor.docker] Can't start hassio_observer: 500 Server Error: Internal Server Error ("driver failed programming external connectivity on endpoint hassio_observer (f281907d93807bf6adc02db1857afba26bcea9ef859c8874f04e7fc13deb025b): Bind for 0.0.0.0:4357 failed: port is already allocated")
20-10-31 16:46:01 ERROR (MainThread) [supervisor.plugins.observer] Can't start observer plugin
20-10-31 16:46:01 ERROR (MainThread) [supervisor.misc.tasks] Observer watchdog reanimation failed!
20-10-31 16:47:01 WARNING (MainThread) [supervisor.misc.tasks] Watchdog/Docker found a problem with observer plugin!
20-10-31 16:47:01 INFO (MainThread) [supervisor.plugins.observer] Starting observer plugin
20-10-31 16:47:01 INFO (SyncWorker_5) [supervisor.docker.interface] Cleaning hassio_observer application
20-10-31 16:47:02 ERROR (SyncWorker_5) [supervisor.docker] Can't start hassio_observer: 500 Server Error: Internal Server Error ("driver failed programming external connectivity on endpoint hassio_observer (9dd92ac337f83ac48ebdd4c148ed802ae20beae506d03a653add24f85abd790a): Bind for 0.0.0.0:4357 failed: port is already allocated")
20-10-31 16:47:02 ERROR (MainThread) [supervisor.plugins.observer] Can't start observer plugin
20-10-31 16:47:02 ERROR (MainThread) [supervisor.misc.tasks] Observer watchdog reanimation failed!

If this is unrelated (you aren’t running ONVIF) I would recommend opening an issue on GitHub. The community forums are good for discussion, but devs don’t check here often.

I’m going to see if an update fixes it. If not, I will flag. There’s nothing in 0.117.0 and above that I require for now. The system is running perfectly stable for now.

Forgive my butting in here but I don’t know the cause, but I recognise the symptom. Some component has a memory leak… It is allocating memory and not releasing it.

So, ideally you need to check the memory consumption by process and see if you can isolate a specific process. You should definitely open a bug report on this though.

seeing it on xpenology as well in docker container

Yes, I enabled and disabled my add-ons one at a time to see if I could pinpoint. I rolled back several add-on’s. The only thing that stopped it was the last resort of rolling back from 0.117.0 back to 0.116.4, and that solved it. It’s something to do with 0.117.0.

Also, how can I monitor the memory by process? What procedure allows me to do that on the Raspberry Pi?

Same problem here…

I had the same when upgrading to 0.116.x, not fixed by 0.117.x

Does your CPU do the same?

I’ve decided to stick with 0.115.6 for now (the flat bit at the end of the graph).

Same problem. also rolled back to 116.4 than ram keeps round 5
upgrade to 117 and ram keeps climbing to 50 and counting.

Yes, there was a gradual increase in processor use too, but not as substantial as yours. It would usually sit at around 4% but it did rise in the same pattern.

There is a possible looping bug related to “ONVIF” in configs or add-ons. I don’t use ONVIF for cameras, however there is now a 0.117.2 release which fixes that bug.

I’m in the middle of updating to the 0.117.2 release now, and I’ll report back in a few hours if I see the same issues.

And I can confirm that’s a NEGATIVE fix by updating to 0.117.2, as you can see in the graph attached.

It’s only been running a few hours and it seems to be on the same path to mass memory use. I’ve added the “Holt Winters” projection method, and it also shows it’s predicting a similar path to massive memory usage over time.

Same here as you. (Siriusgen)

Another one here. Version 0.117.2 does not fix the issue for me.

FWIW, this morning at around 9:00 I upgraded from 0.116.4 to 0.117.2. Everything to left of the graph’s spike is 0.116.4 and to the right is 0.117.2.

It’s showing slightly less memory consumption (i.e. slightly higher free memory).

I suspect the reports of increasing memory consumption (i.e. a memory leak) might be due to one or more integrations.

It does seem that way. I have disabled all add-ons one by one to see if I can find the issue. With every add-on disabled, it’s still happening. Strange goings on, and I can’t figure it out at my end.

The issue is likely not with Addons, it’s with Integrations. Addons run in separate containers and have no direct impact on the Home Assistant service.

1 Like