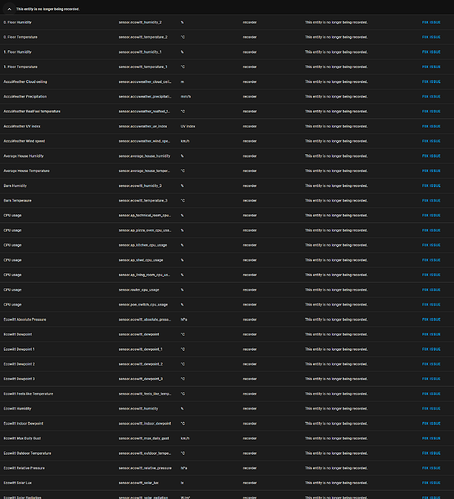
All entities are saying "No statistics found" & "This entity is no longer being recorded". What to do?

Since about 9 days ago no history of any entity is being recorded anymore.

No modification was done at this point 9 days ago, no update or anything. In fact since it is a holiday house, HA had been sitting pretty much unbothered since the new year, with just Alarmo and Reolink running as an alarm system and Ecowitt measuring the climate. It took me a few days to even notice, since I didn’t have a reason to check the instance. I have now (remotely) performed all updates available, but the problem persists.

This is what all enitites show up as, when I click on them. They all give a state value, that is being updated continuously and correctly, but no history of it is being recorded:

image

When clicking on “Show more” and ajusting the range accordingly I can see clearly when it stopped logging and just went flat-line:

Also when checking under developer → statistics it shows that all entities display the issue “This entity is no longer being recorded”

Clicking on “Fix Issue” shows me this:

image

As stated above, I have not made any changes to my HA prior to it stopping recording. Also there are no manual recorder settings in place (like e.g. exclusions) that I know of / can see in the config.yaml.

I have searched around the forum and people have had similar problems but usually only with isolated entities or integrations. In my case however its ALL of them, no matter if the source is internal (e.g. template sensor) or any of the intergrations (Shelly, Ecowitt, Accuweather, Tp-Link Omada, Reolink etc.). From all I can gather this might be a problem with the database, whoever I have no idea how to access / check that, let alone how to repair it.

Does anyone know how this could have happened and how I could fix it? Please bear with me as I have little to no experience with coding or databases. Unfortunately I cannot (easily) access the hardware (Raspberry 4), since the house is a 7 hours drive away.

Thank you all in advance!

Check Settings → System → Logs

Look for database recorder errors.

Thanks for the suggestion. There is a bunch of errors and warnings, but none of them seem to mention recorder. They don’t go back until 10 days ago however - maybe because I did the updates a couple of days ago and had to restart HA for that?

You’d see recorder errors continually if that was the issue.

Have you tried clearing your web browser cache?

Yes, tried that - but to no avail. The problem occurs across all devices I have tried (Laptop, Phone, Tablet) and in different browsers.

I don’t know what the snitun server is, but 12,667 errors logged is excessive. I would try disabling whatever that integration is, restart, and see if that resolves the recorder issues.

What database are you using for statistics (default SQLite or MariaDB)?

I have no idea either and no clue what integration that might be. It seems to be a nabucasa-server from from how the URL, bu maybe i’m wrong. There was an issue yesterday, where the HA lost connection to Nabucasa Cloud for a few hours, but then came back online. No idea why. But maybe that 12k errors is from repeatedly trying to connect during those hours…

I will clear the error log, restart and see if it still throws that error in the next couple of hours.

I’m using the standart HA image for Raspberry, so i guess i also have the default DB?

EDIT: Cleared the Log and did a full System reboot. So far no “SniTun”-server errors anymore. I think this was due to the connections problem yesterday - might just have been an internet outage.

How large is your database file config/home-assistant_v2.db ???
What Integrations do you have installed?

I found some threads about some integrations causing the recorder to stop logging, such as iCloud3. You could stop and disable all integrations and restart to see if it starts working, then re-enable them one at a time to isolate.

These are the database-files I see:

image

I have these integrations installed:

The Shelly Integration throws an error, since some devices are currently depowered. Thats normal and not the problem.

I will try disabling them to see if that fixes the problem. It is curious that the problem is not specific to enities of a specific integration and suddenly arose without any changes/updates being made.

The database size doesn’t look to be an issue. And it has the current date/time on it - as if it’s still being written to. Which makes it sound like an issue with Home Assistant being able to read the contents of the file.

Some things to try:

  1. a recorder.purge from Deverloper Tools - Actions.

  2. Shutdown Core (ha core stop) and then rename the home-assistant_v2.db to home-assistant_v2.db.old using the Samba Share Add-On to get to the \config folder.
    Then restart Core (ha core start) and let it create a new database file. If it starts recording you’ll know there’s something wrong with the original database file. You will lose all history if you can’t repair the original and rename it back after.

Thank you for the feedback & suggestions.

I did a recorder purge as per your instructions and restarted HA. Unfortunately that did not resolve the issue.

Two questions about you second suggestion:

  • Would I do this from the Developer Tools / Action page as well? Do I see correctly that the command would be homeassistant.stop and homeassistant.start?

  • Can I safely do this remotely without loosing connection to NabuCasa Cloud? I am not in the same LAN and have no way of physically acessing / restarting the Hardware at the moment. If this is not the case, I will have to wait until I am back at the holiday house, because I can’t risk HA going offline.

  • Do I need to install the mentioned Samba Add-On or can I use the regular File Editor for this?

Thank you for your help!

You can run that command from within the SSH & Web Terminal Add-On. Once you stop Core you lose all access to the Terminal as well as to the HA interface (including the File Editor and Nabu Casa), so you can’t restart it without physically power-cycling it.

You would first install and configure the Samba Share Add-On and make sure you can access the config folder from an external computer before stopping Core: the Samba shares are still accessible afterwards so you can rename the file.

If you don’t have physical access to the hardware I suggest using a power switch that can be accessed from the internet (Cloud) such as the Sonoff S31 WiFi or a Shelly Plug.

Edit: You could restart HA if it’s installed in a VM such as Proxmox from within the VM environment, assuming you have remote access to the VM server such as thru a VPN.

The Terminal application will continue to operate in its own container while HA is shut down. The Nabu Casa connection however will close.

So to do this remotely:

  1. Without stopping HA, rename (or move) your database file.
  2. Restart HA, either from the CLI or GUI.

A new database will be created when HA starts.

This is not the ideal way to do it but it will work.

To test this I ran ha core stop in the built-in Terminal window, and everything in the GUI stopped working, with no access to the built-in terminal window. So if the terminal app is still running you’d need to SSH into it to access? (I didn’t try that).

I also didn’t think that you could rename the _v2.db file if it was in-use. I didn’t try that either as I’m using MariaDB.

Do not stop HA. That will disconnect you from the ingress session.

Delete/move/rename without stopping then restart.

You can definitely delete the db when in use (I have seen this done a lot). So rename should also work.

1 Like

I’ve just been advised that you may not even need to restart. HA should create a new db if it notices the existing one go missing.

So I have renamed the database file, restarted HA and a new file has been created. All old history is gone, but that was to be expected.

Now clicking on a value opens up the graph with a flat line.

image

…and the value will start plotting while the window is open.

image

However when closing the window and reopening it, the graph will again start with a flat line and then start plotting again.

Going to Developer / Statistics the enitites no longer show “This entity is no longer being recorded” but instead say “This entity is excluded from being recorded”.

Clickin on Info renders this information:

image

This is interesting as it did at least change something - but unfortunately did not solve the problem.

Does this give any usable informations towards a possible diagnosis / solution?

EDIT: Is there any other place than the config.yaml where a recoder inclusion / exclusion could be specified? I did never actively do such a thing, but maybe I somehow at some point copied some code from this forum that contained something like this?

If you are 100% sure you have not excluded anything from the recorder then it is looking like an Ecowitt integration issue. Is this the only integration with the issue?

Ist not just Ecowitt. Absolutely all Enitites have that issue. (See the above screenshot for the full list.)

Not 100% sure about the excludes, since I rely on copying code from this forum and/or Ai to do stuff in HA, i’m not a coder myself. But from what I see, I wouldn’t know wehre an exclude could be defined. This is my config.yaml:

# Loads default set of integrations. Do not remove.
default_config:

# Load frontend themes from the themes folder
frontend:
  themes: !include_dir_merge_named themes

automation: !include automations.yaml
script: !include scripts.yaml
scene: !include scenes.yaml

homeassistant:
  packages: !include_dir_named packages

template:
  - sensor:
      - name: "Technical & Garden | Power"
        unique_id: technical_garden_power
        unit_of_measurement: W
        icon: mdi:lightning-bolt
        availability: >-
          {{ has_value('sensor.shellyproem50_08f9e0e5c190_em0_power') and
          has_value('sensor.shellyproem50_08f9e0e5c190_em1_power') }}
        state: >-
          {{ (states('sensor.shellyproem50_08f9e0e5c190_em0_power') | float(0) -
          states('sensor.shellyproem50_08f9e0e5c190_em1_power') | float(0) ) | round(1) }}

      - name: "Pellet heating status"
        unique_id: pellet_heating_status
        availability: "{{ has_value('sensor.filtered_heating_power') }}"
        state: >-
          {% set power = states('sensor.filtered_heating_power') | float(0) %} 
          {% if  power < 3 %}
            Off
          {% elif power < 20 %}
            Stand by
          {% elif power < 140 %}
            Circulating
          {% elif power < 270 %}
            Burning
          {% elif power > 270 %}
            Ignition
          {% endif %}

      - name: "Electric boiler status"
        unique_id: electric_boiler_status
        availability: >-
            {{ has_value('sensor.shellypro4pm_08f9e0e9ed64_switch_3_power') and
            has_value('switch.shellypro4pm_08f9e0e9ed64_switch_3') }}
        state: >-
            {{ 'off' if is_state('switch.shellypro4pm_08f9e0e9ed64_switch_3', 'off')
            else 'standby' if states('sensor.shellypro4pm_08f9e0e9ed64_switch_3_power')|int(0) < 20
            else 'heating' }}

      - name: "Wind Direction TXT"
        unique_id: wind_direction_txt
        availability: "{{ has_value('sensor.ecowitt_wind_direction') }}"
        state: >-
          {% set dir = states('sensor.ecowitt_wind_direction') | int(0)  %}
          {% set navDir = [ 'N', 'NNE', 'NE', 'ENE', 'E', 'ESE', 'SE', 'SSE', 'S', 'SSW', 'SW', 'WSW', 'W', 'WNW', 'NW', 'NNW', 'N' ] %}
          {{ navDir[ (dir/22.5) | int(0) ] }}

sensor:
  - platform: filter
    name: "filtered heating power"
    unique_id: filtered_heating_power
    entity_id: sensor.shellypro4pm_08f9e0e9ed64_switch_2_power
    filters:
      - filter: time_simple_moving_average
        window_size: "00:01"
        precision: 2

Unless there is something in your packages then no you do not have any excludes. This is very strange.