Thank you for your help!
type: custom:apexcharts-card
graph_span: 48h
update_interval: 60s
now:
  show: true
span:
  offset: +24h
apex_config:
  chart:
    height: 220px
  grid:
    show: false
  legend:
    show: false
  xaxis:
    axisBorder:
      show: false
    axisTicks:
      show: false
    spanGaps: false
experimental:
  color_threshold: true
header:
  show: true
  floating: false
  show_states: true
  colorize_states: true
series:
  - entity: sensor.datchik_temperatury_na_pervom_etazhe_temperature
    color: black
    opacity: 1
    stroke_width: 1
    extend_to: now
    name: Климат на первом этаже
    type: line
    show:
      in_chart: true
      header_color_threshold: true
      extremas: true
    yaxis_id: Temperature
    color_threshold:
      - value: -10
        color: rgb(224,123,222)
      - value: -5
        color: rgb(187, 116, 212)
      - value: 0
        color: rgb(116, 92, 219)
      - value: 5
        color: rgb(23, 210, 227)
      - value: 10
        color: rgb(0,215,144)
      - value: 15
        color: rgb(94,210,48)
      - value: 20
        color: rgb(255,255,101)
      - value: 25
        color: rgb(250,130,46)
      - value: 30
        color: rgb(180,35,17)
      - value: 35
        color: rgb(175,0,0)
  - entity: sensor.datchik_temperatury_na_pervom_etazhe_humidity
    color: white
    name: Влажность
    yaxis_id: Humidity
    show: null
    in_chart: false
    in_header: true
    extremas: false
yaxis:
  - id: Temperature
    opposite: true
    show: true
    align_to: 5
    decimals: 0
    apex_config:
      tickAmount: 5
  - id: Humidity
    show: false
Its the show: part that was wrong. Tested working:
  - entity: sensor.datchik_temperatury_na_pervom_etazhe_humidity
    color: white
    name: Влажность
    yaxis_id: Humidity
    show:
      in_chart: false
      in_header: true
      extremas: false
1 Like
It worked. Thank you very much!
jpettitt
October 19, 2023, 10:24pm
3158
You need to change
  yaxis_id:
      show:
        in_chart: false
        in_header: true
        extremas: false
to
yaxis_id:  Humidity
show:
   in_chart: false
   in_header: true
   extremas: false
and the yaxis block is indented 2 spaces too far.
1 Like
If I bet - in_chart: false
    yaxis_id: Humidity
    show:
      in_chart: false
      in_header: true
      extremas: false
When I change to - in_chart: true
    yaxis_id: Humidity
    show:
      in_chart: true
      in_header: true
      extremas: false
Very strangetrue to false , but I did not succeed.
baguett
October 20, 2023, 7:03am
3162
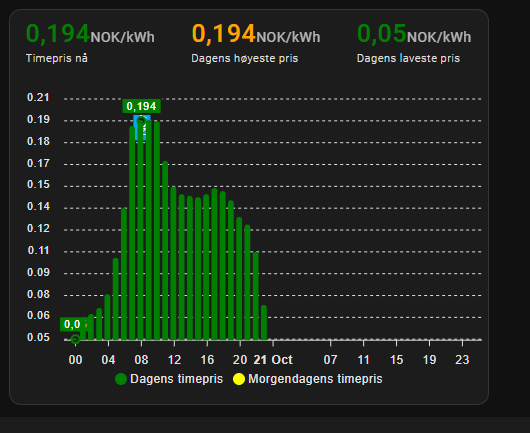
Hey guys, I have a weird “bug”, the now: label: text is not showing on top / in front of the column bars. any idea what might be causing this?
type: custom:apexcharts-card
now:
  show: true
  label: Now
graph_span: 48h
apex_config:
  annotations:
    position: back
    yaxis:
      - 'y': 0.1987
        strokeDashArray: 0
        borderColor: green
        borderWidth: 0
  chart:
    height: 320px
  legend:
    showForSingleSeries: true
  plotOptions:
    bar:
      borderRadius: 2
  yaxis:
    decimalsInFloat: 2
    tickAmount: 10
    forceNiceScale: true
  xaxis:
    labels:
      datetimeFormatter:
        hour: HH
all_series_config:
  show:
    offset_in_name: false
header:
  title: ' '
  show: true
  show_states: true
  colorize_states: true
span:
  start: day
  offset: +0h
series:
  - entity: sensor.nordpool_kwh_molde_nok_3_10_025
    type: column
    color: green
    float_precision: 4
    stroke_width: 2
    name: Dagens timepris
    show:
      in_header: false
      legend_value: false
      extremas: true
    data_generator: |
      return entity.attributes.raw_today.map((start, index) => {
        return [new Date(start["start"]).getTime(), entity.attributes.raw_today[index]["value"]];
      });
  - entity: sensor.nordpool_kwh_molde_nok_3_10_025
    type: column
    color: yellow
    float_precision: 4
    stroke_width: 2
    name: Morgendagens timepris
    show:
      in_header: false
      legend_value: false
      extremas: true
    data_generator: |
      return entity.attributes.raw_tomorrow.map((start, index) => {

        return [new Date(start["start"]).getTime(), entity.attributes.raw_tomorrow[index]["value"]];

      });
  - entity: sensor.nordpool_kwh_molde_nok_3_10_025
    name: Timepris nå
    color: green
    type: column
    show:
      in_chart: false
    float_precision: 4
  - entity: sensor.nordpool_kwh_molde_nok_3_10_025
    attribute: max
    type: column
    color: orange
    float_precision: 4
    stroke_width: 2
    name: Dagens høyeste pris
    group_by:
      duration: 2d
    show:
      in_chart: false
      legend_value: false
  - entity: sensor.nordpool_kwh_molde_nok_3_10_025
    attribute: min
    type: column
    color: green
    float_precision: 4
    stroke_width: 2
    name: Dagens laveste pris
    group_by:
      duration: 2d
    show:
      in_chart: false
      legend_value: false
WebPower
October 20, 2023, 3:32pm
3163
Hi,
I do it differently and it’s good for me.
type: custom:apexcharts-card
header:
  show: true
  show_states: true
  colorize_states: true
  title: Solar / day
graph_span: 7d1s
span:
  end: day
show:
  last_updated: false
apex_config:
  chart:
    type: area
    stacked: true
    height: 320
  stroke:
    show: true
    width: 1
    curve: smooth
  legend:
    show: true
  dataLabels:
    enabled: true
  xaxis:
    labels:
      format: dd-MMM
  fill:
    type: gradient
    gradient:
      shadeIntensity: 0.1
      opacityFrom: 0.25
      opacityTo: 1
      inverseColors: true
      start:
        - 0
        - 90
        - 100
cache: true
update_interval: 10min
series:
  - color: rgb(102,205,170)
    entity: sensor.sun2000_6ktl_daily_yield
    name: 6  kW Inv
    type: column
    group_by:
      func: max
      duration: 1d
    show:
      datalabels: true
  - color: rgb(216,191,216)
    entity: sensor.sun2000_10ktl_daily_yield
    name: 10 kW Inv
    type: column
    group_by:
      func: max
      duration: 1d
    show:
      datalabels: true
  - color: steelblue
    entity: sensor.napelem_total_current_day_energy
    name: Total kWh
    type: column
    group_by:
      func: max
      duration: 1d
    show:
      datalabels: true
1 Like
gdreelin
October 24, 2023, 6:44pm
3164
Love to see the config on this card… can you post it?
I am struggling with a flexible annotation.
My current code is not working:
apex_config:
  annotations:
    position: back
    yaxis:
      - 'y': ${[states[sensor.apexdischarge].state]}
        strokeDashArray: 5
        borderColor: red
        borderWidth: 2
Anybody got an idea ?
ameisenba3r
October 26, 2023, 6:36pm
3166
Here is my current code. I might have extra stuff as I’ve been trying to trouble shoot:
type: custom:apexcharts-card
experimental:
  color_threshold: true
chart_type: radialBar
graph_span: 6hr
header:
  show: true
  title: Allergy Index
  show_states: true
  colorize_states: true
all_series_config:
  show:
    in_header: true
series:
  - entity: sensor.allergy_index_forecasted_average
    name: Allergy Forcast
    min: 0
    max: 12
    color_threshold:
      - value: 0
        color: green
      - value: 21
        color: yellow
      - value: 41
        color: orange
      - value: 61
        color: red
      - value: 81
        color: purple
    show:
      legend_value: false
      header_color_threshold: true
      in_header: true
      name_in_header: false
apex_config:
  legend:
    show: false
  plotOptions:
    radialBar:
      dataLabels:
        enabled: false
Steve.Eggo
October 26, 2023, 7:19pm
3167
[SOLVED] How do I get past and future Agile rates to display?
type: custom:apexcharts-card
now:
  show: true
  label: Now
graph_span: 2d
apex_config:
  xaxis:
    labels:
      datetimeFormatter:
        hour: HH
header:
  show: true
  title: Agile Rates Past and Present
  show_states: true
  colorize_states: true
span:
  start: day
  offset: '+0d'
series:
  - entity: sensor.octopus_energy_electricity_xxx_xxx_current_rate
PskNorz
October 27, 2023, 8:38pm
3168
Hey,
Does anyone knows how can i reduce the space between header and graph?
Hi all
I am using ApexCharts with the apex_config: option to have more option to customize the chart.
type: custom:apexcharts-card
chart_type: radialBar
apex_config:
  .
  .
  .
  plotOptions:
    radialBar:
      .
      hollow:
        image: "Swich this URL due to sensor value" <--
series:
  - entity: sensor.my_sensor
Any idea or help is very welcome.
HVPereira
October 29, 2023, 4:00pm
3170
Did you managed to figure this one out?
Steve.Eggo
October 30, 2023, 7:31am
3171
Try changing the entity name: Allergy Forcast to name: " "
There is a lot of information here:
pcwii
October 31, 2023, 1:12am
3172
I am trying to create a graph of some sports stats and I would like the line graph to start at the start of the season and the end of the graph to be the current date so that I can see the season progress.
mstu01
October 31, 2023, 2:39pm
3173
Hey there,
I’m currently trying to achieve something like this in the ApexChart Card (red lines are the problem)
Basically adding red vertical lines on the lowest price ranges for the forecast. I need it to be dynamically, since i calculate how long i need to let a certain automation run, for example 3 hours - so i need the timeframe for the lowest 3 datapoints which are directly connected. I get this points via the EPEX Spot integration, now i only need to make these red lines.
My current card config:
type: custom:apexcharts-card
header:
  show: false
graph_span: 48h
span:
  start: day
now:
  show: true
  label: Now
color_list:
  - var(--primary-color)
series:
  - entity: sensor.epex_spot_data_net_price
    yaxis_id: uurprijs
    float_precision: 2
    type: line
    curve: stepline
    extend_to: false
    show:
      extremas: true
    data_generator: >
      return entity.attributes.data.map((entry, index) => { return [new
      Date(entry.start_time).getTime(), entry.price_ct_per_kwh]; }).slice(0,24);
    color_threshold:
      - value: 0
        color: '#186ddc'
      - value: 5
        color: '#04822e'
      - value: 10
        color: '#12A141'
      - value: 12
        color: '#79B92C'
      - value: 15
        color: '#C4D81D'
      - value: 20
        color: '#F3DC0C'
      - value: 25
        color: red
      - value: 30
        color: magenta
  - entity: sensor.epex_spot_data_net_price
    yaxis_id: uurprijs
    float_precision: 2
    type: line
    curve: stepline
    extend_to: end
    show:
      extremas: true
    data_generator: >
      return entity.attributes.data.map((entry, index) => { return [new
      Date(entry.start_time).getTime(), entry.price_ct_per_kwh];
      }).slice(23,47);
    color_threshold:
      - value: 0
        color: '#186ddc'
      - value: 10
        color: '#04822e'
      - value: 15
        color: '#12A141'
      - value: 20
        color: '#79B92C'
      - value: 25
        color: '#C4D81D'
      - value: 30
        color: '#F3DC0C'
      - value: 35
        color: red
      - value: 40
        color: magenta
  - entity: sensor.epex_spot_data_net_price
    yaxis_id: uurprijs
    color: green
    float_precision: 2
    type: area
    curve: stepline
    extend_to: false
    data_generator: >
      return entity.attributes.data.map((entry, index) => { return [new
      Date(entry.start_time).getTime(),
      entry.price_ct_per_kwh];}).slice(parseInt(hass.states['sensor.epex_start_low_period'].state.substring(0,2)),parseInt(hass.states['sensor.epex_start_low_period'].state.substring(0,2))+4);
experimental:
  color_threshold: true
yaxis:
  - id: uurprijs
    min: 0.1
    max: 50
    decimals: 2
    apex_config:
      title:
        text: ct/kWh
      tickAmount: 4
apex_config:
  legend:
    show: false
  tooltip:
    x:
      show: true
      format: HH:00 - HH:59
Do anyone can give me a hint?
ppmt
October 31, 2023, 11:01pm
3174
You need to use the data_generator…something like that.
series:
  - entity: sensor.electricity_xxxx_xxxx_current_rate
    data_generator: |
      return entity.attributes.all_rates.map((entry) => {
         return [new Date(entry.valid_from), entry.value_inc_vat];
       });
Here is my card for my rate. I use column rather than line
type: custom:apexcharts-card
experimental:
  color_threshold: true
header:
  show: true
  show_states: true
  colorize_states: true
  title: Today's Import Flux Rates
stacked: false
graph_span: 24h
span:
  start: day
now:
  show: true
  label: Now
  color: black
yaxis:
  - min: -10
    max: 40
    decimals: 1
series:
  - entity: sensor.electricity_xxxx_xxxx_current_rate
    type: column
    name: price
    color: gray
    opacity: 1
    stroke_width: 0
    unit: p/Kw
    show:
      in_header: false
      legend_value: false
      header_color_threshold: true
    color_threshold:
      - value: -100
        color: cyan
      - value: 0
        color: green
      - value: 20
        color: orange
      - value: 30
        color: red
    data_generator: |
      return entity.attributes.all_rates.map((entry) => {
         return [new Date(entry.valid_from), entry.value_inc_vat];
       });
Steve.Eggo
November 1, 2023, 6:27am
3175
Thanks Philippe, I have marked my question as solved.
1 Like
03397
November 1, 2023, 12:46pm
3176
Guys is there a way when I hover the mouse over the graph to make the date in the black backround not to be shown, since at the edges it is cropped?
`
entity: sensor.outside_temperature