Enphase Envoy - D7 firmware with JWT - A Different Approach

I have the same Enphase setup/configuration as @jon102034050 where the json output does not match yours.

My other sensors are templates based on the math from the available data:

  - sensor:
        name: Power Net
        state_class: measurement
        icon: mdi:home-lightning-bolt
        unit_of_measurement: W
        device_class: power
        state: >
          {{ states('sensor.power_production') | int(0) - states('sensor.power_consumption') | int(0) }}
          
  - sensor:
        name: Power Export
        state_class: measurement
        icon: mdi:transmission-tower-export
        unit_of_measurement: W
        device_class: power
        state: >
          {{ [0, states('sensor.power_production') | int(0) - states('sensor.power_consumption') | int(0) ] | max }}
          
  - sensor:
        name: Power Import
        state_class: measurement
        icon: mdi:transmission-tower-import
        unit_of_measurement: W
        device_class: power
        state: >
          {{ [0, states('sensor.power_consumption') | int(0) - states('sensor.power_production') | int(0) ] | max }}

  - sensor:
        name: Energy Net
        state_class: total
        icon: mdi:transmission-tower
        unit_of_measurement: kWh
        device_class: energy
        state: >
          {% set newValue = (states('sensor.energy_production') | float(0) - states('sensor.energy_consumption') | float(0)) | round(2) %}
          {% set lastValue = states('sensor.energy_net') | float(0) %}
          {% if newValue == 0 %}
            {{ lastValue }}
          {% else %}
            {{ newValue }}
          {% endif %}

My utility_meter sensors as seen from Dev Tools:

And lastly, my Enphase measurement type:

[
    {
        "eid": 12345,
        "state": "enabled",
        "measurementType": "production",
        "phaseMode": "split",
        "phaseCount": 2,
        "meteringStatus": "normal",
        "statusFlags": []
    },
    {
        "eid": 12345,
        "state": "enabled",
        "measurementType": "total-consumption",
        "phaseMode": "split",
        "phaseCount": 2,
        "meteringStatus": "normal",
        "statusFlags": []
    }
]

Regarding the utility_meter Daily sensor difference, the only thing I see that diverges is that I don’t have a tariff set… could that matter?

Maybe I’m interpreting the utility_meter incorrectly, but I thought we needed to have Daily sensors for the Energy Dashbaord to operate correctly. If that’s not the case, I’ll get rid of the utility_meter sensors and then point the Energy Dashboard right at the Enphase output sensors.

Edit:
As a test, I set my Energy Dashboard grid sensors to the Enphase rest sensors. Ill monitor it for the next few days.

In your original post, you were trying to search for daily import sensor but you have only provided screenshot of the attributes for your export sensors.

I compared your daily export sensor screenshot with mine and they are the same, so you should be able to choose it, unless you are already using it.

Example of mine already in use
image

Example of it not being available in the list due to it already being in use.
image

Wow this is so bizarre! I can now select Daily Export but cannot select Daily Import. When i look at the Daily Export sensor I see this:


However when I look at the Daily Import sensor I get no statistics found:

I’m wondering if something is messed up with just that sensor now. Also I’m wondering if these sensors need to run for over a day to populate or something before selection. The utility_meter docs haven’t turned up anything so far…

I appreciate your help digging into this!!

Ok, this is very interesting! There’s a warning in the log for that sensor:

Logger: homeassistant.components.sensor.recorder
Source: components/sensor/recorder.py:405
Integration: Sensor (documentation, issues)
First occurred: September 27, 2023 at 1:30:10 PM (1 occurrences)
Last logged: September 27, 2023 at 1:30:10 PM
`
The unit of sensor.daily_import (kWh) cannot be converted to the unit of previously compiled statistics (None). Generation of long term statistics will be suppressed unless the unit changes back to None or a compatible unit. Go to Link to Developer tools: statistics – My Home Assistant to fix this

Went into the Statistics tab and fixed the issue and now I was able to select Daily Import!

Woohoo!

Thanks again!

1 Like

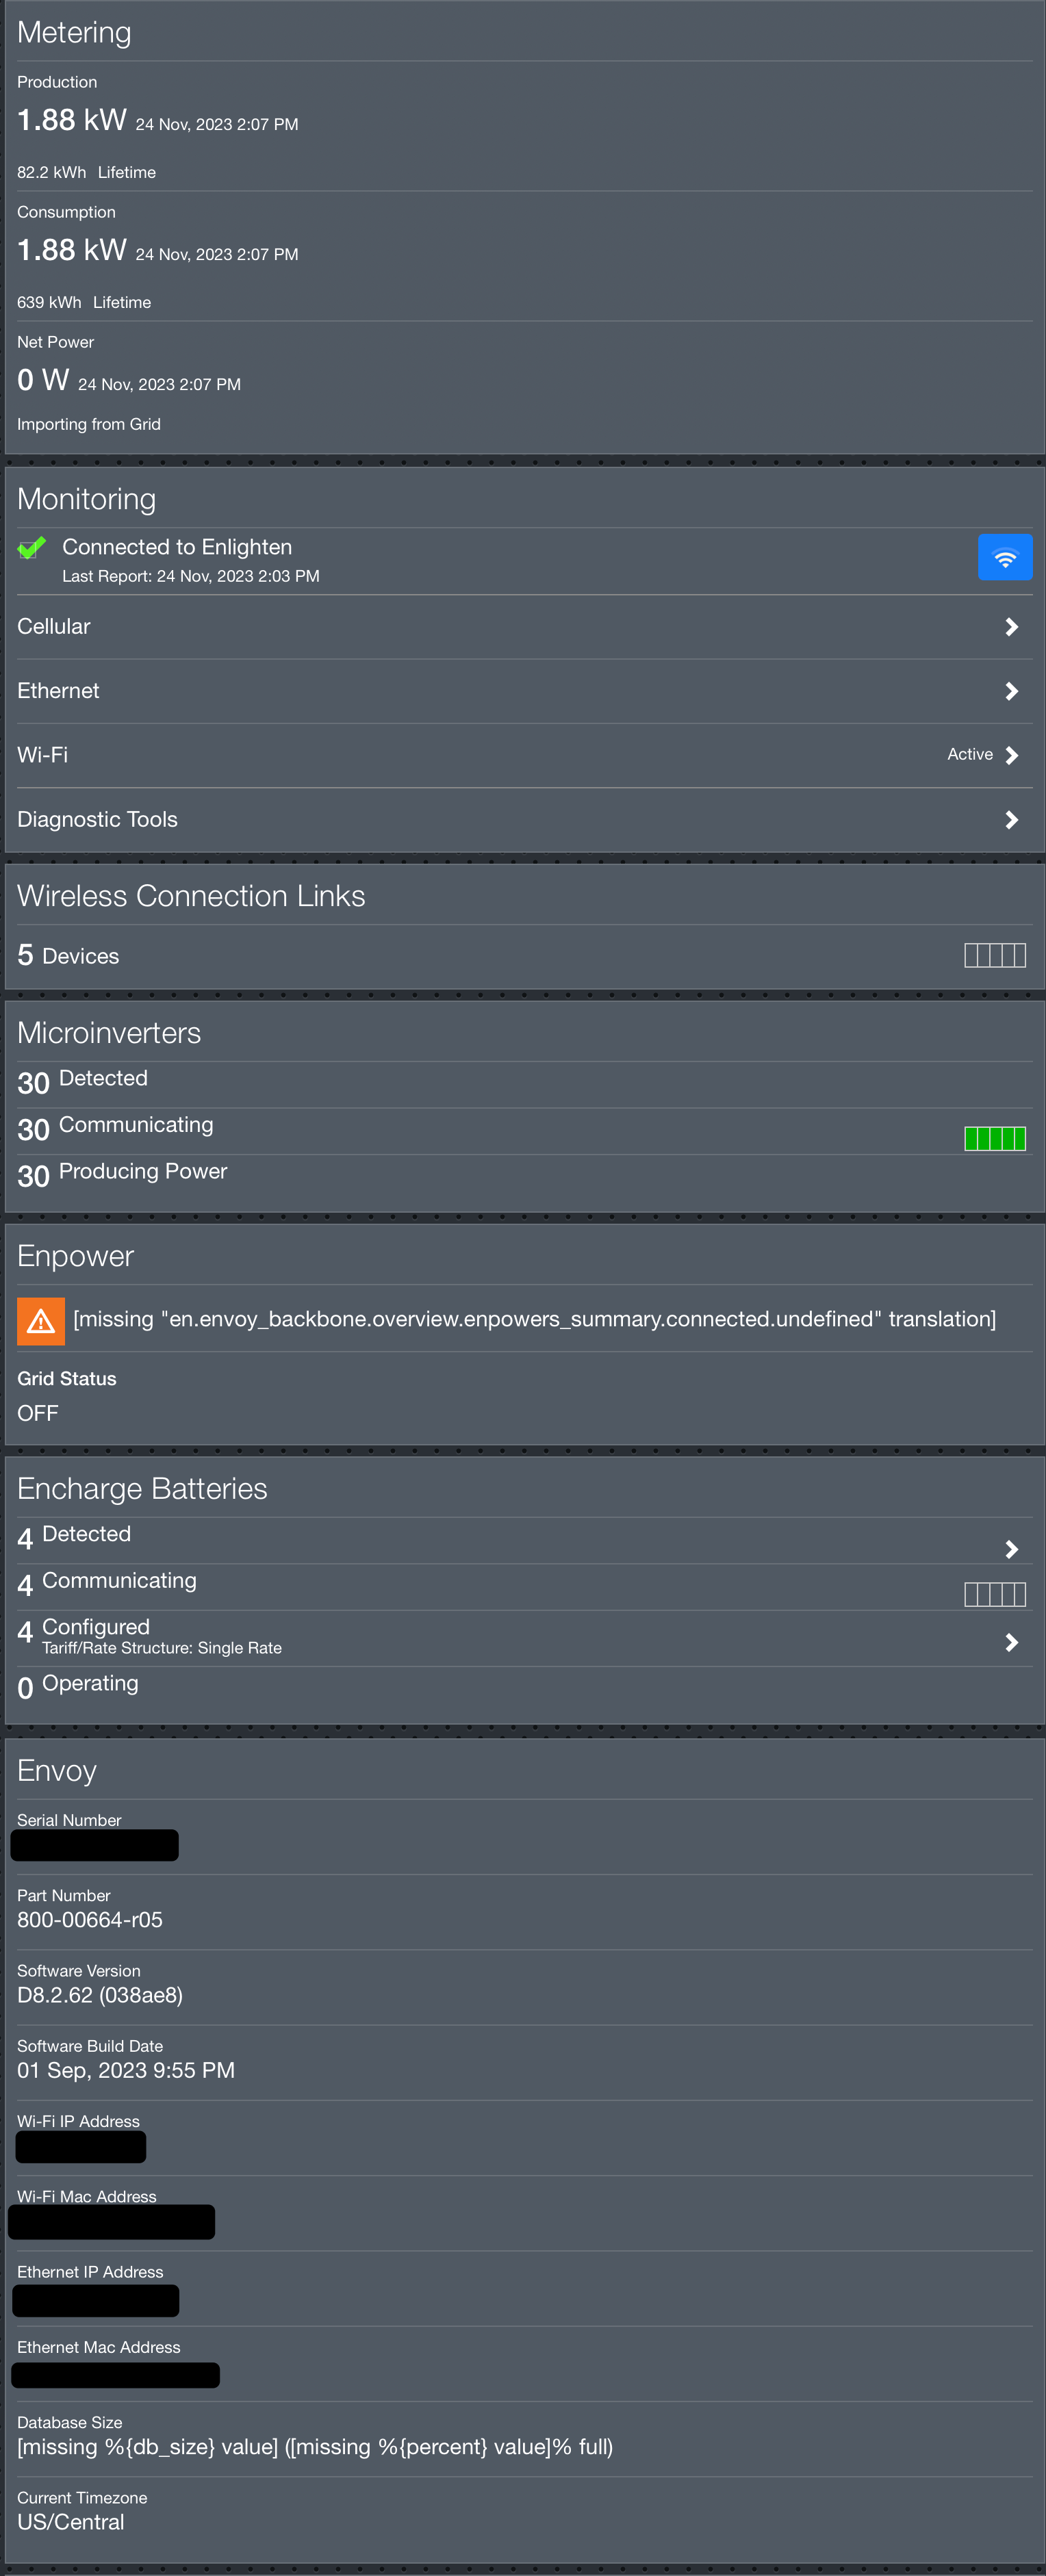
@del13r Just has a new system installed with firmware D8.2.62 (038ae8) Software Build Date 01 Sep, 2023 9:55 PM
The “missing” errors under Empower and Database Size are due to a bug Enphase has yet to address but the battery info can still be pulled.

I have 5P batteries installed and value_json[2] is populated.
For those who may have different configurations, the eid mappings are shown in /ivp/meters

[
    {
        "eid": 704643328,
        "state": "enabled",
        "measurementType": "production",
        "phaseMode": "split",
        "phaseCount": 2,
        "meteringStatus": "normal",
        "statusFlags": []
    },
    {
        "eid": 704643584,
        "state": "enabled",
        "measurementType": "net-consumption",
        "phaseMode": "split",
        "phaseCount": 2,
        "meteringStatus": "normal",
        "statusFlags": []
    },
    {
        "eid": 704643840,
        "state": "enabled",
        "measurementType": "storage",
        "phaseMode": "split",
        "phaseCount": 2,
        "meteringStatus": "normal",
        "statusFlags": []
    }
]

Here is /ivp/meters/readings with battery info populated in eid 704643840

[
    {
        "eid": 704643328,
        "timestamp": 1700857449,
        "actEnergyDlvd": 82736.068,
        "actEnergyRcvd": 2.614,
        "apparentEnergy": 97470.318,
        "reactEnergyLagg": 4210.015,
        "reactEnergyLead": 15671.590,
        "instantaneousDemand": 2164.922,
        "activePower": 2164.922,
        "apparentPower": 2229.759,
        "reactivePower": -284.589,
        "pwrFactor": 0.975,
        "voltage": 239.963,
        "current": 18.682,
        "freq": 60.000,
        "channels": [
            {
                "eid": 1778385169,
                "timestamp": 1700857449,
                "actEnergyDlvd": 41272.982,
                "actEnergyRcvd": 1.313,
                "apparentEnergy": 46525.753,
                "reactEnergyLagg": 2106.283,
                "reactEnergyLead": 7826.206,
                "instantaneousDemand": 1080.397,
                "activePower": 1080.397,
                "apparentPower": 1112.873,
                "reactivePower": -142.410,
                "pwrFactor": 0.975,
                "voltage": 119.826,
                "current": 9.336,
                "freq": 60.000
            },
            {
                "eid": 1778385170,
                "timestamp": 1700857449,
                "actEnergyDlvd": 41463.085,
                "actEnergyRcvd": 1.300,
                "apparentEnergy": 50944.564,
                "reactEnergyLagg": 2103.732,
                "reactEnergyLead": 7845.384,
                "instantaneousDemand": 1084.525,
                "activePower": 1084.525,
                "apparentPower": 1116.886,
                "reactivePower": -142.180,
                "pwrFactor": 0.976,
                "voltage": 120.137,
                "current": 9.346,
                "freq": 60.000
            },
            {
                "eid": 1778385171,
                "timestamp": 1700857449,
                "actEnergyDlvd": 0.000,
                "actEnergyRcvd": 0.000,
                "apparentEnergy": 0.000,
                "reactEnergyLagg": 0.000,
                "reactEnergyLead": 0.000,
                "instantaneousDemand": 0.000,
                "activePower": 0.000,
                "apparentPower": 0.000,
                "reactivePower": 0.000,
                "pwrFactor": 0.000,
                "voltage": 0.000,
                "current": 0.000,
                "freq": 60.000
            }
        ]
    },
    {
        "eid": 704643584,
        "timestamp": 1700857449,
        "actEnergyDlvd": 559233.892,
        "actEnergyRcvd": 2176.785,
        "apparentEnergy": 794781.171,
        "reactEnergyLagg": 1485.158,
        "reactEnergyLead": 417759.175,
        "instantaneousDemand": -0.000,
        "activePower": -0.000,
        "apparentPower": 36.944,
        "reactivePower": -0.000,
        "pwrFactor": 0.000,
        "voltage": 239.855,
        "current": 0.309,
        "freq": 60.000,
        "channels": [
            {
                "eid": 1778385425,
                "timestamp": 1700857449,
                "actEnergyDlvd": 367925.502,
                "actEnergyRcvd": 12.311,
                "apparentEnergy": 458851.816,
                "reactEnergyLagg": 979.297,
                "reactEnergyLead": 197700.103,
                "instantaneousDemand": -0.000,
                "activePower": -0.000,
                "apparentPower": 20.260,
                "reactivePower": -0.000,
                "pwrFactor": 0.000,
                "voltage": 119.753,
                "current": 0.169,
                "freq": 60.000
            },
            {
                "eid": 1778385426,
                "timestamp": 1700857449,
                "actEnergyDlvd": 191308.390,
                "actEnergyRcvd": 2164.474,
                "apparentEnergy": 335929.355,
                "reactEnergyLagg": 505.861,
                "reactEnergyLead": 220059.072,
                "instantaneousDemand": -0.000,
                "activePower": -0.000,
                "apparentPower": 16.683,
                "reactivePower": 0.000,
                "pwrFactor": 0.000,
                "voltage": 120.102,
                "current": 0.139,
                "freq": 60.000
            },
            {
                "eid": 1778385427,
                "timestamp": 1700857449,
                "actEnergyDlvd": 25812.023,
                "actEnergyRcvd": 50059.863,
                "apparentEnergy": 263354.661,
                "reactEnergyLagg": 189461.385,
                "reactEnergyLead": 2800.824,
                "instantaneousDemand": -83.678,
                "activePower": -83.678,
                "apparentPower": 162.507,
                "reactivePower": 49.642,
                "pwrFactor": -0.455,
                "voltage": 120.141,
                "current": 1.359,
                "freq": 60.000
            }
        ]
    },
    {
        "eid": 704643840,
        "timestamp": 1700857449,
        "actEnergyDlvd": 51534.401,
        "actEnergyRcvd": 99971.059,
        "apparentEnergy": 525855.490,
        "reactEnergyLagg": 378311.188,
        "reactEnergyLead": 5592.162,
        "instantaneousDemand": -405.640,
        "activePower": -405.640,
        "apparentPower": 232.107,
        "reactivePower": 116.772,
        "pwrFactor": -0.170,
        "voltage": 239.894,
        "current": 1.528,
        "freq": 60.000,
        "channels": [
            {
                "eid": 1778385681,
                "timestamp": 1700857449,
                "actEnergyDlvd": 25722.378,
                "actEnergyRcvd": 49911.197,
                "apparentEnergy": 262500.828,
                "reactEnergyLagg": 188849.803,
                "reactEnergyLead": 2791.338,
                "instantaneousDemand": -321.962,
                "activePower": -321.962,
                "apparentPower": 69.600,
                "reactivePower": 67.130,
                "pwrFactor": 0.000,
                "voltage": 119.753,
                "current": 0.169,
                "freq": 60.000
            },
            {
                "eid": 1778385682,
                "timestamp": 1700857449,
                "actEnergyDlvd": 25812.023,
                "actEnergyRcvd": 50059.863,
                "apparentEnergy": 263354.661,
                "reactEnergyLagg": 189461.385,
                "reactEnergyLead": 2800.824,
                "instantaneousDemand": -83.678,
                "activePower": -83.678,
                "apparentPower": 162.507,
                "reactivePower": 49.642,
                "pwrFactor": -0.455,
                "voltage": 120.141,
                "current": 1.359,
                "freq": 60.000
            },
            {
                "eid": 1778385683,
                "timestamp": 1700857449,
                "actEnergyDlvd": 0.000,
                "actEnergyRcvd": 0.000,
                "apparentEnergy": 0.000,
                "reactEnergyLagg": 0.000,
                "reactEnergyLead": 0.000,
                "instantaneousDemand": 0.000,
                "activePower": 0.000,
                "apparentPower": 0.000,
                "reactivePower": 0.000,
                "pwrFactor": 0.000,
                "voltage": 0.000,
                "current": 0.000,
                "freq": 0.000
            }
        ]
    }
]

If anyone would like to see any endpoint output from D8.2.62 (038ae8) let me know and I’ll post.

1 Like

Great work del13r!
In your list of envoy D7-integrations I think I found one that you missed:

Unfortunately this one did not work for me for some reason.
I got the integration from briancmpbll working now.

I just got my solar installation installed last week so I’m new to all this (and new to homeassistant too). There is an overwheliming amount of reading to do for me and it is hard to decide which (HACS-)integration is best at this moment.
One of the most important features I’m looking for is being able to shit down solar production if energy prices are negative. Can anybody advise on that?

Hi @guido1,

Thanks for letting me know about that HACS integration.

I assume that integration didnt work for you because you may not have an “installer” token.
To do what you are wanting to do like shut down solar production, either yourself via the GUI, OR the integration via home assistant, absolutely need an installer token to be able to access that setting.

How I have been able to get a temporary 12 hour installer token:
Go to https://entrez.enphaseenergy.com/login
and enter in your email and password.

Then you should get 2 options.

image

“For commissioned gateway” in my experience, provides me a 12 hour installer token which is associated with both my email address and my system serial number.

image

“For uncommissioned gateways” in my experience, provides me a 12 hour installer token which is only associated with my email address and the serial number is “un-commissioned”.

image

Hint: I use https://jwt.io/ to decode the token and see this information.

Note: The Home Assistant integrations most likely uses a different method which is automated. For example, when I use https://enlighten.enphaseenergy.com/entrez-auth-token?serial_num=MYSERIALNUMBER , I instead get a 12 month owner token.
More than likely, this is why the integration is unable to turn on and off production for you.

image

As an example, here are the manual steps to get to that power production setting once you have an installer token:

Go to
https://envoy.local/home

which always starts off cold with

Then there are 2 Authentication options,

  • Login with Enphase
  • Token Authentication

“Login with Enphase” in my experience, provides me the same 12 hour installer token.

If you wish to verify and decode yours, you can press f12 on chrome for example, tick preserve log, press “login with enphase”, and then find check_jwt in the list on the left and then you can see the token for yourself and then decode that token to see what type is in use for this session after the word Bearer

Decoded
image

The other option is to paste in a 12 month owner token and press submit, however given you want to disable power production, you will not be able to do that with a 12 month owner token.

scroll down to the very bottom and choose “Installer Login”
image
If your token from Enphase is an installer token, you will see this button towards the bottom of the page.


If you can’t get to that switch with your token, then neither can an integration do that on your behalf.

As for the obligatory question of “How can I get a 12 month installer token?”, my guess is that this is a conversation you need to have with Enphase sales/support.

1 Like

Thank you very much for your clear answer!
Now I finally understand why shine may say that it is possible, while it practically is not.
My installer is willing to provide me with an installer token, but I understand from your answer that it will not help me since it will be associated with his email and paswoord, not mine.
It’s a pity. It means I have to shut it down with another relais, that I can control from HA. (Any suggestions are welcome)
Or maybe the enphase relais has a wired input for controlling it?

1 Like

In that case, you can try paste the token into the gui and turn it on and off yourself.

It can’t hurt to call the manufacturer and ask for this feature. Perhaps they have a better solution that I’m not aware of.

@del13r Hi. I’m using this amazing post to add cost tracking to HA. While I used to have an Envoy (and used your previous solution to integrate that with the Energy dashboard) I don’t since I moved. I do plan to install solar fairly soon though. In the meantime, I’m using the energy readings from the Myenergi Zappi EV charger, which provides all I need for now. I wonder if you could clear up something for me though. You have the following template sensor:

# Australian Ausgrid NSW Peak-shoulder-offpeak sensor defined
  # https://www.ausgrid.com.au/Your-energy-use/Meters/Time-of-use-pricing
  # Peak: 2pm - 8pm on working weekdays 1 November - 31 March;
  # Peak: 5pm - 9pm on working weekdays 1 June - 31 August
  # Off-peak: 10pm - 7am
  # Shoulder: all other times
  - sensor:
      name: TOU Period
      icon: mdi:clock-time-three-outline
      state: >
        {% set tou_period = 'shoulder' %}
        {% set n_month = now().month %}
        {% set n_hour = now().hour %}
        {% set is_summer = (n_month <= 3 or n_month >= 11) %}
        {% set is_winter = (6 <= n_month <= 8 ) %}
        {% if n_hour >= 22 or n_hour < 7 %}
          {% set tou_period = 'offpeak' %}
        {% elif ((is_summer and (14 <= n_hour <= 19))
           or (is_winter and (17 <= n_hour <= 20)))
           and (is_state("binary_sensor.workday_sensor", "on")) %}
          {% set tou_period = 'peak' %}
        {% endif %}
        {{tou_period}}

Can you help me understand exactly when this sensor will be updated? That is, what trigger will make it update? Just showing my lack of HA knowledge here I think. If I plug it into Developer Tools, it says it listens for a change in state of the workday sensor, which wouldn’t be sufficient to keep the sensor up to date. Thank you!

The if statement is in the body of a sensor. Sensors are constantly evaluated by home assistant for any changes.
In my experience, if anything changes to the state of any of the elements in the if statement, its updated immediately.

The reason why I prefer the if statement is that if there was an outage for example, and home assistant was down or being restarted at the same time as the 7am changeover from offpeak to shoulder, the if statement would evaluate this as soon as home assistant is back up where as an automation meant to run at 7am would have not run.
The chance of the wrong tariff being recorded is higher if relying on an automation to run at a certain time.

In the case of this if statement, it is mainly monitoring the hour of the day, month of the year, and the workday sensor. Any time one of those elements changes, the if statement immediately catches it.

Proof of how accurate the if statement is:

Thanks for taking the time to explain that. I have the following sensor:

        {% set n_month = now().month %}
        {% set n_hour = now().hour %}
        {% if now().weekday() in (5,6) and n_hour > 11 and n_hour < 14 %}
          {% set tou_period = 'Free' %}
        {% else %}
          {% set tou_period = 'Shoulder' %}
          {% set is_summer = (n_month <= 3 or n_month >= 11) %}
          {% set is_winter = (6 <= n_month <= 8 ) %}
          {% if n_hour >= 22 or n_hour < 7 %}
            {% set tou_period = 'Offpeak' %}
          {% elif ((is_summer and (14 <= n_hour <= 19))
            or (is_winter and (14 <= n_hour <= 19)))
            and (is_state("binary_sensor.workday_sensor", "on")) %}
            {% set tou_period = 'Peak' %}
          {% endif %}
        {% endif %}
        {{tou_period}}

I get two free hours of electricity on Saturdays amd Sundays courtesy of Red Energy’s EV Plan, hence the extra logic. I don’t have seasonal prices, but left your logic in there in case I ever do (but I changed the TOU period to be the same for summer and winter).

When I plug this into Developer Tools, it says the sensor updates every minute. That’s OK I guess, but I thought to do this (inside my templates.yaml file):

- trigger:
    - platform: time_pattern
      minutes: 0
    # update every hour on the hour
    - platform: homeassistant
      event: start
  sensor:
    # Australian Ausgrid NSW Peak-shoulder-offpeak sensor defined
    # https://www.ausgrid.com.au/Your-energy-use/Meters/Time-of-use-pricing
    # Peak: 2pm - 8pm on working weekdays 1 November - 31 March;
    # Peak: 5pm - 9pm on working weekdays 1 June - 31 August
    # Off-peak: 10pm - 7am
    # Shoulder: all other times
    - name: TOU Period
      icon: mdi:clock-time-three-outline
      state: >
        {% set n_month = now().month %}
        {% set n_hour = now().hour %}
        {% if now().weekday() in (5,6) and n_hour > 11 and n_hour < 14 %}
          {% set tou_period = 'Free' %}
        {% else %}
          {% set tou_period = 'Shoulder' %}
          {% set is_summer = (n_month <= 3 or n_month >= 11) %}
          {% set is_winter = (6 <= n_month <= 8 ) %}
          {% if n_hour >= 22 or n_hour < 7 %}
            {% set tou_period = 'Offpeak' %}
          {% elif ((is_summer and (14 <= n_hour <= 19))
            or (is_winter and (14 <= n_hour <= 19)))
            and (is_state("binary_sensor.workday_sensor", "on")) %}
            {% set tou_period = 'Peak' %}
          {% endif %}
        {% endif %}
        {{tou_period}}

    - name: "Electricity Tariff"
      state: >-
        {% if is_state('sensor.tou_period', 'Free') %}
          0
        {% else %}
          {% if is_state('sensor.tou_period', 'Peak') %}
            .484
          {% elif is_state('sensor.tou_period', 'Shoulder') %}
            .33
          {% else %}
            .22
          {% endif %}
        {% endif %}
      unique_id: electricity_tariff
      unit_of_measurement: AUD/kWh

I think this means the TOU and tariff sensors only update on the hour, and on HA startup. Reckon this is right? I didn’t bother setting up input_numbers for the tariff, and just coded the tariffs directly in the sensor. Do I need to do anything else in there, or is just coding the numbers directly like that sufficient (maybe with regard to it being a float or something)?

I’m not sure if you still use 3 automations to change the tariff, but I’m using a single one to update my two Utility Meters, like this:

alias: Tariff Utility Meters Update
description: ""
trigger:
  - platform: state
    entity_id:
      - sensor.tou_period
condition: []
action:
  - service: select.select_option
    data:
      option: "{{ states ('sensor.tou_period') }}"
    target:
      entity_id:
        - select.daily_import
  - service: select.select_option
    data:
      option: "{{ states ('sensor.tou_period') }}"
    target:
      entity_id:
        - select.monthly_import
mode: single

Just a bit simpler! Thanks again for your invaluable help…

so tried implementing this code…
I have the selector at the bottom and I can also display apexcharts as you did in a previous post, but I’m getting an error with this post…

That statement only applies to the developer tools page. This does not apply to sensors or if statements which are instantly updated as soon as a state changes.

@del13r
I was previously using the Enphase DEV integretion… definitely like this one for the local resources (quicker)

one thing I see different is this sensor missing.
wondering where in the API this could be found to create it.

image

Total overkill.
In my experience, the if statement works flawlessly without it.

Here is my current setup for the enphase style view.

Setup the helpers in configuration.yaml

input_select:
  statistics_chart_range:
    initial: day
    options:
      - day
      - week
      - month
      - year

input_datetime:
  statistics_chart_date:
    has_date: true
    has_time: false

Verified they were setup
image

Then setup the template sensors in configuration.yaml

template:

  - sensor:
      - name: statistics_chart_grouping
        unique_id: statistics_chart_grouping
        state: |
          {% set grouping={
            'day':'h',
            'week':'d',
            'month':'d',
            'year':'d'}
          %}
          {% set range = states('input_select.statistics_chart_range') %}
          {{ grouping[range] }}
      - name: statistics_chart_span
        unique_id: statistics_chart_span
        state: |
          {% macro last_date_in_range(date_str,range) -%}
            {% set date=as_timestamp(date_str)|timestamp_local()|as_datetime() -%}
            {% if range=='day' -%}
              {% set end_date=date -%}
            {% elif range=='week' -%}
              {% set end_date=date + timedelta(days=(6-date.weekday())) -%}
            {% elif range=='month' -%}
              {% set month=(date.month % 12) + 1 -%}
              {% set year=date.year+iif(date.month==12,1,0) -%}
              {% set end_date=strptime(year|string + '-' + month|string + '-01', '%Y-%m-%d')-timedelta(days=1) -%}
            {% elif range=='year' -%}
              {% set end_date=strptime(date.year|string + '-12-31', '%Y-%m-%d') -%}
            {% endif -%}
            {{ as_timestamp(end_date)|timestamp_local() -}}
          {% endmacro -%}
          {% set range = states('input_select.statistics_chart_range') %}
          {% set date_str = states('input_datetime.statistics_chart_date') %}
          {% set spans={
            'day':'24',
            'week':'7',
            'month':(last_date_in_range (strptime(date_str, '%Y-%m-%d'),range)|as_datetime()).day,
            'year':last_date_in_range (strptime(date_str, '%Y-%m-%d'),range)|as_timestamp(0)|timestamp_custom('%j',0)|int +1}
          %}
          {{ spans[range] }}
      - name: statistics_chart_period
        unique_id: statistics_chart_period
        state: |
          {% set periods={
            'day':'hour',
            'week':'day',
            'month':'day',
            'year':'day'}
          %}
          {% set range = states('input_select.statistics_chart_range') %}
          {{ periods[range] }}
          
  - sensor:
      - name: statistics_chart_offset
        unique_id: statistics_chart_offset
        state: |
          {% macro last_date_in_range(date_str,range) -%}
            {% set date=as_timestamp(date_str)|timestamp_local()|as_datetime() -%}
            {% if range=='day' -%}
              {% set end_date = date + timedelta(days=1) -%}
            {% elif range=='week' -%}
              {% set end_date=date + timedelta(days=(6-date.weekday())) -%}
            {% elif range=='month' -%}
              {% set month=(date.month % 12) + 1 -%}
              {% set year=date.year+iif(date.month==12,1,0) -%}
              {% set end_date=strptime(year|string + '-' + month|string + '-01', '%Y-%m-%d')-timedelta(days=1) -%}
            {% elif range=='year' -%}
              {% set end_date=strptime(date.year|string + '-12-31', '%Y-%m-%d') -%}
            {% endif -%}
            {{ as_timestamp(end_date) -}}
          {% endmacro -%}
          {% set range = states('input_select.statistics_chart_range') %}
          {% set date_str = states('input_datetime.statistics_chart_date') %}
          {% set offset = last_date_in_range(strptime(date_str, '%Y-%m-%d'),range)|int - now()|as_timestamp(0) -%}
          {% if states('sensor.statistics_chart_grouping') == 'h' %}
            {% set offset=(offset/60/60)|round(method='ceil') %}
          {% else %}
            {% set offset=(offset/60/60/24)|round(method='ceil') + 1 %}
          {% endif %}
          {{ iif(offset >= 0,'+','') }}{{ offset }}{{ states('sensor.statistics_chart_grouping') }}

Verified they were setup
image

Then added this to scripts.yaml

statistics_chart_date_browse:
  alias: statistics_chart_date_browse
  sequence:
  - service: input_datetime.set_datetime
    target:
      entity_id: input_datetime.statistics_chart_date
    data:
      datetime: "{% set range = states('input_select.statistics_chart_range') %}\n{%
        set date = states('input_datetime.statistics_chart_date')|as_datetime %}\n{%
        set direction = direction %}\n{% if range == 'day' %}\n  {% if direction >
        0 %}\n    {% set target = date + timedelta(days=1) %}\n  {% else %}\n    {%
        set target = date - timedelta(days=1) %}\n  {% endif %}\n{% elif range ==
        'week' -%}\n  {% if direction > 0 %}\n    {% set target = date + timedelta(days=7)
        %}\n  {% else %}\n    {% set target = date - timedelta(days=7) %}\n  {% endif
        %}\n{% elif range == 'month' -%}\n  {% if direction > 0 %}\n    {% set month=((date.month)
        % 12) + 1 %}\n    {% set year=date.year+iif(date.month==12,1,0) %}\n    {%
        set target=strptime(year|string + '-' + month|string + '-01', '%Y-%m-%d')
        -%}\n  {% else %}\n    {% set month=((date.month - 2) % 12) + 1 %}\n    {%
        set year=date.year+iif(date.month==1,-1,0) %}\n    {% set target=strptime(year|string
        + '-' + month|string + '-01', '%Y-%m-%d') -%}\n  {% endif %}\n{% elif range=='year'
        -%}\n  {% if direction > 0 %}\n    {% set target=strptime((date.year|int +
        1)|string + '-01-01', '%Y-%m-%d') -%}\n  {% else %}\n    {% set target=strptime((date.year|int
        - 1)|string + '-01-01', '%Y-%m-%d') -%}\n  {% endif %}\n{% endif -%}\n{% if
        direction == 0 %}\n    {% set target = now() %}\n{% endif -%}\n{{ target }}\n"
  mode: single
  icon: mdi:arrow-right-bold-outline

Verified that was setup

I made an extra automation to rollover the graph to todays date at 12:01AM

alias: Update day of apexchart at midnight
description: ""
trigger:
  - platform: time
    at: "00:01:00"
condition: []
action:
  - service: script.statistics_chart_date_browse
    data:
      direction: 0
mode: single

Then created a dashboard view

  - theme: Backend-selected
    title: Enphase
    path: enphase
    icon: mdi:solar-power
    type: sidebar
    badges: []
    cards:
      - type: custom:config-template-card
        variables:
          offset: states['sensor.statistics_chart_offset'].state
          span: states['sensor.statistics_chart_span'].state
          period: states['sensor.statistics_chart_period'].state
          grouping: states['sensor.statistics_chart_grouping'].state
        entities:
          - sensor.statistics_chart_offset
          - sensor.statistics_chart_span
          - sensor.statistics_chart_period
          - sensor.statistics_chart_grouping
        card:
          type: custom:apexcharts-card
          graph_span: 1d
          span:
            offset: ${offset}
          stacked: true
          header:
            show: false
            title: Total Power
          series:
            - entity: sensor.power_production
              type: column
              name: Produced
              color: '#01B4DE'
              group_by:
                func: avg
                duration: 5min
            - entity: sensor.power_consumption
              transform: return x *-1 ;
              type: column
              name: Consumed
              color: '#F37320'
              group_by:
                func: avg
                duration: 5min
            - entity: sensor.power_net
              type: column
              name: Imported(+)/Exported(-)
              color: '#545456'
              group_by:
                func: avg
                duration: 5min
          yaxis:
            - min: -7000
              max: 7000
              decimals: 0
      - type: custom:mod-card
        card:
          type: horizontal-stack
          cards:
            - type: entities
              entities:
                - entity: input_datetime.statistics_chart_date
                  name: date
            - type: glance
              show_name: false
              show_state: false
              entities:
                - entity: script.statistics_chart_date_browse
                  icon: mdi:chevron-left
                  tap_action:
                    action: call-service
                    service: script.statistics_chart_date_browse
                    data:
                      direction: -1
                - entity: script.statistics_chart_date_browse
                  icon: mdi:calendar-today
                  tap_action:
                    action: call-service
                    service: script.statistics_chart_date_browse
                    data:
                      direction: 0
                - entity: script.statistics_chart_date_browse
                  icon: mdi:chevron-right
                  tap_action:
                    action: call-service
                    service: script.statistics_chart_date_browse
                    data:
                      direction: 1

Verified that was good

Alternatively, if all of this is too complex, you can just have a simple card that just shows the last 24 hours using some of my older original instructions here.
https://community.home-assistant.io/t/enphase-envoy-with-energy-dashboard/328668/618?u=del13r

Hi @fireheadman,Which specific DEV integration are you referring to?
There are many to choose from:

briancmpbll/home_assistant_custom_envoy
posixx/home_assistant_custom_envoy (archived on Jul 14, 2023)
jrutski/home_assistant_envoy_d7_fw
DanBeard/enphase_envoy
jesserizzo/envoy_reader
vincentwolsink/home_assistant_enphase_envoy_installer

Unfortunately they are all referred to as DEV, so i need more specifics so I can try look at the code and work out what the source of binary_sensor.grid_status is.