I’m trying to diagnose recurring swap saturation on a Raspberry Pi 4 running Home Assistant OS from SSD. This is an install that has been stable for years, prior to this.
Environment:
Home Assistant Core: currently 2026.5.1
Issue also occurred on 2026.4.x before the 2026.5 upgrade
Home Assistant OS: 17.3
Supervisor: 2026.05.0
Hardware: Raspberry Pi 4, 4 GB RAM, SSD boot
Swap: /mnt/data/swapfile, ~1.25 GB
Network: wired Ethernet
Problem summary:
Swap pressure has become severe and recurring. RAM does not hit 100%, but swap repeatedly spikes to or near 100%. During the worst spikes, the host briefly becomes unreachable from an external watchdog by ping, HA API, and SSH. The host can also become so unresponsive that a hard reboot can be necessary.
I have HA automations in place for mitigation:
Warning automation when swap stays above 75% for 10 minutes.
Critical automation that sends a notification and restarts Home Assistant Core when swap stays above 90% for 5 minutes.
Spike-capture automation that writes diagnostic bundles when swap crosses pressure thresholds.
The problem is that the swap spikes are often brief and jagged. Swap may hit 95-100%, the host may become briefly unreachable, and then swap drops back below 90% before the 5-minute critical automation timer completes. So the automation can be technically working as configured while still missing dangerous short spikes.
There is also an external watchdog agent running on a separate host. It checks Home Assistant reachability via:
ping
Home Assistant API
SSH
This watchdog has reported multiple periods where Home Assistant was not reachable by any of the three methods. That suggests the issue is not only the HA API hanging; during some spikes the host/network stack appears effectively unavailable from outside.
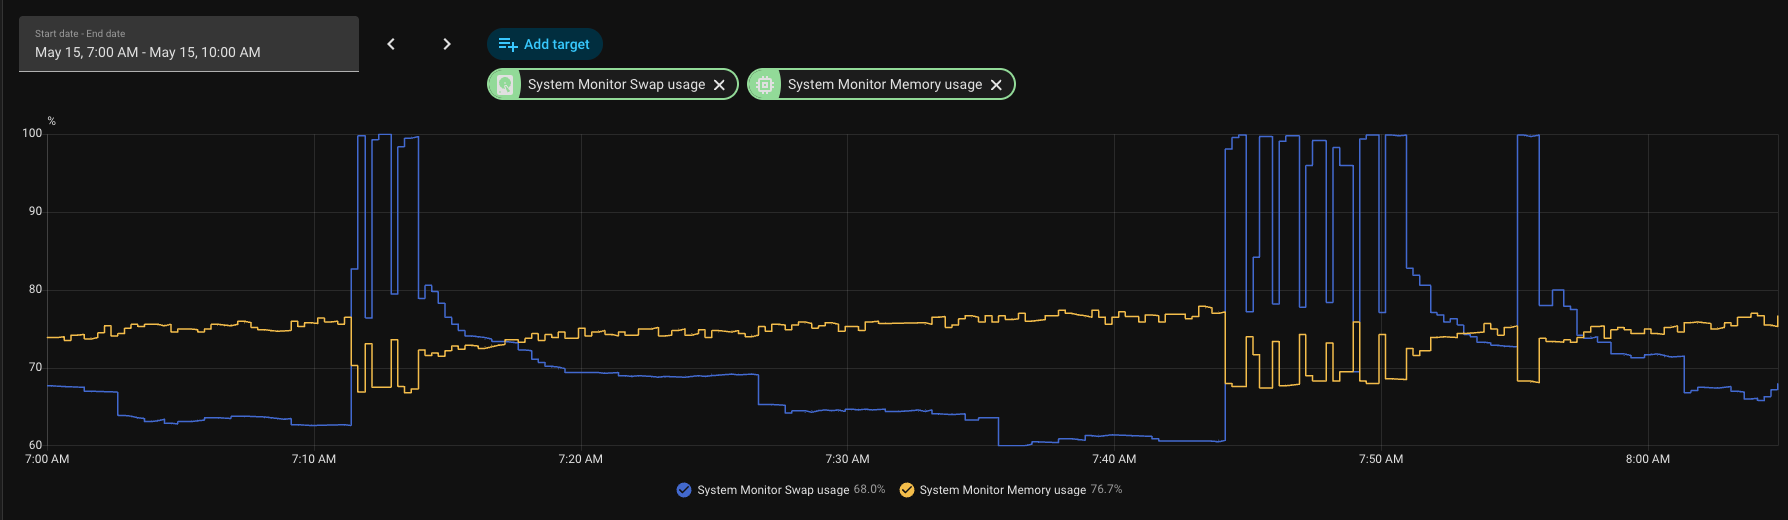
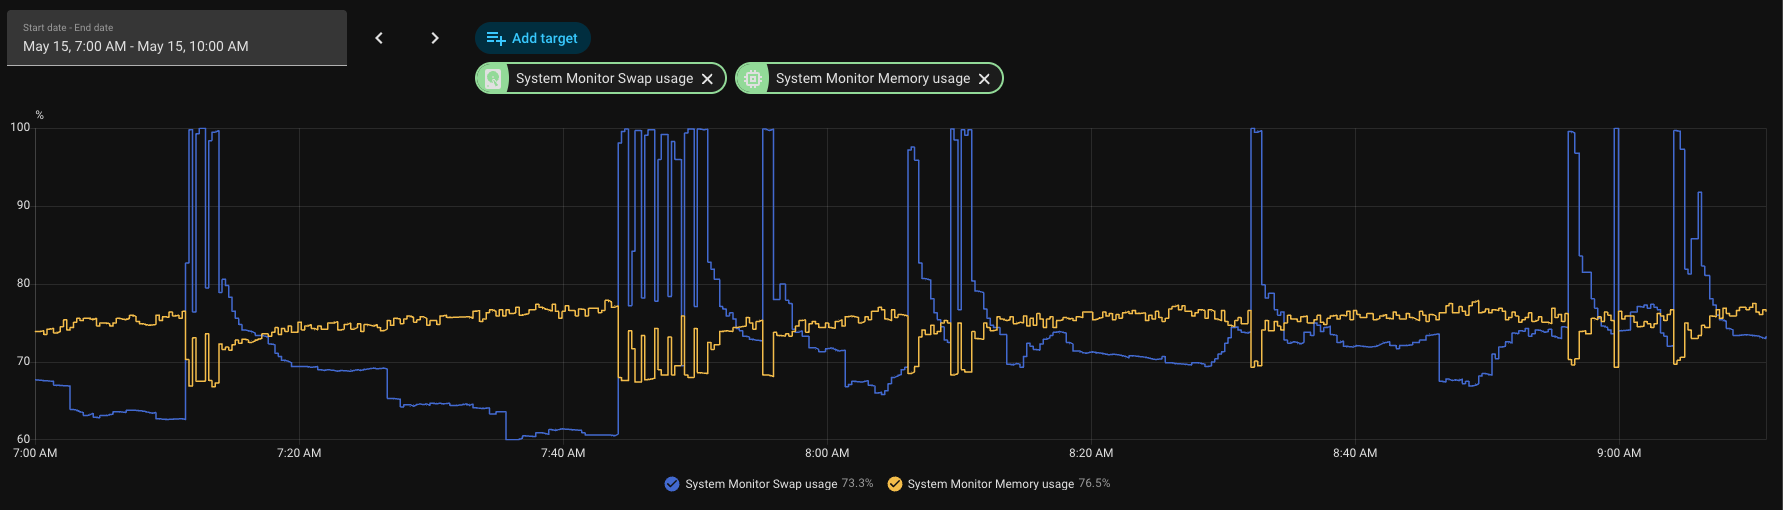
I have attached a screenshot from this morning showing swap repeatedly hitting 95-100% while memory stayed below 100%.
HA Core/container appears to be the pressure source, not add-ons.
Spike captures show the python3 Home Assistant Core process as the dominant memory/swap process.
Example capture around a high-swap event:
System swap used: ~1.1 GB of 1.25 GB
Core stats: ~1.9 GB memory usage
python3: ~1.96 GB RSS, ~180 MB swap
Other processes were tiny by comparison.
Earlier captures showed similar behavior, with Core/container memory peaks around 1.8-1.9 GB and hundreds of MB of swap peak.
Host logs do not show OOM kills.
Supervisor/add-on stats do not show an add-on consuming the memory.
Home Assistant Profiler start_log_objects shows continuous object growth, especially:
Task
coroutine
dict
list
Context
In one two-hour window this morning, profiler showed retained Task and coroutine counts growing from roughly 148k to 163k, about 125-130 additional retained tasks/coroutines per minute.
Known noisy integrations/logs:
Life360 custom integration is installed and logs switching to curl subprocess fallback after aiohttp 403.
Apple TV / pyatv errors appear at startup.
Google Assistant report state tasks have previously appeared stuck during startup wrap-up.
Google Nest SDM and pychromecast also log noise, but so far the main measurable issue is retained async object growth inside Core.
Questions:
What is the best next step to identify which integration is creating or retaining these Tasks/coroutines?
Is there a recommended way to get a useful task dump or object reference chain from HAOS when profiler.start_log_objects only shows object counts?
Are there known issues in recent 2026.4.x or 2026.5.x Core/HAOS builds, or with integrations like Life360/curl fallback, Google Assistant report state, Apple TV/pyatv, Nest SDM, or pychromecast, that could cause retained async task/coroutine growth?
Is increasing swap only masking the issue, or is 1.25 GB too small for HAOS 17.x/Core 2026.x on a 4 GB Pi?
Given that the host can briefly become unreachable before a sustained 5-minute automation trigger fires, is there a better HA-native mitigation pattern than “swap > 90% for 5 minutes”?
I’m trying to avoid simply scheduling restarts. I’d like to identify the actual integration or code path causing the retained task/coroutine growth.
This will not help much, but I would say that 4GB is pretty low, I did have a similar issue (mine is 8GB but running on a QEMU KVM/VM) but I had a poorly written daemon running on the host that I rearchitected. Also I had an influx DB for deeper analysis/monitoring of AP and IOT status and network traffic etc. (running both the Omada API and SNMP on schedules to collect information) - and I had made so many changes to the schema that one thing that really helped was to blow away and then rebuild the schema a ll at once, one final time when done with all that work. Do you have DB that is large? Accessing that may cause swaps too. Also, rebooting the host from time to time will help anything that has a memory leak, since we all run gazillions of integrations and addons, which in your case is so critical becuase of the limited RAM, I would set up a recurring host reboot (that properly shuts down HA first) anyway.
I actually have a reboot that runs at 3AM local time, but I have it disabled since I now have the triggered reboot automations, and wanted to let it run to see if I can find the root cause.
It is continuing to cycle, but it hasn't stayed above 90% long enough to trigger a reboot. I have both Claude and Codex monitoring but neither has been able to find a smoking gun.
My next step is to migrate HA off of the Raspberry PI, to a mini-PC that I have that is running Unraid and currently has Plex Server on it. Put it in a 8GB VM and just be done with it
I believe you are using a different custom Life360 integration than mine that was created recently as an alternative fix for problems caused by a Core change starting in 2026.2 whereby a different SSLContext object caused problems communicating with the Life360 server. I implemented a different work around in 0.7.1 that doesn't create an external process to run curl. You might want to give that (or the latest version, which is 0.8.0) a try. I'm not saying this other Life360 integration is problematic, just that this is one thing you can try to see if it makes any difference.
It was a PR submitted to my integration which I did not use. It came from a fork of my integration which doesn't even exist anymore. I did not make the fix, did not use the fix, and it never made it into a release.
I run home assistant on a raspberry pi 4 with 4GB of ram and I have a question.
If you look in >File editor>[Folder Icon at top left]
and read the extra-small print telling the size of your home_assistant_v2.db,
how big is your _v2.db file ?
My postulate is that in trying to do a largish .db from the SSD, your HA exceeds its 4096MiB of memory and starts trying to use swap space. In that case the limitation would be no particular integration; it would be the size after a year or more of use of the grouped record-keeping database architecture of HA.
My home-assistant_v2.db is currently about 596 MB.
Sidecar files:
home-assistant_v2.db: 596.3 MB
home-assistant_v2.db-wal: 6.2 MB
home-assistant_v2.db-shm: 32 KB
I do not think the DB-size theory fully fits my case, though I am not ruling recorder out entirely. The DB is not multi-GB, and SQLite generally should not need to load the whole database into RAM just because it is on SSD. In my observed failures, HA Core’s Python/container memory grows over time, while swap climbs toward exhaustion. After a Core restart, Core memory drops back under ~1 GB but swap remains partially used until the OS reclaims it.
We also have HA profiler evidence showing retained object growth, especially Task and coroutine objects, around +120 to +150/minute. That makes me suspect retained async work or an integration/coordinator behavior more than the raw recorder DB file size alone.
Recorder has also recently been trimmed to exclude a few high-churn entities, including media players and a Bubble Card module sensor.
After upgrading to 0.8.0 and restarting Home Assistant Core at about 10:29 EDT, I have not seen that message again. The only Life360 log entry after the restart is the normal Home Assistant warning that it is a custom integration.
Thanks. Your reply does indeed rule out what I'd feared; of a >4GB .db file (the first of those three). Since it is something else squirting a leak, I'm unconvinced that extra memory would do much other than increase the service interval before you are back to the same sort of fault and ought to power off power on. Good luck though.
This is why I wanted to solve the problem before migrating over to the mini-pc. Being a software engineer, I don't want to just kick the can down the curb.
With that said though, it is very possible a new clean installation might in of itself solve the problem. I originally set up this HA PI on 2021-02-13. That is a lot of tech debt right there...
Perhaps, but HA has been growing and growing for years... Might be time for an upgrade.
Look for things running that take a lot of memory but that you don't use all the time. For instance Code Server App can take over 1gb of memory sitting idle, so only start that when you need it.
Reading between the lines, I fear a swap file obsession.
The operating system should take care of memory management (by design) without manual intervention, queueing and swapping memory requests to disk when needed, dynamically. Restricting it in size may be causing you unnecessary angst.
Monitor what is chewing up available resources and focus on that. 4Gb physical RAM may be on the low side for a heavily loaded system, but look for housekeeping tasks that only require short time frames to complete as an outlier, not a limitation on your overall system functionality.
What do the device monitoring apps show for disk, memory and CPU resource availability over a 24 hour period? Is it always overloaded, or just for brief periods?
Don't rule out a faulty drive where bad sector retries can bring a well functioning system to a screeching halt.
Not really a swap file obsession, couldn't care less what it does.
This all started with HA repeatedly becoming unresponsive, requiring a hard reboot to recover. The investigation started with the hardware; I was thinking of an SSD failure or something similar. It was only after some monitoring and analysis that a pattern began to emerge. When the swap remained at 100% for an extended period, the system would lock up and require a reboot.
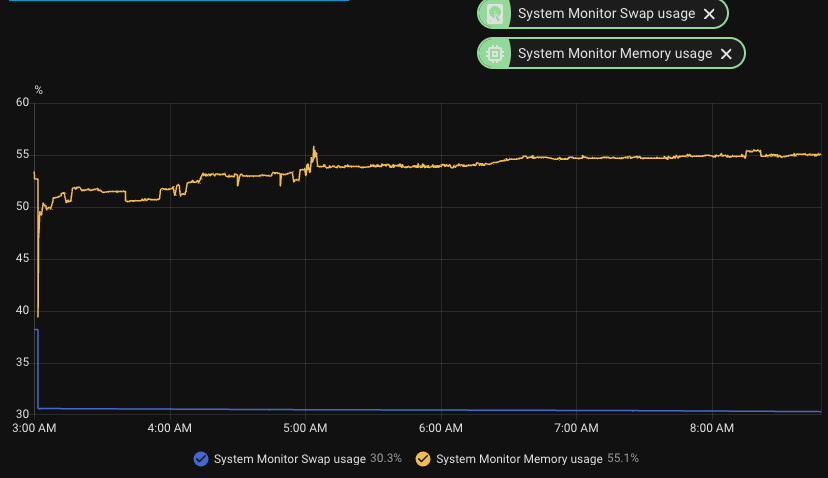
Well... Interesting you say that. While it was never determined to be part of the problem, I realized I do have it running all the time, even though I rarely use it. I shut it down yesterday along with a couple of other minor apps. Maybe it is just a coincidence, but it has been stable since last night. This is the first time in 2 months that it hasn't required a restart.
Visual Studio Code (or whatever the app is called nowadays) has a pretty nasty & long-documented bug where it keeps eating up memory without releasing it. It also hasn't received an update in 6 months, which is a long time in HA terms.
Between that and the fact it highlights false errors in the linter, I wouldn't recommend running it in its current condition. Someone has just released an updated fork of it this week, though it's still in its infancy, so take that into consideration.
Otherwise, unless you're doing some heavy coding, the File Editor app might be more suitable for you.
Yep - File Editor is more than enough, sorry I didn't pull the plug on Visual Studio sooner. Plus anything complicated I am doing, I am doing through Claude and Codex anyway.
That was some really useful investigating : I'd been considering installing the visual studio code server app to see what it does, and your testing has found that what it does might blurp slumongulate your swap space in a blubbergothy sort of way. I'd prefer not to have that happen on mine so I'll persevere with the File Editor for now.