Summary
I am using Home Assistant OS, and recently added one of my NFS drives as network storage through the Settings menu in the Home Assistant UI:

Since I am now using this storage to do my automated system backups, I wanted a way to monitor the drive using Home Assistant sensors, which was self-contained in HAOS, and survives system updates. With the recent improvements to the backup tools, this feels even more relevant now.
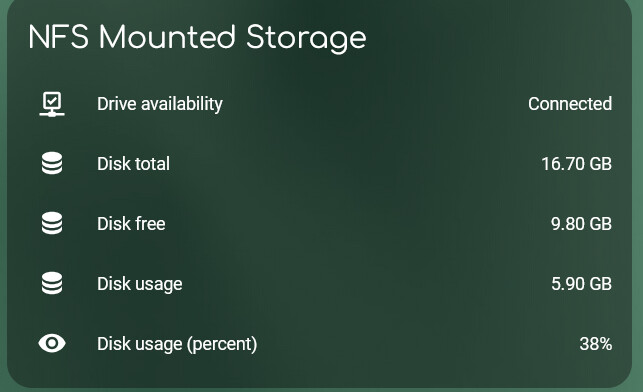
I’ve finally got something together that I’m happy with, and it was a little tricky to get working, so I’m documenting here what I ended up doing in case it’s helpful for anyone else. It’s a long post, but hopefully provides all the information. I don’t know if anyone has implemented this already on HAOS (and would be very happy to learn of easier ways if you know them). This is the kind of thing that I have working now:


Note:
This method is only necessary if you are using Home Assistant OS and have mounted a network drive in the menu and set “Usage” to “Backup”:
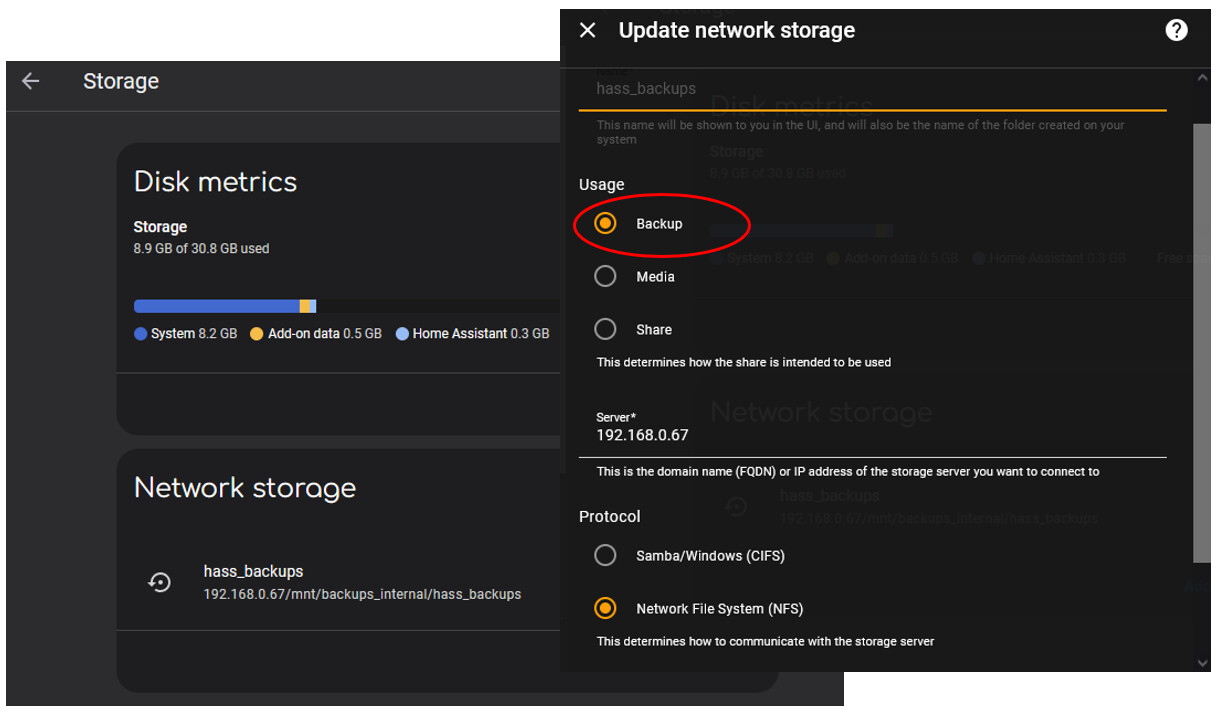
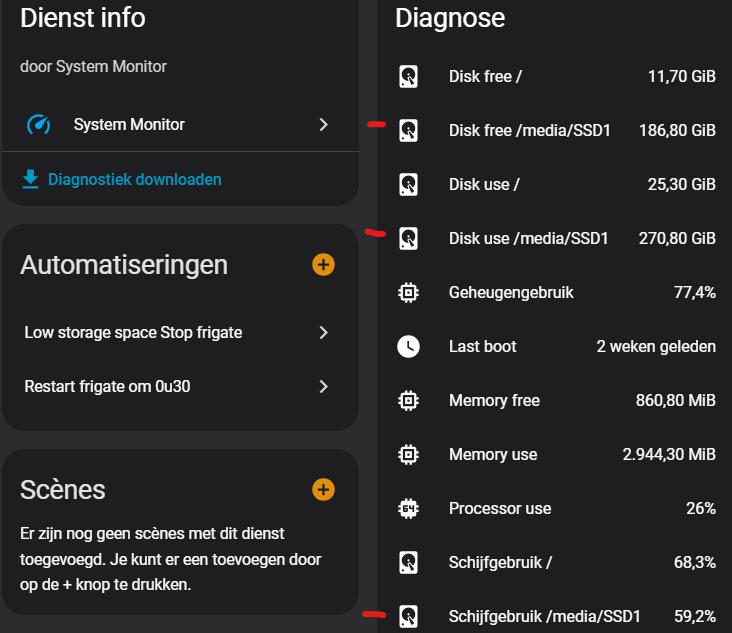
If instead you have set “Usage” to “Media”, then your drive usage will appear automatically under the System Monitor integration, as described in the comment below, and your life will be much easier. If you use your drive for backup like me then you will need the method that I describe in the following.
The Problem
When doing this on a dockerized install, it is relatively easier, because you have more control over the host OS. But with Home Assistant OS it is a little more tricky. I did not want to install any monitoring stack or cron scheduling on the HAOS host (because it will likely be wiped/reset when the system is updated).
Natively with HAOS, the Supervisor does indeed provide a basic notification regarding the state of the NFS drive, which is fine up to a point. It looks like this:

However, in my opinion it falls short for a few reasons:
- As far as I’m aware, it’s not currently possible to use these as push notifications to another device (e.g. email or smart phone). People have asked about this before. In any case, I don’t always check the notifications box in the Home Assistant dashboard, and it can be weeks sometimes before I look at it. I would like to be notified on my phone as soon as an issue with the storage mount is detected, because it could lead to the backups failing.
- Again, as far as I’m aware, I cannot use this native system repair warning as an event or boolean in any automations. For example, if there is an issue with this network drive, then I’d like to backup to another specified location, etc.
- There are no numerical sensors associated with this system monitoring from the Supervisor. For example, I’d like to notify my phone if the drive’s disk usage crosses a threshold, or perform other actions/automations, etc.
For these reasons, I have implemented a couple of shell scripts to satisfy these requirements. It seems that people have been interested in doing this before (see here, here, or here for example), but I didn’t find a satisfying existing solution.
Possible Existing Approaches
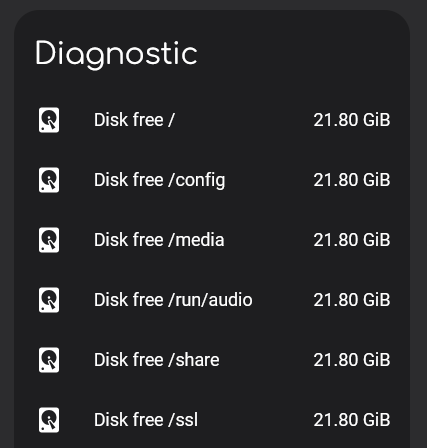
My first thought was to just use the System Monitor integration. However, when using Home Assistant OS, the System Monitor integration runs inside the homeassistant docker container, but the NFS mounts are not passed through into that container. Instead it seems the NFS drives are passed into the Supervisor container (called hassio_supervisor), because this is the one that handles network mounts and backups, etc. Therefore the System Monitor integration cannot see NFS mounts.
Next, I found an example here of someone creating a sensor to monitor if a network drive is available or not. However, this only works for manually mounted network drives (i.e. added to the fstab file in that case). It does not work for drives that are mounted through the Settings menu in the UI, a feature that was subsequently introduced.
Finally, a method was already used here to create a binary sensor to check if the NFS share is available, but it does so with the Ping integration. This essentially just pings the remote machine that is exporting the network drive and checks that it’s reachable over the network. However, there are still a few ways that this wouldn’t catch potential problems:
- The NFS export machine may be alive and connected to the network, but the network drive is not necessarily mounted onto the Home Assistant OS host machine.
- The drive may be mounted to the Home Assistant OS host, but not necessarily bind-mounted successfully into the
hassio_supervisorDocker container (i.e the one responsible for creating backups). - The drive may be correctly mounted into the container, but may not be writeable. For example, permissions errors or a corrupted drive can lead to this situation.
- The drive may be mounted and writeable, but there is not enough free space to perform the backups.
How I ended up doing it
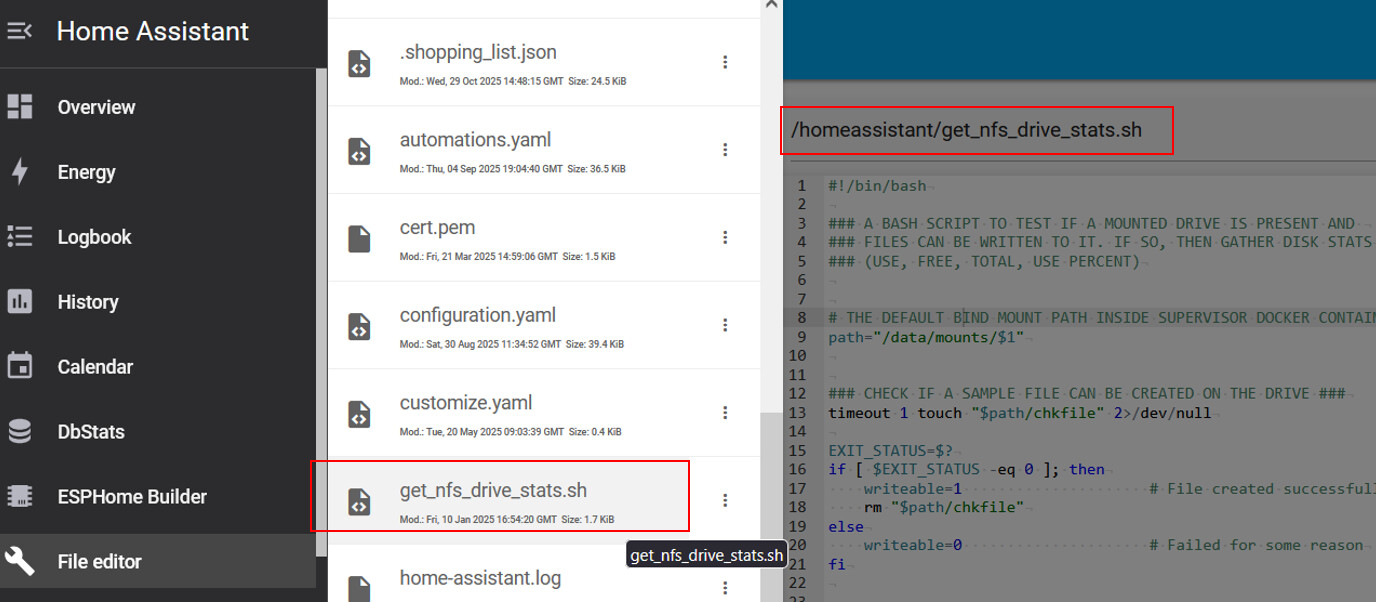
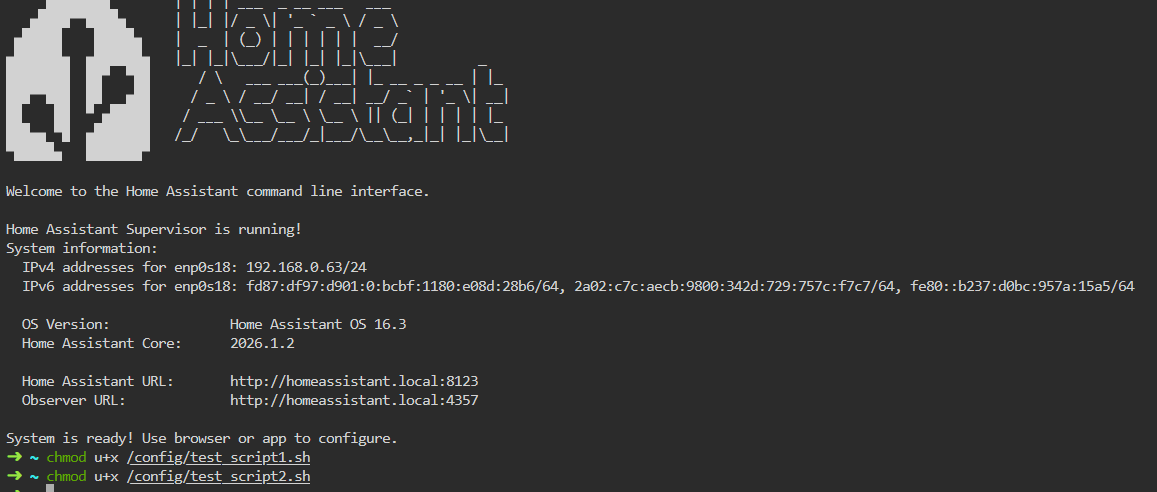
To check that all of the above conditions are met (and so I can safely go ahead and do a backup), I have created two shell scripts (called update_nfs_monitoring_sensors.sh and get_nfs_drive_stats.sh), and placed them both in the /config directory.
My solution consists of the following:
-
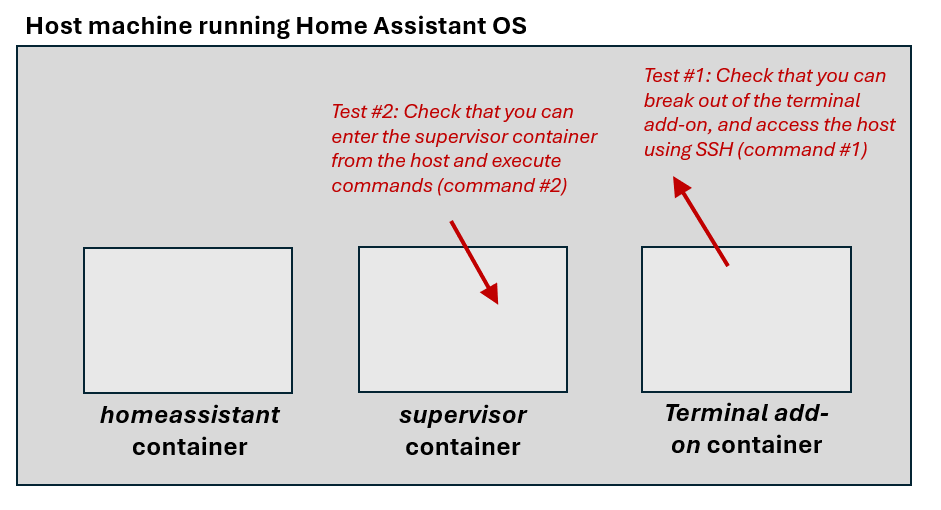
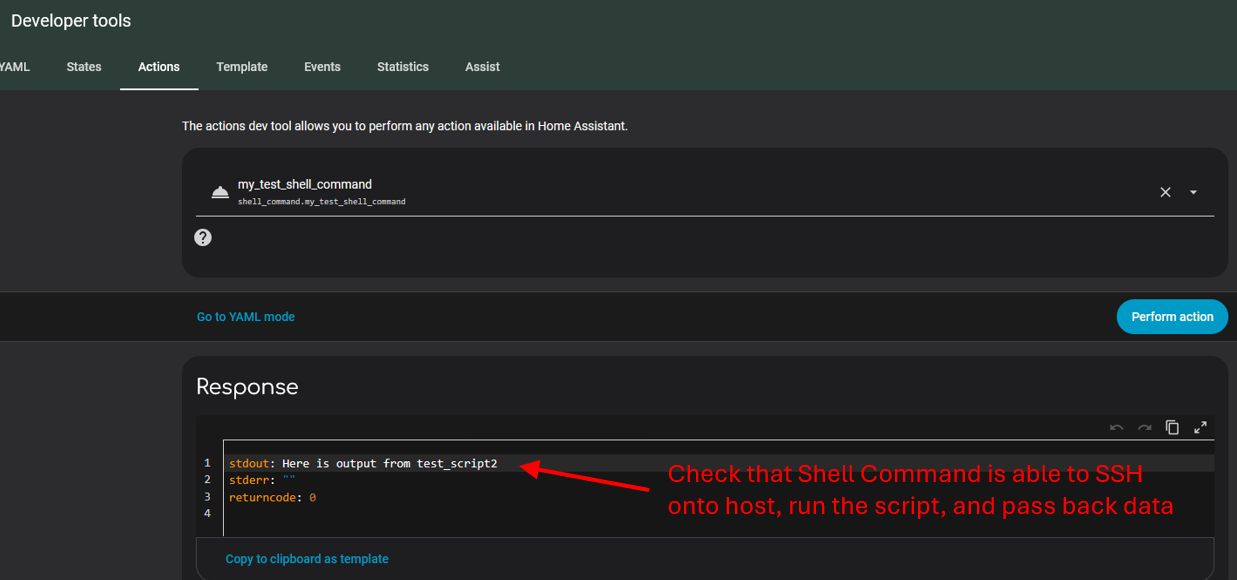
A Shell Command to provide an action that connects to the Home Assistant OS host over SSH and executes a script on the host (this is the script called
update_NFS_monitoring_sensors.sh). -
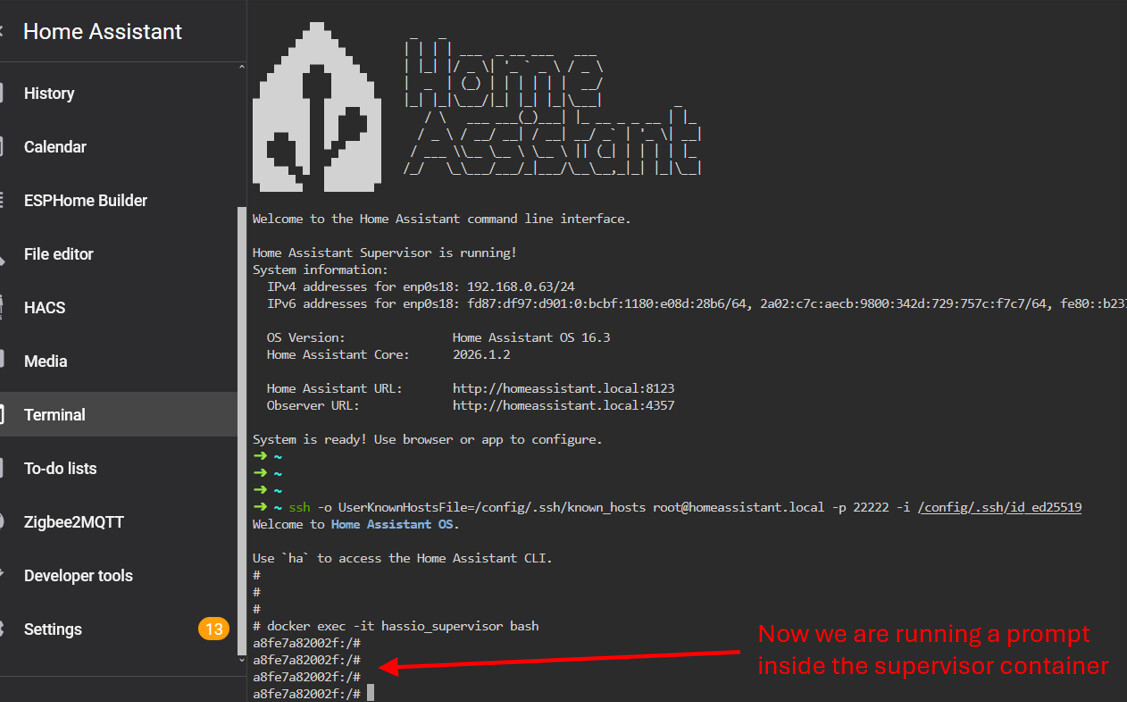
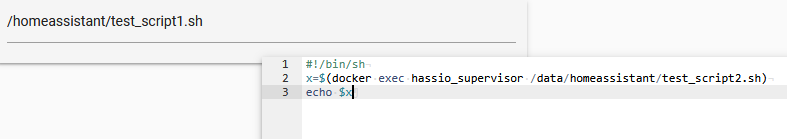
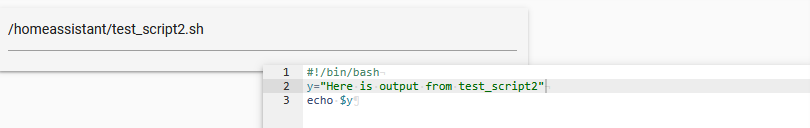
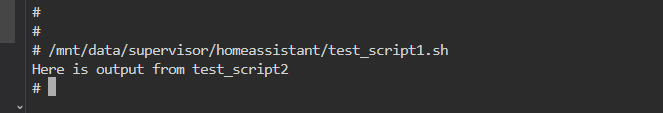
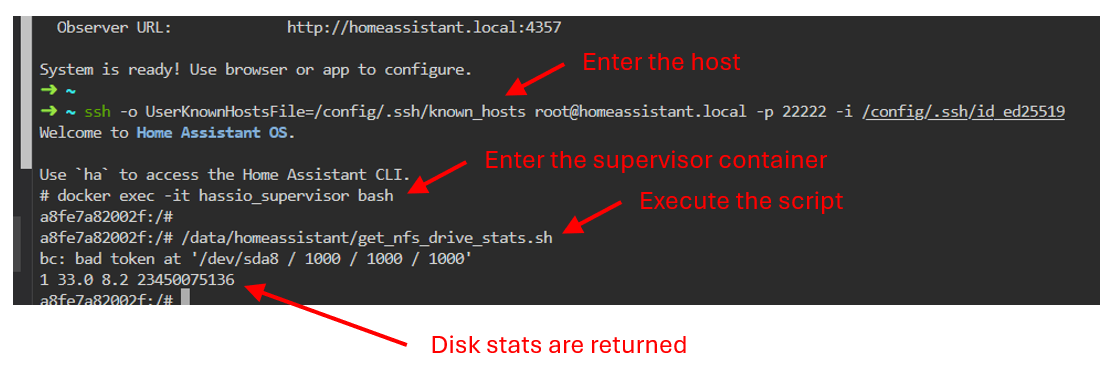
This first shell script then enters the Supervisor docker container and executes a second script inside (
get_nfs_drive_stats.sh). This one checks that the drive is correctly mounted there and is available. If so, it also grabs disk stats (free, used, total, used_percent). -
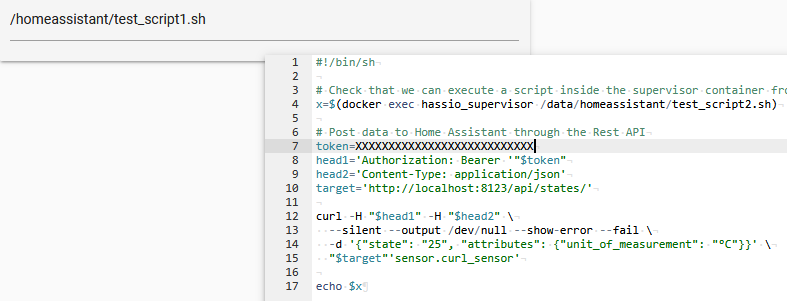
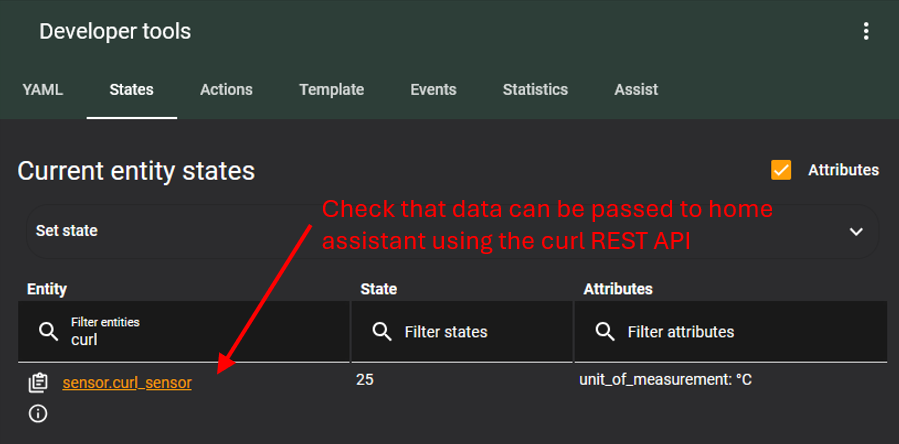
The information is returned back to the first script on the host, which then posts the data to Home Assistant sensors via CURL commands through the Rest API.
-
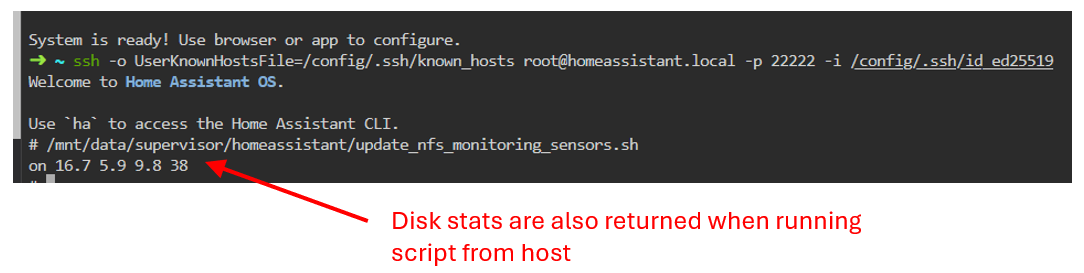
The shell command is executed every 15 minutes using an automation to check the health of the NFS drive, as well as 1 minute after a system restart (just in case the drive didn’t come back online).
-
Notifications using automations if the drive becomes disconnected, or if the free space gets too small.
Some subtleties which led to these decisions
-
Initially I tried to just have a single script which is executed inside the Supervisor container (because this container is where I want to be sure the drive correctly appears, so it can be used for backups). However, when testing it, I was unable to use CURL to post data with the API over port 8123 from inside this Supervisor docker container. I assume it is because port 8123 is not mapped from the host to this container (because it’s not really needed). This is the reason why I ended up passing the drive stats back to the host using a second script, and then finally using the host to do the CURL post part.
-
The second shell script tries to create a small test file on the NFS mount, in order to determine if it’s writeable. Often, when NFS mounts fail, they cause the system command to hang, and therefore this test is implemented with a timeout. The script also tries to run the
dfcommand to list the mounts, again with a timeout for the same reason. A hanging df command is often a sign of NFS mount issues. -
I had to use trigger-based template sensors for the data. This is because they retain their value when Home Assistant restarts. If I didn’t do this, then the sensors would go Unknown when the system restarts, which would fire off my warning notifications.
-
The first script is a basic Bourne shell script, because it seems Bash is fully not available on the Home Assistant OS host. Therefore it doesn’t have access to nice features of Bash (such as arrays), which would have been useful. However, it seems that Bash is installed in the Supervisor container image, and so the second script is a Bash script.
-
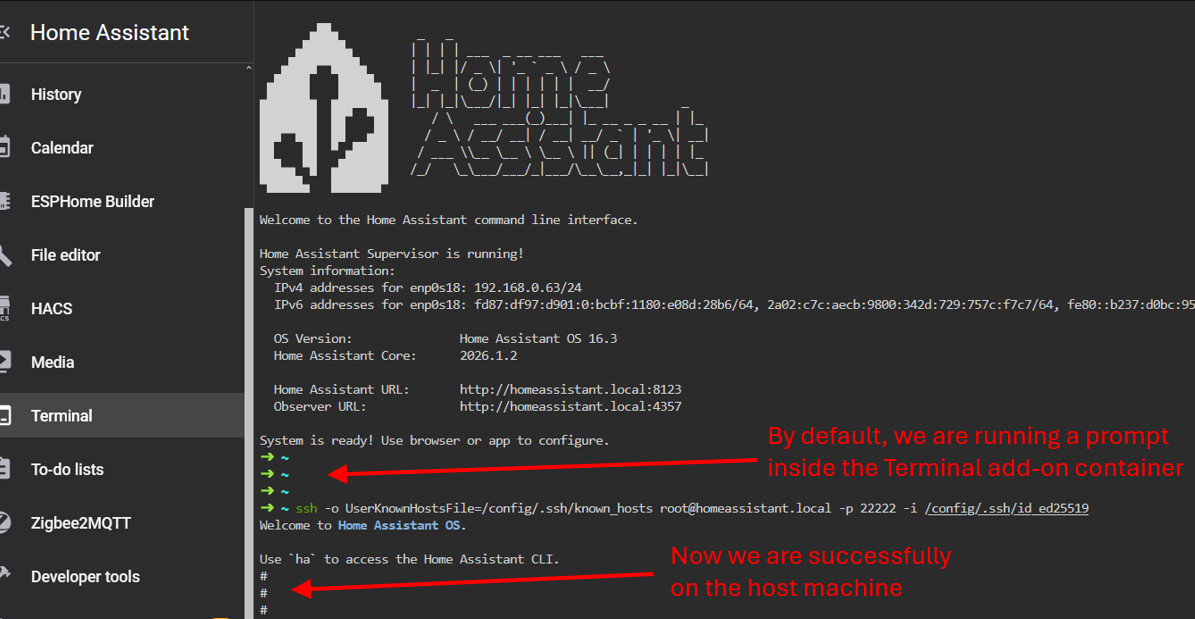
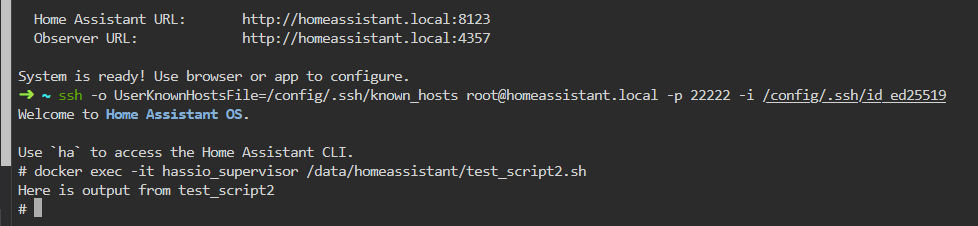
I originally wanted to use this method which makes use of a “named pipe” in order to all Home Assistant to execute a script on the HAOS host, since it avoids SSH (and is therefore arguably more secure). However, this method requires the cron job scheduler to be installed on the host, which is not the case when using Home Assistant OS. Therefore, I ended up taking the more common route of setting up SSH in order to run the Shell Command action, which has been well-documented on the forum. I followed these steps which worked nicely.
Shell command in configuration.yaml
shell_command:
  update_nfs_monitoring_sensors: "ssh -o UserKnownHostsFile=/config/.ssh/known_hosts [email protected] -p 22222 -i /config/.ssh/id_ed25519 '/mnt/data/supervisor/homeassistant/update_nfs_monitoring_sensors.sh'"
My shell scripts
update_nfs_monitoring_sensors.sh
#!/bin/sh
### A BOURNE SHELL SCRIPT TO CHECK THAT A GIVEN STORAGE DRIVE IS SUCCESSFULLY MOUNTED
### INSIDE THE HOME ASSISTANT SUPERVISOR DOCKER CONTAINER. IF SO, THEN RETRIEVE DISK
### STATS (DISK USAGE, ETC). POST THE RESULTS TO HOME ASSISTANT SENSORS OVER THE REST API.
# The name of the directory at the mount point
storage_name='hass_backups'
# Go into Supervisor docker container to check if drive is mounted, and gather metrics on disk usage
drive_stats=$(docker exec hassio_supervisor /data/homeassistant/get_nfs_drive_stats.sh "$storage_name")
# Read the drive metrics into positional parameters, ready for further use
saveIFS=$IFS
IFS=$' '
set -- $drive_stats
IFS=$saveIFS
# Get each of the corresponding variables from the positional parameters
available="$1"
disk_total_gb="$2"
disk_use_gb="$3"
disk_free_gb="$4"
disk_use_percent="$5"
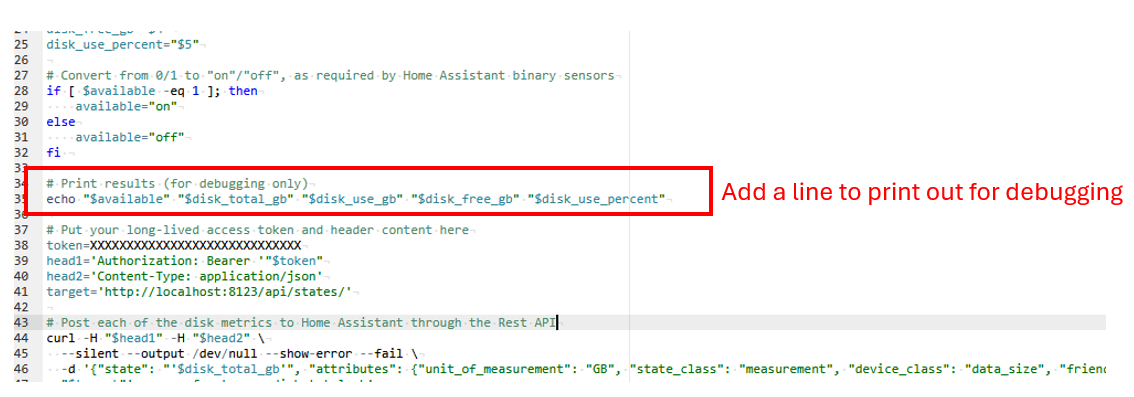
# Convert from 0/1 to "on"/"off", as required by Home Assistant binary sensors
if [ $available -eq 1 ]; then
available="on"
else
available="off"
fi
# Put your long-lived access token and header content here
token=my_super_long_token_goes_here
head1='Authorization: Bearer '"$token"
head2='Content-Type: application/json'
target='http://localhost:8123/api/states/'
# Post each of the disk metrics to Home Assistant through the Rest API
curl -H "$head1" -H "$head2" --silent --output /dev/null --show-error --fail \
-d '{"state": "'$disk_total_gb'",
"attributes": {
"unit_of_measurement": "GB",
"state_class": "measurement",
"device_class": "data_size",
"friendly_name": "NFS Storage Disk Total GB"
}
}' \
"$target"'sensor.nfs_storage_disk_total_gb'
curl -H "$head1" -H "$head2" --silent --output /dev/null --show-error --fail \
-d '{"state": "'$disk_use_gb'",
"attributes": {
"unit_of_measurement": "GB",
"state_class": "measurement",
"device_class": "data_size",
"friendly_name": "NFS Storage Disk Use GB"
}
}' \
"$target"'sensor.nfs_storage_disk_use_gb'
curl -H "$head1" -H "$head2" --silent --output /dev/null --show-error --fail \
-d '{"state": "'$disk_free_gb'",
"attributes": {
"unit_of_measurement": "GB",
"state_class": "measurement",
"device_class": "data_size",
"friendly_name": "NFS Storage Disk Free GB"
}
}' \
"$target"'sensor.nfs_storage_disk_free_gb'
curl -H "$head1" -H "$head2" --silent --output /dev/null --show-error --fail \
-d '{"state": "'$disk_use_percent'",
"attributes": {
"unit_of_measurement": "%",
"state_class": "measurement",
"friendly_name": "NFS Storage Disk Use Percent"
}
}' \
"$target"'sensor.nfs_storage_disk_use_percent'
curl -H "$head1" -H "$head2" --silent --output /dev/null --show-error --fail \
-d '{"state": "'$available'",
"attributes": {
"device_class": "connectivity",
"friendly_name": "NFS Storage Availability"
}
}' \
"$target"'binary_sensor.nfs_storage_availability'
get_nfs_drive_stats.sh
#!/bin/bash

### A BASH SCRIPT TO TEST IF A MOUNTED DRIVE IS PRESENT AND
### FILES CAN BE WRITTEN TO IT. IF SO, THEN GATHER DISK STATS
### (USE, FREE, TOTAL, USE PERCENT)


# THE DEFAULT BIND MOUNT PATH INSIDE SUPERVISOR DOCKER CONTAINER
path="/data/mounts/$1"


### CHECK IF A SAMPLE FILE CAN BE CREATED ON THE DRIVE ###
timeout 1 touch "$path/chkfile" 2>/dev/null

EXIT_STATUS=$?
if [ $EXIT_STATUS -eq 0 ]; then
    writeable=1                     # File created successfully
    rm "$path/chkfile"
else
    writeable=0                     # Failed for some reason
fi


### CHECK IF MOUNTS CAN BE LISTED WITHOUT TIMING OUT ###
timeout 1 df &> /dev/null

EXIT_STATUS=$?
if [ $EXIT_STATUS -eq 0 ]; then
    mounts_listable=1               # df command could be run without problems
else
    mounts_listable=0               # Failed for some reason
fi


### IF MOUNTED DRIVE IS AVAILABLE, THEN GET DISK USAGE ###
disk_stats="0 0 0 0"
available=0
if [ $mounts_listable -eq 1 ] && [ $writeable -eq 1 ]; then
    if [ ! -z "$(df | grep "$path")" ]; then
        disk_stats=$(df -B1 "$path" | tail -1)
        available=1
    fi
fi


### EXTRACT RELEVANT VALUES AND CONVERT FROM BYTES TO GIGABYTES ###
disk_total_bytes=$(echo $disk_stats | awk '{print $1}')
disk_use_bytes=$(echo $disk_stats | awk '{print $2}')
disk_free_bytes=$(echo $disk_stats | awk '{print $3}')
disk_use_percent=$(echo $disk_stats | awk '{print $4}' | tr -d '%')

disk_total_gb=$(echo "scale=1; $disk_total_bytes / 1000 / 1000 / 1000" | bc)
disk_use_gb=$(echo "scale=1; $disk_use_bytes / 1000 / 1000 / 1000" | bc)
disk_free_gb=$(echo "scale=1; $disk_free_bytes / 1000 / 1000 / 1000" | bc)


### PRINT VALUES FOR USE OUTSIDE CONTAINER ###
echo $available $disk_total_gb $disk_use_gb $disk_free_gb $disk_use_percent
Trigger-based template sensors
template:
  - trigger:
      - platform: state
        entity_id:
          - binary_sensor.nfs_storage_availability
        to:
    binary_sensor:
      - name: "NFS Storage Availability"
        unique_id: nfs_storage_availability
        device_class: connectivity
        state: "{{ states('binary_sensor.nfs_storage_availability') }}"
  - trigger:
      - platform: state
        entity_id:
          - sensor.nfs_storage_disk_total_gb
        to:
    sensor:
      - name: "NFS Storage Disk Total GB"
        unique_id: nfs_storage_disk_total_gb
        unit_of_measurement: GB
        state_class: measurement
        device_class: data_size
        state: "{{ states('sensor.nfs_storage_disk_total_gb') }}"
  - trigger:
      - platform: state
        entity_id:
          - sensor.nfs_storage_disk_use_gb
        to:
    sensor:
      - name: "NFS Storage Disk Use GB"
        unique_id: nfs_storage_disk_use_gb
        unit_of_measurement: GB
        state_class: measurement
        device_class: data_size
        state: "{{ states('sensor.nfs_storage_disk_use_gb') }}"
  - trigger:
      - platform: state
        entity_id:
          - sensor.nfs_storage_disk_free_gb
        to:
    sensor:
      - name: "NFS Storage Disk Free GB"
        unique_id: nfs_storage_disk_free_gb
        unit_of_measurement: GB
        state_class: measurement
        device_class: data_size
        state: "{{ states('sensor.nfs_storage_disk_free_gb') }}"
  - trigger:
      - platform: state
        entity_id:
          - sensor.nfs_storage_disk_use_percent
        to:
    sensor:
      - name: "NFS Storage Disk Use Percent"
        unique_id: nfs_storage_disk_use_percent
        unit_of_measurement: "%"
        state_class: measurement
        state: "{{ states('sensor.nfs_storage_disk_use_percent') }}"
Automation to update sensors
alias: Periodically monitor mounted NFS storage
description: ""
triggers:
  - trigger: time_pattern
    minutes: /15
  - trigger: homeassistant
    event: start
conditions: []
actions:
  - delay:
      hours: 0
      minutes: 1
      seconds: 0
      milliseconds: 0
  - action: shell_command.update_nfs_monitoring_sensors
    data: {}
mode: single
Automations for notifying of problems
alias: Notify if NFS storage drive disconnected
description: ""
triggers:
  - trigger: state
    entity_id:
      - binary_sensor.nfs_storage_availability
    from: "on"
    to: null
    for:
      hours: 0
      minutes: 1
      seconds: 0
conditions: []
actions:
  - action: notify.mobile_app_tom_phone
    metadata: {}
    data:
      title: NFS Storage Drive Error
      message: Drive appears to have disconnected!
mode: single
alias: Notify if NFS storage disk space is low
description: ""
triggers:
  - trigger: numeric_state
    entity_id:
      - sensor.nfs_storage_disk_free_gb
    below: 5
    for:
      hours: 0
      minutes: 1
      seconds: 0
    above: 0
  - trigger: numeric_state
    entity_id:
      - sensor.nfs_storage_disk_use_percent
    above: 80
    for:
      hours: 0
      minutes: 1
      seconds: 0
    below: 100
  - trigger: state
    entity_id:
      - sensor.nfs_storage_disk_free_gb
    to: unavailable
    for:
      hours: 0
      minutes: 1
      seconds: 0
  - trigger: state
    entity_id:
      - sensor.nfs_storage_disk_free_gb
    to: unknown
    for:
      hours: 0
      minutes: 1
      seconds: 0
conditions: []
actions:
  - action: notify.mobile_app_tom_phone
    metadata: {}
    data:
      title: NFS Drive Disk Space Warning
      message: NFS storage disk space is low!
mode: single
I hope some of this may be useful to someone!