Which doc are you referring to? I’ve read many times this one: https://github.com/kalkih/mini-graph-card
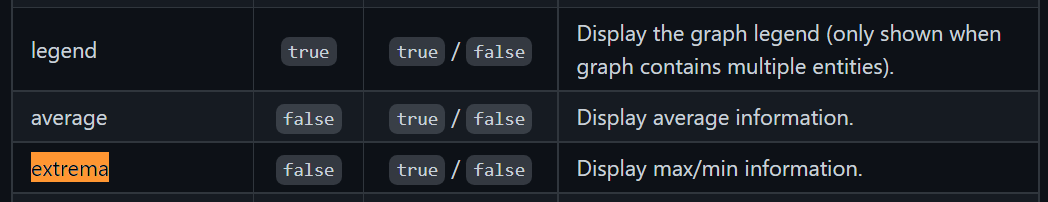
But CTRL+F on “Extrema” returns only 1 result:
And I’m not sure what I have to do with the legend either

Which doc are you referring to? I’ve read many times this one: https://github.com/kalkih/mini-graph-card
But CTRL+F on “Extrema” returns only 1 result:
How to set a color for the last bar:
  - type: custom:mini-graph-card
    entities:
      - entity: sensor.cleargrass_1_co2
    show:
      graph: bar
    card_mod:
      style: |
        rect.bar:last-of-type {
           fill: red;
        }

(as an answer for this issue)
Hello, I was trying to make a stock graph where the color is red when the market is under the previous close value, but I not able to have variable in my code I don’t understand why. I already tried everything I could find here but it still doesn’t work.
type: custom:mini-graph-card
variables:
  - current_val: states['sensor.yahoofinance_cspx_as'].state
  - previous_market_close: stat_attr('sensor.yahoofinance_cspx_as', 'regularMarketPreviousClose')
entities:
  - sensor.yahoofinance_cspx_as
hours_to_show: 25
points_per_hour: 4
color_thresholds:
  - value: '${previous_market_close}'
    color: '#8AFF8A'
  - value: '${previous_market_close}'
    color: '#c0392b'
show:
  labels: true
  points: false
  y_axis: true
  show_line: true
  icon_adaptive_color: true
  extrema: true
Where in the mini graph card docs did you see this support for variables?
You’ll have to use config-template-card in combination with the mini-graph for what you want to achieve.
#1. Is there no option for making an X-axis in the graph? I want to have all 24h hours of the day to be displayed?
#2. Also, is there no way to be able to see all 24h in static mode. But with the current time to be marked somehow. I want to use Nordpools electricity prices forecast for the whole day to be displayed.
Now I can only see current time and 24hours history.
Is there a way to show only current day, e.g from 00.00 to 00.00 and no history from yesterday?
You could try apexcharts-card with this
type: custom:apexcharts-card
experimental:
  color_threshold: true
graph_span: 1d
header:
  title: Elpriser idag
  show: true
span:
  start: day
now:
  show: true
  label: Nu
series:
  - entity: sensor.nordpool_kwh_se3_sek_3_10_025
    data_generator: |
      return entity.attributes.raw_today.map((entry) => {
        return [new Date(entry.start), entry.value];
      });
    color_threshold:
      - value: 0
        color: green
        opacity: 1
      - value: 1
        color: yellow
      - value: 1.5
        color: red
    type: column
For those who really wants this:
type: custom:mini-graph-card
entities:
  - entity: sensor.cleargrass_1_co2
    name: Temp
    show_state: true
    color: red
    state_adaptive_color: true
  - entity: sensor.cleargrass_2_co2
    name: CO2
    show_state: true
    color: green
    state_adaptive_color: true
show:
  name: false
  icon: false
card_mod:
  style: |
    .states.flex {
      flex-direction: column;
    }
    .states--secondary {
      margin-left: 0px !important;
      margin-top: 12px;
    }


Works nice only for two entities maximum.
Unfortunately, it is better to disable the “show points” option since the top state label is used not only for displaying the 1st entity’s state but also for displaying a value for the selected point of ANY graph.
Look at the picture: the bottom label contains a current state of the 2nd entity, the top label contains a state for the selected point of the same 2nd entity:

So, this mod should be used w/o the “show points” option.
Displaying states as a part of the legend:
type: custom:mini-graph-card
entities:
  - entity: sensor.cleargrass_1_co2
    name: Temp
    color: red
  - entity: sensor.cleargrass_2_co2
    name: CO2
    color: green
show:
  name: false
  points: false
  icon: false
  state: false
card_mod:
  style: |
    .graph__legend__item:nth-of-type(1) .ellipsis:after {
      content: ": {{states('sensor.cleargrass_1_co2')}} ppm";
    }
    .graph__legend__item:nth-of-type(2) .ellipsis:after {
      content: ": {{states('sensor.cleargrass_2_co2')}} ppm";
    }

Only if you are not interested in “show points = true”.
Note: this mod may not be needed after 0.13.0-dev.1.
Can you show me your code please?
Combining history-graph & mini-graph-card:

type: custom:stack-in-card
card_mod:
  style: |
    ha-card {
      overflow: visible !important;
    }
cards:
  - type: custom:mini-graph-card
    entities:
      - entity: sensor.cleargrass_1_co2
        name: CO2
    hours_to_show: 48
    points_per_hour: 60
    line_width: 1
  - type: history-graph
    entities:
      - entity: sun.sun
        name: Sun
    hours_to_show: 48
    refresh_interval: 0
    card_mod:
      style: |
        .content {
          padding-left: 0px !important;
          padding-right: 0px !important;
          padding-top: 0px !important;
        }
        ha-card {
          margin-top: -4px;
        }
Surely one binary sensor may be added as a background card - you need to “convert” this binary_sensor into sensor (0,1) and “attach” it to secondary y-axis:

Update 24.06.22:
Due to changes in HA 2022.6 in part of history-graph, this style should be revised:
type: custom:stack-in-card
keep:
  outer_padding: true
...
  - type: history-graph
    entities:
      - entity: sun.sun
        name: ' '
...
        ha-card {
          margin-top: -10px;
          margin-right: -5px;
          margin-left: -10px;
        }

And result is unstable…
not sure if you ever received a reply on this, but I just found your post, and hadn’t read @Ildar_Gabdullin 's remark above it… so I tried it and it still works (on dev 2022.2.0) ![]() very nice suggestion and addition indeed
very nice suggestion and addition indeed
Thanks for your feedback, Marius. I totally forgot about this when I upgraded at the time (and hence thank you for the reminder too), but luckily remained working (I’m on 2021.12.7).
How can i get the “mbit/s” under the actual state? (i want it to be in a double row)

type: custom:mini-graph-card
entities:
  - sensor.cleargrass_1_temperature
style: |
  ha-card .states.flex .state {
    display: grid;
  }


That’s a very nice mod of the mini graph card. Thank you! Is it possible to change the font size of the legend?
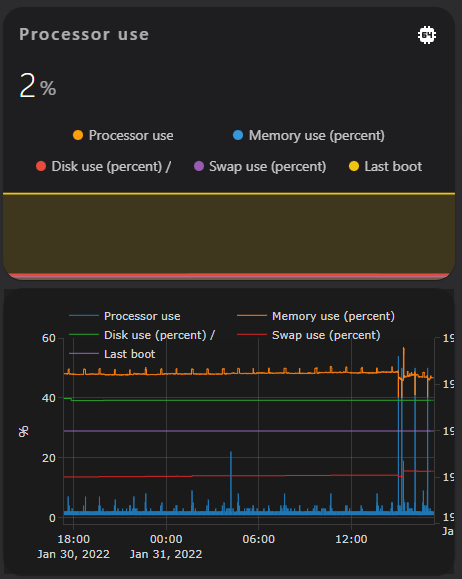
Greetings. I trying out two graph cards with basic configs:
 type: custom:mini-graph-card
 hour24: true
 line_width: 2
 entities:
   - entity: sensor.processor_use_percent
   - entity: sensor.memory_use_percent
   - entity: sensor.disk_use_percent
   - entity: sensor.swap_use_percent
   - entity: sensor.last_boot
and
type: custom:plotly-graph
entities:
  - entity: sensor.processor_use_percent
  - entity: sensor.memory_use_percent
  - entity: sensor.disk_use_percent
  - entity: sensor.swap_use_percent
  - entity: sensor.last_boot
hours_to_show: 24
refresh_interval: 10
HA returns this:
Why mini-graph-card shows straight lines where plotly does actually build graphs, what do I do wrong?