Interesting. I’m running themes and the cards are coloring correctly. I’ll have to test with that specific theme to see what’s happening. I’ll try to have more info in a couple of days.
More soon.
Regards,
Stephen
Interesting. I’m running themes and the cards are coloring correctly. I’ll have to test with that specific theme to see what’s happening. I’ll try to have more info in a couple of days.
More soon.
Regards,
Stephen
Is there a way to add a 5 minute load average to the sensor? I assume since I do not see that in the sensor data in developers tools, it is not gathered at this time. Also, how would one pull the IP address for the eno0 device for display in the card?
Also, what is the best method to a 2 switch entities to the full card? I have created command line switches to reboot each of my pi’s and to shut each down.
BTW, really nice work!
hi
i trying to get this to work on my home assistant… i followed the instructions but i must be missing something
i got my 1 raspberry pi transmitting called pump
i added to the configuration file
mqtt:
discovery: true
i reboot it but it cant find anything what else do you need to do?
[2021-03-15 18:10:19] Publishing to MQTT topic "home/node/sensor/rpi-{pump}/monitor, Data:{"info": {"timestamp": "2021-03-15T18:10:18-04:00", "rpi_model": "RPi 4 Model B r1.2", "ifaces": "e,w,b", "host_name": "pump", "fqdn": "pump", "ux_release": "buster", "ux_version": "5.4.79-v7l+", "up_time": "27 min", "last_update": "2021-03-13T20:47:11-05:00", "fs_total_gb": 32, "fs_free_prcnt": 30, "networking": {"eth0": {"IP": "192.168.0.51", "mac": "dc:a6:32:92:b1:7d"}, "wlan0": {"mac": "dc:a6:32:92:b1:7e"}}, "drives": {"root": {"size_gb": 32, "used_prcnt": 30, "device": "/dev/root", "mount_pt": "/"}}, "memory": {"size_mb": "3827.926", "free_mb": "3454.148"}, "cpu": {"hardware": "BCM2711", "model": "ARMv7 Processor rev 3 (v7l)", "number_cores": 4, "bogo_mips": "1080.00", "serial": "10000000effdcc32"}, "throttle": ["throttled = 0x0", "Not throttled"], "temperature_c": 27.2, "temp_gpu_c": 27.2, "temp_cpu_c": 24.8, "reporter": "ISP-RPi-mqtt-daemon v1.5.4", "report_interval": 5}}"
[2021-03-15 18:15:21] Publishing to MQTT topic "home/node/sensor/rpi-{pump}/monitor, Data:{"info": {"timestamp": "2021-03-15T18:15:19-04:00", "rpi_model": "RPi 4 Model B r1.2", "ifaces": "e,w,b", "host_name": "pump", "fqdn": "pump", "ux_release": "buster", "ux_version": "5.4.79-v7l+", "up_time": "32 min", "last_update": "2021-03-13T20:47:11-05:00", "fs_total_gb": 32, "fs_free_prcnt": 30, "networking": {"eth0": {"IP": "192.168.0.51", "mac": "dc:a6:32:92:b1:7d"}, "wlan0": {"mac": "dc:a6:32:92:b1:7e"}}, "drives": {"root": {"size_gb": 32, "used_prcnt": 30, "device": "/dev/root", "mount_pt": "/"}}, "memory": {"size_mb": "3827.926", "free_mb": "3454.004"}, "cpu": {"hardware": "BCM2711", "model": "ARMv7 Processor rev 3 (v7l)", "number_cores": 4, "bogo_mips": "1080.00", "serial": "10000000effdcc32"}, "throttle": ["throttled = 0x0", "Not throttled"], "temperature_c": 24.8, "temp_gpu_c": 24.8, "temp_cpu_c": 25.3, "reporter": "ISP-RPi-mqtt-daemon v1.5.4", "report_interval": 5}}"
[2021-03-15 18:20:22] Publishing to MQTT topic "home/node/sensor/rpi-{pump}/monitor, Data:{"info": {"timestamp": "2021-03-15T18:20:21-04:00", "rpi_model": "RPi 4 Model B r1.2", "ifaces": "e,w,b", "host_name": "pump", "fqdn": "pump", "ux_release": "buster", "ux_version": "5.4.79-v7l+", "up_time": "37 min", "last_update": "2021-03-13T20:47:11-05:00", "fs_total_gb": 32, "fs_free_prcnt": 30, "networking": {"eth0": {"IP": "192.168.0.51", "mac": "dc:a6:32:92:b1:7d"}, "wlan0": {"mac": "dc:a6:32:92:b1:7e"}}, "drives": {"root": {"size_gb": 32, "used_prcnt": 30, "device": "/dev/root", "mount_pt": "/"}}, "memory": {"size_mb": "3827.926", "free_mb": "3453.691"}, "cpu": {"hardware": "BCM2711", "model": "ARMv7 Processor rev 3 (v7l)", "number_cores": 4, "bogo_mips": "1080.00", "serial": "10000000effdcc32"}, "throttle": ["throttled = 0x0", "Not throttled"], "temperature_c": 25.8, "temp_gpu_c": 25.8, "temp_cpu_c": 25.3, "reporter": "ISP-RPi-mqtt-daemon v1.5.4", "report_interval": 5}}"
You can check the MQTT traffic with an MQTT monitor app like MQTT Box or MQTT Explorer. One of these might provide additional insight.
Also please remove the { and } from around your pump hostname. The braces should not be there.
Also, make sure your topic is what HA is listening for…you are using home/node/sensor. Make sure home/node is expected by HA.
Thanks! Glad you like this solution.
re 5 minute accum.: One might be able to modify the RPi side python script to accumulate the 5 minute values and then would need to transmit the new 5 minute value in the script to the MQTT broker as part of the data currently being sent. So, yes it might be possible but only at the resolution of the script. If the script runs every 5 minutes. The there is no ability to accumulate the values since it only reads the values once every 5 minutes. The script would have to run more frequently to accumulate the values. This make sense?
re switch card layout. It’s set by a configuration-static value read by the lovelace ui at page refresh.
Not sure if this help you…
Regards,
Stephen
ok thanks ill give it a try… i new to mqtt and all that stuff… and there isnt really good step by step instructions least for a noobie i think more like people that understand this stuff…
i did play with the MQTT listening but how do you tell it to listen each time it reboots or restarts… as its manual… and you cant really edit the cards to listen?
but ill try and see… right now all this stuff confuses me… but once i understand it im sure i could do 10 pis right now i have 3 id like to monitor plust the home assistant pi
ok so removing { } that made it work kinda
the mqtt in HA detected
but it only detected 3 sensors and it created its own card and not posted in the lovelace predefined card…
i was watching other videos to try to understand mqtt the one confused me and i couldnt get it to work with node-red and debugger it didnt wanna work… so not 100% sure if i did it right but here is the infos
[2021-03-16 20:50:18] Publishing to MQTT topic "home/node/sensor/rpi-pump/monitor, Data:{"info": {"timestamp": "2021-03-16T20:50:17-04:00", "rpi_model": "RPi 4 Model B r1.2", "ifaces": "e,w,b", "host_name": "pump", "fqdn": "pump", "ux_release": "buster", "ux_version": "5.4.79-v7l+", "up_time": "1 day, 3:07", "last_update": "2021-03-13T20:47:11-05:00", "fs_total_gb": 32, "fs_free_prcnt": 30, "networking": {"eth0": {"IP": "192.168.0.51", "mac": "dc:a6:32:92:b1:7d"}, "wlan0": {"mac": "dc:a6:32:92:b1:7e"}}, "drives": {"root": {"size_gb": 32, "used_prcnt": 30, "device": "/dev/root", "mount_pt": "/"}}, "memory": {"size_mb": "3827.926", "free_mb": "3448.867"}, "cpu": {"hardware": "BCM2711", "model": "ARMv7 Processor rev 3 (v7l)", "number_cores": 4, "bogo_mips": "1080.00", "serial": "10000000effdcc32"}, "throttle": ["throttled = 0x0", "Not throttled"], "temperature_c": 26.7, "temp_gpu_c": 26.7, "temp_cpu_c": 25.8, "reporter": "ISP-RPi-mqtt-daemon v1.5.4", "report_interval": 5}}"
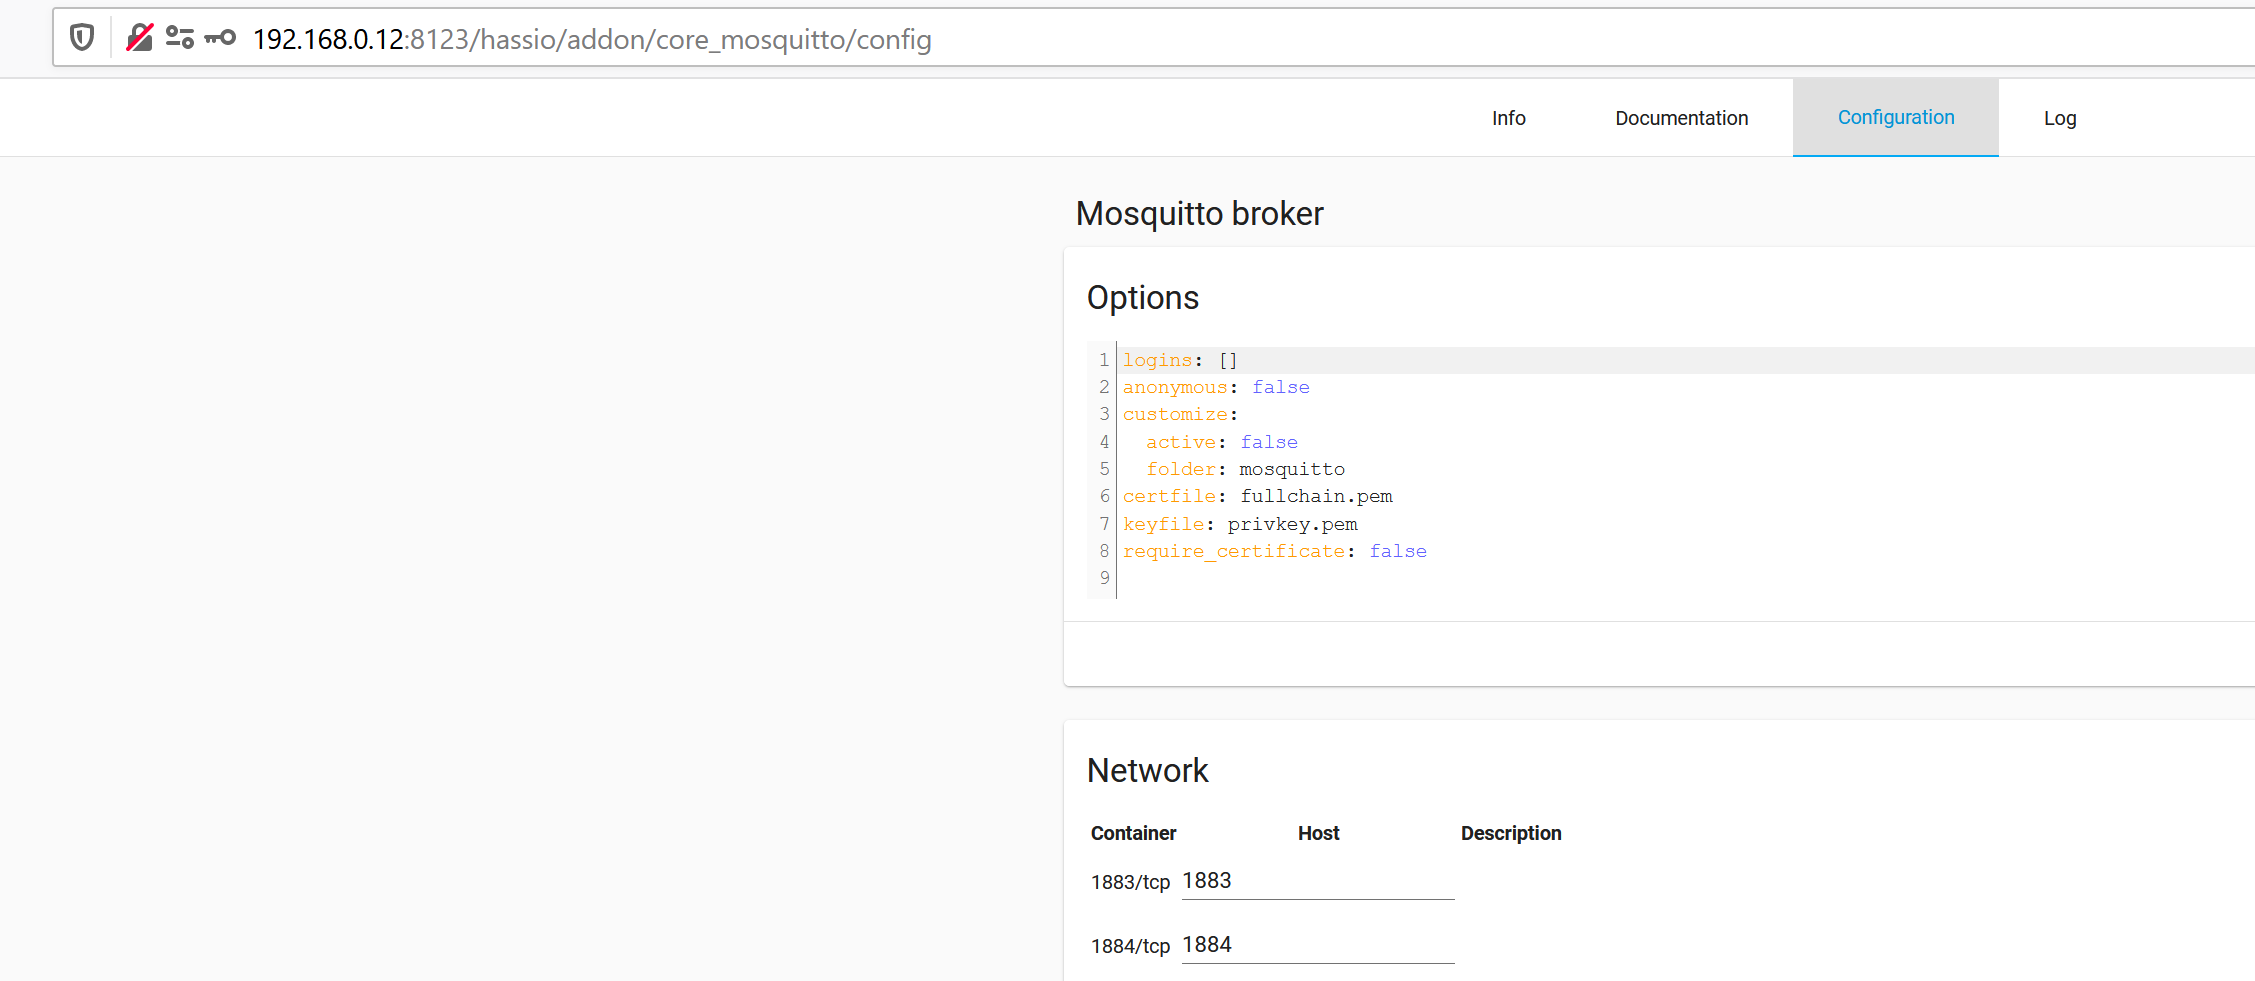
# The hostname or IP address of the MQTT broker to connect to (Default: localhost)
# Also read from the MQTT_HOSTNAME environment variable
#hostname = localhost
hostname = 192.168.0.12

# The TCP port the MQTT broker is listening on (Default: 1883)
# Also read from the MQTT_PORT environment variable
port = 1883

# Maximum period in seconds between ping messages to the broker. (Default: 60)
keepalive = 60

# by default Home Assistant listens to the /homeassistant but it can be changed for a given installation
#  likewise, by default this script advertises on the same default topic. If you use a different
#  discovery prefix then specify yours here.  [default: homeassistant]
discovery_prefix = homeassistant

# NOTE: The MQTT topic used for this device is constructed as:
#  {base_topic}/{sensor_name}
#
# The MQTT base topic under which to publish the Raspberry Pi sensor data topics.
base_topic = home/node

# The MQTT name for this Raspberry Pi as a sensor
sensor_name = rpi-pump
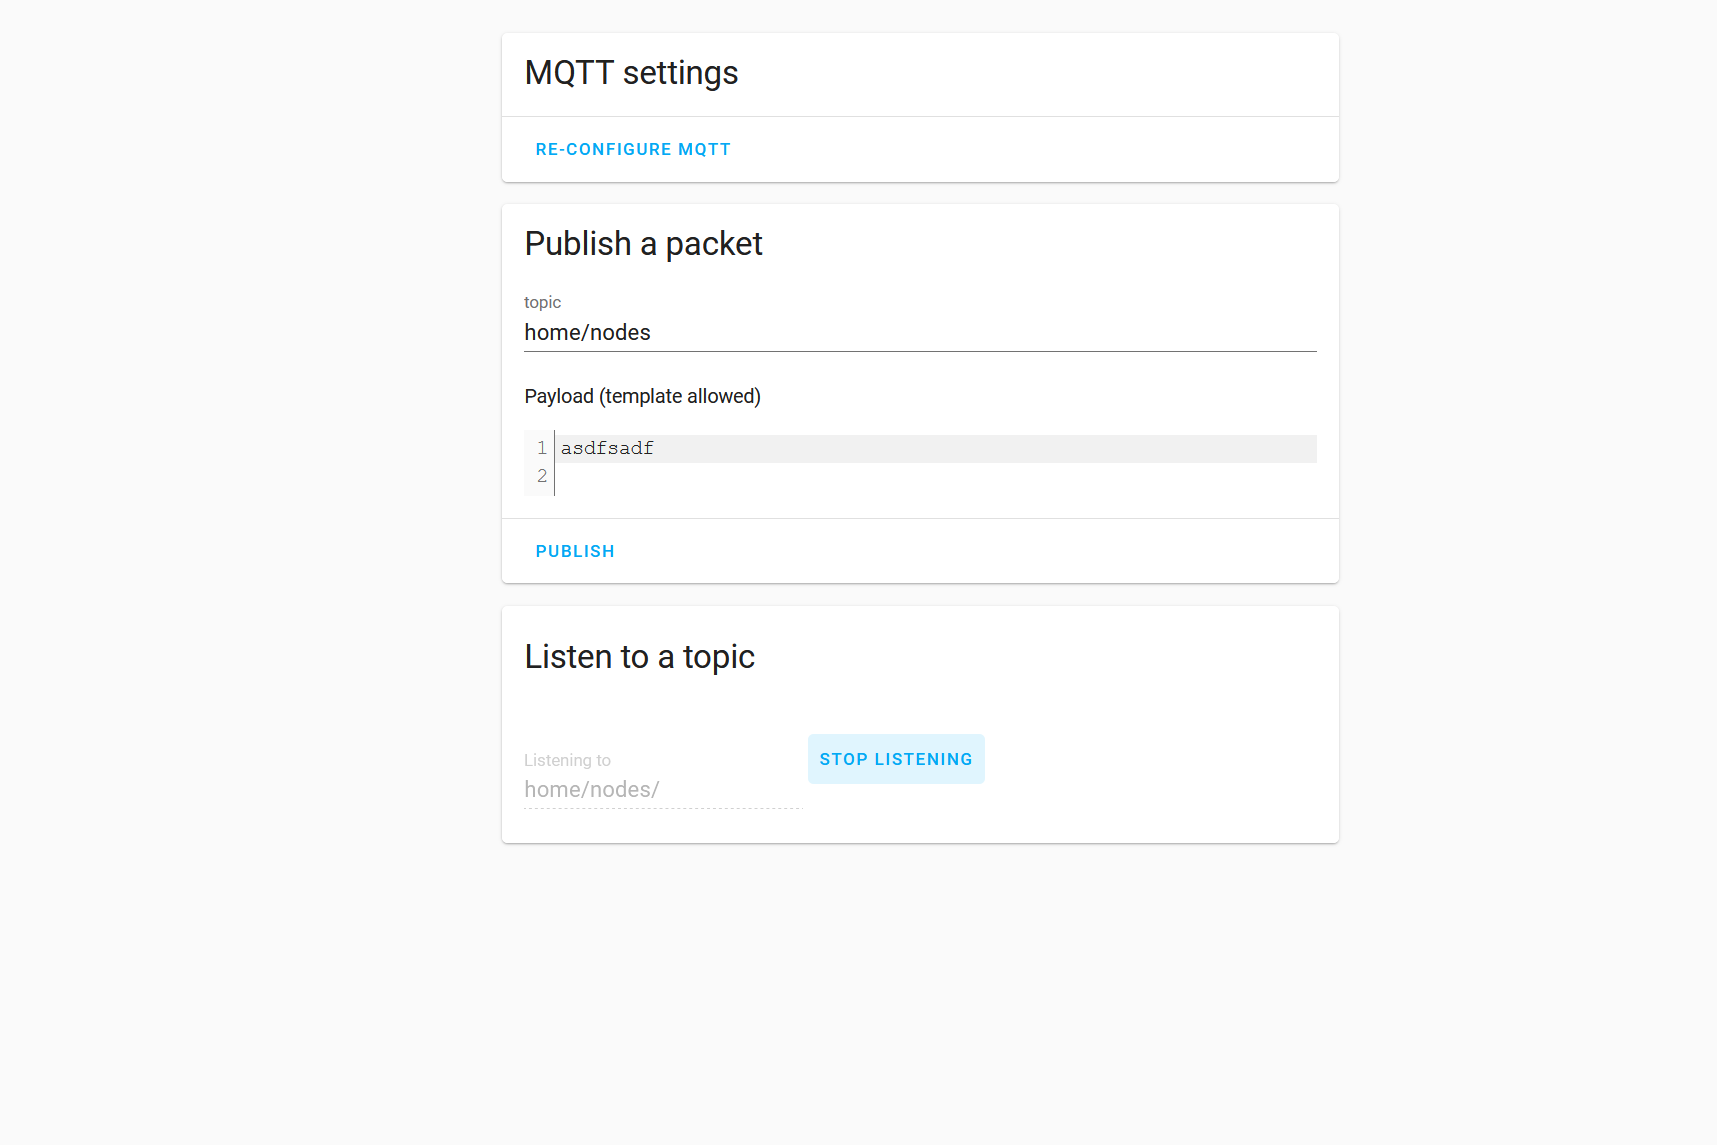
so i copied the topic
home/node/sensor/rpi-pump/monitor
and i pasted in start listening and restarted the pump python3 script and it does display
essage 1 received on home/node/sensor/rpi-pump/monitor at 10:17 PM:
{
    "info": {
        "timestamp": "2021-03-16T22:17:55-04:00",
        "rpi_model": "RPi 4 Model B r1.2",
        "ifaces": "e,w,b",
        "host_name": "pump",
        "fqdn": "pump",
        "ux_release": "buster",
        "ux_version": "5.4.79-v7l+",
        "up_time": "1 day,   4:34",
        "last_update": "2021-03-13T20:47:11-05:00",
        "fs_total_gb": 32,
        "fs_free_prcnt": 30,
        "networking": {
            "eth0": {
                "IP": "192.168.0.51",
                "mac": "dc:a6:32:92:b1:7d"
            },
            "wlan0": {
                "mac": "dc:a6:32:92:b1:7e"
            }
        },
        "drives": {
            "root": {
                "size_gb": 32,
                "used_prcnt": 30,
                "device": "/dev/root",
                "mount_pt": "/"
            }
        },
        "memory": {
            "size_mb": "3827.926",
            "free_mb": "3449.375"
        },
        "cpu": {
            "hardware": "BCM2711",
            "model": "ARMv7 Processor rev 3 (v7l)",
            "number_cores": 4,
            "bogo_mips": "1080.00",
            "serial": "10000000effdcc32"
        },
        "throttle": [
            "throttled = 0x0",
            "Not throttled"
        ],
        "temperature_c": 25.8,
        "temp_gpu_c": 25.8,
        "temp_cpu_c": 27.3,
        "reporter": "ISP-RPi-mqtt-daemon v1.5.4",
        "report_interval": 5
    }
}
QoS: 0 - Retain: false
but i dont know how to get it in tho the card or what else i supposed to add
Update:
nvm i figured it out i had to check the hacs and rpi monitor repository page
it doesnt like it using the default card had to do manual copy and paste
how do you do HA pi info?
how do you get it to add more settings on the card.
id like it to display
Total Memory and Memory Free
but only way to see is you gotta click one of the icons
how can i set it to display in the main card?
So, given that templates seem to be my weakness… I have been trying for a couple of hours to get anything useful from the Developer Tool/Template and have gotten nothing useful. How would one pull out and display the following section of data from the sensor?
networking:
  eth0:
    IP: 192.168.1.7
    mac: 'b8:27:eb:cf:56:03'
  wlan0:
    mac: 'b8:27:eb:9a:03:56'
I would really like to display the IP address for each interface on a card, does not even have to be the RPi card.
I have managed this template:
template: "{{(state_attr('sensor.rpi_monitor_genpi', 'networking')) }}"
It outputs:
template: "{'eth0': {'IP': '192.168.1.7', 'mac': 'b8:27:eb:cf:56:03'}, 'wlan0': {'mac': 'b8:27:eb:9a:03:56'}}"
But, I have been unable to break it down further to find out if one or both interfaces have an IP address and what it is.
Am I just hosed? I am trying to pull data from one of the drives attributes. The name of the attribute has a dash in it and I cannot get the template to work.
Template:
    extstorage:
      value_template: >
        {{ states.sensor.rpi_monitor_genpi.attributes.drives.media-haback.used_prcnt }}
This is valid according to the addon data set.
cpu:
bogo_mips: '307.20'
hardware: BCM2835
model: ARMv7 Processor rev 4 (v7l)
number_cores: 4
serial: 00000000bbcf5603

drives:
media-haback:
  device: /dev/sda5
  mount_pt: /media/haback
  size_gb: 8
  used_prcnt: 8
root:
  device: /dev/root
  mount_pt: /
  size_gb: 8
  used_prcnt: 30
This is the error that I get in the template editor:
UndefinedError: 'dict object' has no attribute 'media'
Notice it does not say media-haback?
Edit one of those cards that you created with the sun.sun entity and replace it with the entity of the RPi Monitor pump. After that all values should be displayed.
try this in your template:
template: "{{state_attr('sensor.rpi_monitor_genpi', 'networking').eth0.IP }}"
template: "{{state_attr('sensor.rpi_monitor_genpi', 'networking').wlan0.IP }}"
I successfully installed the Deamon on my Octoprint RPi.
But now I can’t figure out how I convert the JSON data to sensors. I tried to find something in the thread but found nothing (please point me to it, if my questions was already answered somwhere else):
In MQTT Explorer, I see the data is coming into the broker:
{"info": {"timestamp": "2021-07-06T22:29:05+01:00", "rpi_model": "RPi 4 Model B r1.4", "ifaces": "e,w,b", "host_name": "octopi", "fqdn": "octopi", "ux_release": "buster", "ux_version": "5.10.17-v7l+", "up_time": " 1:23", "last_update": "2021-07-06T22:13:20+01:00", "fs_total_gb": 32, "fs_free_prcnt": 11, "networking": {"eth0": {"mac": "[redacted]"}, "wlan0": {"IP": "[redacted]", "mac": "[redacted]"}}, "drives": {"root": {"size_gb": 32, "used_prcnt": 11, "device": "/dev/root", "mount_pt": "/"}}, "memory": {"size_mb": "7823.887", "free_mb": "7442.887"}, "cpu": {"hardware": "BCM2711", "model": "ARMv7 Processor rev 3 (v7l)", "number_cores": 4, "bogo_mips": "1080.00", "serial": "1000000096ca0d09", "load_1min_prcnt": 0.2, "load_5min_prcnt": 0.8, "load_15min_prcnt": 1.2}, "throttle": ["throttled = 0x0", "Not throttled"], "temperature_c": 43.8, "temp_gpu_c": 43.8, "temp_cpu_c": 43.3, "reporter": "ISP-RPi-mqtt-daemon v1.5.5", "report_interval": 5}}
I tried to add a sensor in the config.yaml:
  - platform: mqtt
    name: "Temp Octoprint"
    state_topic: "home/nodes/sensor/octoprint/monitor"
    unit_of_measurement: "°C"
I saw in the HA docs, that I need a value template(?). But I don’t know what this is and how to use it. Are there already sensor templates for those MQTT messages I can copy and paste?
Hi all,
My first post here and it’s about the integration of this great RPI Status card.
I’m a beginner with HA, running on a RPI4. I just started this week, but until now everything worked fine (thanks to documentation and youtube), so I’m happy  )
)
I use a lot of RPI ZeroW with Picamera and would like to monitor them.
I tried with the first one.
On the RPI, everything seems to be OK
rpime@RP01C01:/opt/RPi-Reporter-MQTT2HA-Daemon $ python3 /opt/RPi-Reporter-MQTT2HA-Daemon/ISP-RPi-mqtt-daemon.py --config /opt/RPi-Reporter-MQTT2HA-Daemon
[2021-08-19 11:56:44] * MQTT connection established
[2021-08-19 11:56:44]
[2021-08-19 11:56:45] Announcing RPi Monitoring device to MQTT broker for auto-discovery ...
[2021-08-19 11:56:47] Publishing to MQTT topic "home/nodes/sensor/rpi-RP01C01/monitor, Data:{"info": {"timestamp": "2021-08-19T11:56:45+02:00", "rpi_model": "RPi Zero W r1.1", "ifaces": "e,w,b", "host_name": "RP01C01", "fqdn": "RP01C01", "ux_release": "buster", "ux_version": "5.10.17+", "up_time": " 1:22", "last_update": "2021-08-19T11:04:43+02:00", "fs_total_gb": 32, "fs_free_prcnt": 7, "networking": {"wlan0": {"IP": "192.168.1.71", "mac": "b8:27:eb:b0:6d:b8"}}, "drives": {"root": {"size_gb": 32, "used_prcnt": 7, "device": "/dev/root", "mount_pt": "/"}}, "memory": {"size_mb": "366.652", "free_mb": "244.836"}, "cpu": {"hardware": "BCM2835", "model": "ARMv6-compatible processor rev 7 (v6l)", "number_cores": 2, "bogo_mips": "997.08", "serial": "0000000002e538ed", "load_1min_prcnt": 90.5, "load_5min_prcnt": 72.5, "load_15min_prcnt": 72.5}, "throttle": ["throttled = 0x0", "Not throttled"], "temperature_c": 60.5, "temp_gpu_c": 60.5, "temp_cpu_c": 60.5, "reporter": "ISP-RPi-mqtt-daemon v1.5.5", "report_interval": 5}}"
Traceback (most recent call last):
  File "/opt/RPi-Reporter-MQTT2HA-Daemon/ISP-RPi-mqtt-daemon.py", line 1465, in <module>
    sleep(10000)
The daemon running looks also to be OK
rpime@RP01C01:/ $ sudo systemctl status isp-rpi-reporter.service
● isp-rpi-reporter.service - RPi Reporter MQTT Client/Daemon
   Loaded: loaded (/opt/RPi-Reporter-MQTT2HA-Daemon/isp-rpi-reporter.service; enabled; vendor preset: enabled)
   Active: active (running) since Thu 2021-08-19 14:13:36 CEST; 34s ago
     Docs: https://github.com/ironsheep/RPi-Reporter-MQTT2HA-Daemon
 Main PID: 3616 (python3)
   Status: "Aug 19 14:13:35 - * MQTT connection established."
    Tasks: 4 (limit: 725)
   CGroup: /system.slice/isp-rpi-reporter.service
           └─3616 /usr/bin/python3 -u /opt/RPi-Reporter-MQTT2HA-Daemon/ISP-RPi-mqtt-daemon.py

août 19 14:13:30 RP01C01 systemd[1]: Starting RPi Reporter MQTT Client/Daemon...
août 19 14:13:36 RP01C01 systemd[1]: Started RPi Reporter MQTT Client/Daemon.
The ressource in HA is, from my point of view, also OK
HA logfile shows that the connection between HA and the rpi is OK from my understanding of the log file (.71 is the RPI IP)
1629375215: New connection from 192.168.1.71 on port 1883.
1629375215: New client connected from 192.168.1.71 as auto-E5C96EC3-A59B-6F8B-32E1-84C5EC3977F4 (p2, c1, k60).
But…
The entity is not displayed, so I cannot use the lovelace Card. After hours of checking different thing, the only one I maybe missed (I’m not sure if I need to do this and if yes how to do it) is the add in the ui_lovelace.yaml/ressource.yaml. None of them exists and the ressource is displayed, so I expect that it’s OK without this installation step.
Even if I tried to put this
- url: /hacsfiles/lovelace-rpi-monitor-card/rpi-monitor-card.js
  type: module
in the configuration.yaml file. I cannot save the file due to the following error
end of the stream or a document separator is expected at line 17, column 1:
    - url: /hacsfiles/lovelace-rpi-m ...
    ^
I have seen few posts above that question about the discovery : I didn’t change anything and until now, Every new entity was well discovered. Anyway, I tried to add
mqtt:
discovery: true
and reboot, but this didn’t change something.
Any advice is welcome.
Thanks in advance.
Hi,
Could you please explain what you have changed/added in the configuration file ?
Thanks
It’s been quite a while and I’ve shut down my homeassistant for 6mo while I moved. So, I’m not really sure which part you’re referring to, but here is my MQTT section
# MQTT broker
mqtt:
  broker: 10.1.1.2
  discovery: true
  discovery_prefix: homeassistant
Is this what you’re looking for?
Good question. I don’t know exactlly what I’m looking for 
As described aboce, I think I did all the installation/configuration steps in the right way. But I cannot see the raspberry in Home Assistant. So, I’m still seaking after a solution/explanation why.
I just saw that you had a similiar issue that was solved by :
Help? no, it was the answer I was looking for. Somehow I must have missed this in the instructions, but as soon as I configured MQTT in the configuration.yaml, everything worked!
Thank you so much!
That why I asked, because maybe it would solve my issue too
I suppose that the 10.1.1.2 is the HA server IP Address ?
Yes, that’s the pi server ip. At the time I installed it, I started with a pi server with NodeJS to get Sonos sound working. Later I added HA, so my system was slowly built over time. To get MQTT working I used this tutorial Installing the Mosquitto MQTT Server to the Raspberry Pi - Pi My Life Up.
After I moved, my pi server broke. I spent several days trying to fix it, but gave up and started over with a HASSIO image. I have the old flash disk so I can look at the files, but it’s not working, so the information I’ve provided is from memory. Basically, get the MQTT working on Pi, test from another sub computer somewhere. Once it’s all connected and working, the MQTT card just worked for me with no other work.
I still cannot bring it to work.
I will install another “client” pi ZeroW to check if it works for this one.
@FrenchYoda I’m late seeing your post. Let’s see if I can help. … can you better describe your context?
It looks like your RPi hostname is RP01C01 it’s IP is 192.168.1.71 a PI Zero running buster. No domain set. (may not be an issue, just noticing)
What is your HA host and its IP (RPi4?)
Where is your MQTT Broker running? (on which host with which IP?)
I"m running a small farm of RPi’s. My HA is on an RPi4 running the Mosquitto MQTT Broker daemon)
All my other RPis report to the broker on the HA RPi.
Also, I do have an RPi zero on my network and it’s also reporting well.