Oh, wait. Come to think of it: It seems you are putting a total m3 per day sensor in a graph that is supposed to show current flow (more likely L/h than m3). This graph is supposed to show a derivative of m3, which is 0 any time no gas is used, not the cumulative value. So I think when you say you use 0,6m3 (enough flow for a factory ![]() it could multiplying it by 1000, because it thinks L makes more sense.
it could multiplying it by 1000, because it thinks L makes more sense.
Very clear, thank you!
I have a battery charger from grid not from home . How do I add this to the code?
type: custom:energy-flow-card-plus
entities:
  battery:
    entity:
      consumption: sensor.0xa4c138964cf6ebd1_energy
      production: sensor.sun
  grid:
    entity:
      consumption: sensor.0xa4c138ef167976c6_energy_2
  solar:
    entity: sensor.sun
    display_zero_state: true
  home: {}
clickable_entities: true
display_zero_lines: true
use_new_flow_rate_model: true
energy_date_selection: true
wh_decimals: 2
kwh_decimals: 2
min_flow_rate: 1
max_flow_rate: 6
max_expected_energy: 2000
min_expected_energy: 10
wh_kwh_threshold: 1000
That’s not the power flow card.
I was thinking a 90deg clockwise rotation, then you could have the loads below the grid/pv/battery, where there would be more room to arrange them
I’ll take a look at the other card, thanks.
I was wondering if you can remove the line altogether? I have added ‘time till battery depleted’ and ‘time till battery charged’ but just want it floating there or connected to the battery.

hello! someone could point me to draw a chart for my RV (Recreational vehicle)?
My configuration is built with solar panels, battery bank lifepo4, battery charger.
Thanks a lot
Awesome! Thank you!
Would it be possible to use a sensor value in the (append to) item name? ![]() (or use a template just like for the secondary_info)
(or use a template just like for the secondary_info)
Hi,
Great card!
Is there a way to change the circle and font size?
Also has any one determined if we can substitute the icons for pictures?
Thanks in advance
It would be great for categorizing devices such as all individual radiators behind a main group/subfolder radiator.
Second that. On off grid installations as well.
Maybe you should try GitHub - molikk/mlk-power-flow-card: Power Flow Card by Molikk. A customizable Home Assistant card to emulate the Sunsynk System flow that's displayed on the Inverter screen.
Can anyone help me? I’m tearing my hair out!
I have the power flow card plus working but I think it’s best to explain my setup followed by what I’m trying to achieve.
I just want a Grid panel, Solar Panel and House Panel.
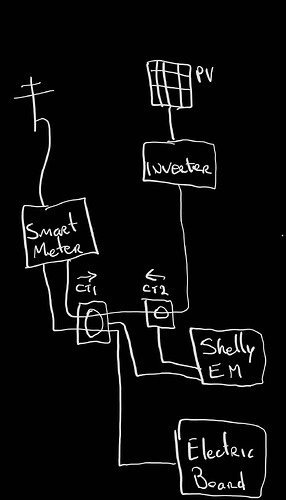
I have a ShellyEM with 2 clamps to monitor my usage. They are set up as shown.
[CT1 = ShellyEM Channel 1, CT2 = ShellyEM Channel 2)
Everything works fine in the Shelly App and in the HA Energy page.
What I want is to see real time usage, not daily overall like I natively get.

I would like to see exactly what I can see on the shelly cloud but in HA.
Can this card do this or should I look elsewhere?
How can I set this up?
The Shelly integration gives you both power and energy sensors. Make sure to use the power sensors.
I seem to have lost the visual editor… it just shows blank on the lhs when editing. The size of the panel is also very squat
Hi, what happens if:
- you set your browser to fullscreen (F11 key on your keyboard or somewhere in the browser menu)
- click on the title (x Power Flow Card Plus Card configuration) of the card to resize it
- refresh your browser session/clear the cache
![]()
![]()
![]()
Pieter you have saved my sanity and I am an idiot!
I have spent over a week of evenings trying to figure out what was going on!
Thank you!
That good ole Pieter!
I like people who know themselves… ![]()
Can someone please help me again!
Im so close but I still cant get the card to work properly!
As before i have CT1 around my mains and my solar. I have CT2 around my solar only. No matter what configuration i put into the card i cant get the values to make sense.
I thought i would be setting it up like this:
Grid: Combined Entity (as i only have 1 power entity i have no returned value)
ShellyEM Channel 1 (CT1)
Solar: ShellyEM Channel 2 (CT2)
House: ShellyEM Channel 1 (CT1)
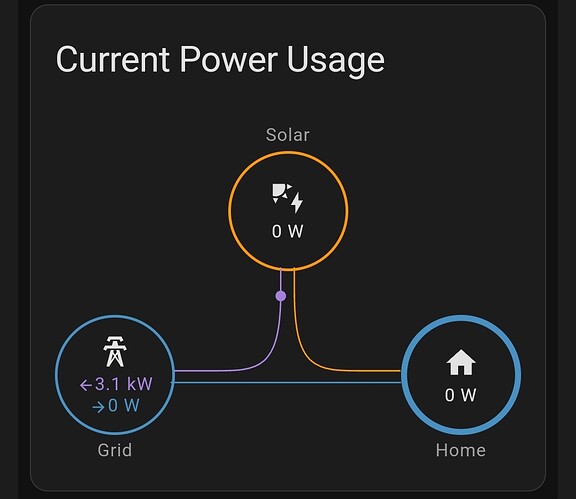
But when i do this i get incorrect values like this:
It is currently sunny so i should be generating 6.68kw (says the shelly app)
The house should be consuming some power but it should be coming from the solar while solar is also feeding back to the grid.
Where am i going wrong?
You need to split this, either by making a template sensor by subtracting the solar value to get a pure grid value, or change your clamp to measure grid separately.


