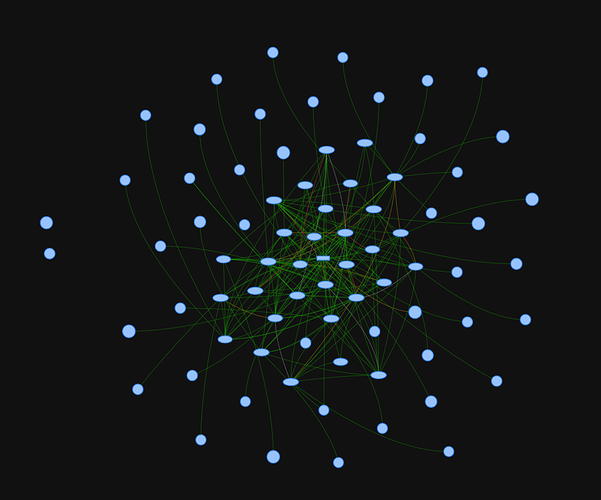
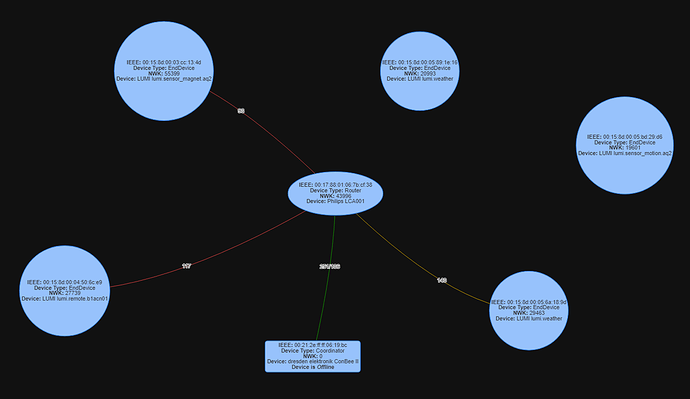
I think a useful measure of sensors connection quality is a combo of the LQI, RSSI and number of ‘packets or readings’ over time. This is were the data being shown on the in ‘near real time’ on the ZHA Network Card is really more helpful then the Network Graph. As the author states “This implementation leverages the ZHA websocket API to get ZHA device information instead of using hass.states.”
You want a RSSI value that is close as possible to zero and a LQI value as close as possible to 255. These in combo with, in the example of the Aqara Lumi temperature sensors, a consistent number of readings per period.
While the connections between zigbee devices in the map is interesting, these devices are constantly updating their routes and tables to find the ‘best’ path. An unless you are doing some peer to peer zigbee app, such as a switch directly connected to a light or socket, the connection between two zigbee devices others than a device to the coordinator is going to change over time and nothing you can really control. What you want is to know that you devices are connecting to the coordinator (as far as the coordinator is seeing the picture) with low RSSI and high LQI.
Good hunting! Happy New Year!
The two quotes below are from the Silicon Labs web site and might be helpful.
“The minimum and maximum LQI values (0x00 and 0xff) should be associated with the lowest and highest quality IEEE 802.15.4 signals detectable by the receiver, and LQ values in between should be uniformly distributed between these two limits. At least eight unique values of LQ shall be used.”
https://silabs-prod.adobecqms.net/content/usergenerated/asi/cloud/content/siliconlabs/en/community/wireless/zigbee-and-thread/knowledge-base/jcr:content/content/primary/blog/lqi_in_silicon_labs-vvSq.social.0.10.html
"There is no direct relationship between RSSI and LQI. In a quiet environment, LQI (reliability) will decrease as RSSI decreases. But if there is any interference, it is possible for LQI (reliability) to decrease with no change or an increase in RSSI. It is important to be aware that these are fundamentally different quantities, and therefore no direct equation can be applied to convert one value to the other.
Remember that LQI is measuring the reliability of a link to a particular neighboring radio, based on the BER (bit error rate) of the current packet. This is not a linear measurement, as link reliability tends to drop dramatically (almost logorithmically) as BER increases. RSSI readings simply measure peak amounts of radio energy on the channel over a given period, regardless of where that radio energy comes from."
https://www.silabs.com/community/wireless/zigbee-and-thread/knowledge-base.entry.html/2012/07/05/can_i_convert_lqiva-R42W
So I have three Aqara Lumi temperature sensors that I am testing with a Sonoff Tasmota Zigbee bridge. I average about two and a half readings per hour from each, see query and table below. Not a super science study as yet, but you can see the unit that has two walls between it and the coordinator has the lowest number of readings.
Now as soon as I can get the RSSI and LQI values for the devices over time, perhaps this will offer more insight. I have done a similar analysis for my 4 station mesh WiFi system and about 20 Bluetooth Low Energy sensors that I am currently using to monitor temperatures around the property. Seeing how devices behaved on the same 2.4 gHz region was interesting and useful for placing the BLE collector and WiFi hubs.
-- aqara lumi zigbee AS008 temperature, humidity, pressure sensors update frequency
select
  date_trunc('hour', last_updated),
  count(1)
from states_archive where (
last_updated > now() - interval '1 day'
AND
entity_id like 'sensor.lumi_lumi_weather_c205ca02_temperature')
group by 1;


