Hello in round,
First of all, I would like to briefly introduce myself, since this is my first post here:
My name is Hans Georg, I come from near Augsburg and I am a total beginner in the field of HA.
I already had a previous system to sniff via PI5 from the neighbour and after the first tests ran satisfactorily now a separate system on a 5 NUC and the setup basically also worked well.
I have integrated my two Deye WR as a start via the integration of David Rapan (GitHub - davidrapan/ha-solarman: ![]() Solarman Stick Logger integration for
Solarman Stick Logger integration for ![]() Home Assistant). It’s probably more designed for the WiFi logger, which I’m going over.
Home Assistant). It’s probably more designed for the WiFi logger, which I’m going over.
I would now like to feed the energy dashboard with data and since the two deye only output total or daily data, I grab the sensor data of PV power and battery power and separate them into positive and negative values and have templates for each.
So far, this works well and also results in sensible values.
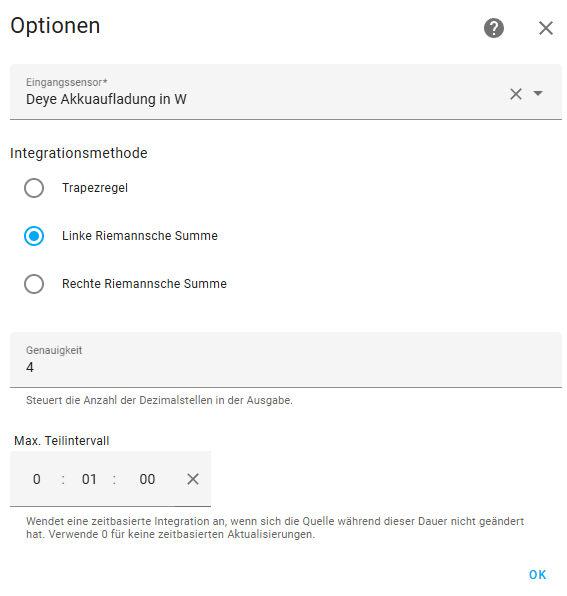
After that, it is converted into kWh via Riemann, the creation works so far, but unfortunately I seem to get cumulative values.
The same goes for the battery, you can see it well:

Upper curves is in blue the native value in positive and negative (negative = battery charging) in yellow my template sensor (only positive values for the charging) and below the apparently cumulative value that I want to use for the dashboard.
Measurement is also set in the template so that shouldn’t be the issue.
2nd post to follow (can’t upload more than 1 pic in the first post)