"mini-graph-card" & "history-graph": using a decluttering template

Realtime change of the graph:

Because of using "config-template-card", the graph card needs to be notified on every change of the sensors used for graphs. This notification is provided by the "entities" section inside the "config-template-card".

But there is a bad consequence - the graph blinks on every sensor’s change since the graph is being rebuilt by the "config-template-card".

To prevent this blinking, the “Realtime” flag may be used - presented by the "tmpl_INPUT_REALTIME" variable in the Template #2:

If this flag is ON, then the graph is always actual, but blinks on every change - and needs some time to display which may be too bothering on slow setups.
If this flag is OFF, then the graph needs to be refreshed manually by using F5 button (or another, depends on a browser).

How this flag works - look at the "entities" section of the "config-template-card":

states['[[tmpl_INPUT_REALTIME]]'].state === "on" ? '[[tmpl_SENSOR]]' : "sensor.service_zero_value"

If the flag is ON, then the sensor is listed as “to be monitored”, otherwise a zero sensor (which never changes) is monitored.

How to use the template: graphs based on history-graph (Template #1)

First let’s start with a graph for just one sensor:

  • based on "history-graph";
  • settings are default;
  • "hours_to_show" is NOT customizable - the Template #1 is used.

The sensor is for a value with a unit:

type: 'custom:decluttering-card'
template: decl_graph_stock
variables:
  - VALUE_HOURS_TO_SHOW: 24
  ##############
  - SENSOR: sensor.cleargrass_1_co2
  - VALUE_NAME: CO2

image
But actually for values with units I am going to use templates for "mini-graph-card" (my initial intention) - we’ll see it later.

Now let’s create a graph for several values w/o units:

type: 'custom:decluttering-card'
template: decl_graph_stock
variables:
  - VALUE_HOURS_TO_SHOW: 24
  ##############
  - SENSOR: sun.sun
  - VALUE_NAME: My sun
  ##############
  - SENSOR_2: sensor.night
  - VALUE_NAME_2: Night
  ##############
  - SENSOR_3: binary_sensor.iiyama_1_ping_availability_status
  - VALUE_NAME_3: PC available

image

Well, these examples could be easily implemented w/o any templates…

How to use the template: graphs based on history-graph with a customizable hours_to_show (Template #2):

type: 'custom:decluttering-card'
template: decl_graph_stock_tmpl
variables:
  - tmpl_INPUT_HOURS_TO_SHOW: input_select.graph_hours_to_show_test
  ##############
  - tmpl_SENSOR: sun.sun
  - tmpl_VALUE_NAME: My sun
  ##############
  - tmpl_SENSOR_2: sensor.night
  - tmpl_VALUE_NAME_2: Night
  ##############
  - tmpl_SENSOR_3: binary_sensor.iiyama_1_ping_availability_status
  - tmpl_VALUE_NAME_3: PC available

image
The value of "hours_to_show" is managed by a special input helper "input_select.graph_hours_to_show_test".

How to use the template: graphs based on mini-graph-card (Template #1):

Let’s start with a graph for just one sensor:

  • based on "mini-graph-card";
  • settings are default;
  • "hours_to_show" is NOT customizable - the Template #1 is used.
type: 'custom:decluttering-card'
template: decl_graph_stock
variables:
  - VALUE_HOURS_TO_SHOW: 24
  ##############
  - SENSOR: sensor.cleargrass_1_co2
  - VALUE_NAME: CO2

image

Let’s add some customization:

type: 'custom:decluttering-card'
template: decl_graph
variables:
  - VALUE_TITLE: CO2
  - VALUE_HOURS_TO_SHOW: 24
  - VALUE_SHOW_EXTREMA: true
  - VALUE_SHOW_AVERAGE: true
  ##############
  - SENSOR: sensor.cleargrass_1_co2
  - VALUE_NAME: CO2
  - VALUE_LINE_COLOR: red
  - VALUE_SHOW_STATE: false

image

That was a basic explanation with simple examples, then we’ll proceed with online customizable graphs (Template #2).

But before let’s compare these two graphs:

  • built w/o the template;
  • built with the template.
type: vertical-stack
cards:
  - type: 'custom:mini-graph-card'
    entities:
      - entity: sensor.cleargrass_1_co2
        name: CO2
        color: green
    name: CO2
    hours_to_show: 24
    points_per_hour: 60
    aggregate_func: last
    show:
      state: true
      graph: line
      points: false
      labels: true
    line_width: 1
    smoothing: false
  - type: 'custom:decluttering-card'
    template: decl_graph
    variables:
      - VALUE_TITLE: CO2
      - VALUE_HOURS_TO_SHOW: 24
      - SENSOR: sensor.cleargrass_1_co2
      - VALUE_NAME: CO2

image
These graphs look differently - and the reason is that in the 1st graph the "lower_bound" is set automatically, in the 2nd graph it is set to "~0".
Let’s set this property for the 1st graph - and these graphs will look same:

type: vertical-stack
cards:
  - type: 'custom:mini-graph-card'
    entities:
      - entity: sensor.cleargrass_1_co2
        name: CO2
        color: green
    name: CO2
    hours_to_show: 24
    points_per_hour: 60
    aggregate_func: last
    show:
      state: true
      graph: line
      points: false
      labels: true
    line_width: 1
    smoothing: false
    lower_bound: ~0
  - type: 'custom:decluttering-card'
    template: decl_graph
    variables:
      - VALUE_TITLE: CO2
      - VALUE_HOURS_TO_SHOW: 24
      - SENSOR: sensor.cleargrass_1_co2
      - VALUE_NAME: CO2

image

How to use the template: graphs based on mini-graph-card with online customizable settings (Template #2):

For one sensor:

type: 'custom:decluttering-card'
template: decl_graph_tmpl
variables:
  - tmpl_VALUE_TITLE: CO2
  - tmpl_INPUT_HOURS_TO_SHOW: input_select.graph_hours_to_show_test
  ##############
  - tmpl_SENSOR: sensor.cleargrass_1_co2
  - tmpl_VALUE_NAME: CO2

image


With some customization:

type: 'custom:decluttering-card'
template: decl_graph_tmpl
variables:
  - tmpl_VALUE_TITLE: CO2
  - tmpl_INPUT_HOURS_TO_SHOW: input_select.graph_hours_to_show_test
  - tmpl_INPUT_SHOW_EXTREMA: input_boolean.graph_show_extrema_test
  - tmpl_INPUT_SHOW_POINTS: input_boolean.graph_show_points_test
  - tmpl_VALUE_HEIGHT: 200
  - tmpl_VALUE_STATE_ADAPTIVE_COLOR: true
  ##############
  - tmpl_INPUT_REALTIME: input_boolean.graph_realtime_test
  ##############
  - tmpl_SENSOR: sensor.cleargrass_1_co2
  - tmpl_VALUE_NAME: CO2
  - tmpl_VALUE_LINE_COLOR: red

image


With color thresholds + some customization:

    type: 'custom:decluttering-card'
    template: decl_graph_tmpl
    variables:
      - tmpl_VALUE_TITLE: CO2
      - tmpl_INPUT_HOURS_TO_SHOW: input_select.graph_hours_to_show_test
      - tmpl_INPUT_SHOW_POINTS: input_boolean.graph_show_points_test
      - tmpl_INPUT_SHOW_EXTREMA: input_boolean.graph_show_extrema_test
      - tmpl_INPUT_SHOW_AVERAGE: input_boolean.graph_show_average_test
      - tmpl_VALUE_LOWER_BOUND: ~400
      - tmpl_VALUE_HEIGHT: 300
      ###################################################
      - tmpl_INPUT_REALTIME: input_boolean.graph_realtime_test
      ###################################################
      - tmpl_SENSOR: sensor.cleargrass_1_co2
      - tmpl_VALUE_NAME: CO2
      - tmpl_VALUE_LINE_COLOR: null
      ###################################################
      - tmpl_VALUE_COLOR_THRESHOLDS:
          - value: 450
            color: red
          - value: 500
            color: orange
          - value: 550
            color: yellow
          - value: 600
            color: green
          - value: 650
            color: cyan
          - value: 700
            color: blue
          - value: 750
            color: violet
          - value: 800
            color: black

image
Notes:

  1. The "tmpl_VALUE_LINE_COLOR" property must be set to "null" to enable color thresholds.
  2. Color thresholds are basically used when only one sensor is specified (not considering sensors for background graphs).

Minimal settings for 2 sensors:

type: 'custom:decluttering-card'
template: decl_graph_tmpl
variables:
  - tmpl_VALUE_TITLE: CO2
  - tmpl_INPUT_HOURS_TO_SHOW: input_select.graph_hours_to_show_test
  ################
  - tmpl_SENSOR: sensor.cleargrass_1_co2
  - tmpl_VALUE_NAME: CO2 (1)
  ################
  - tmpl_SENSOR_2: sensor.cleargrass_2_co2
  - tmpl_VALUE_NAME_2: CO2 (2)
  - tmpl_VALUE_SHOW_GRAPH_2: true
  - tmpl_VALUE_SHOW_STATE_2: true

image


More sensors + some customization:

type: 'custom:decluttering-card'
template: decl_graph_tmpl
variables:
  - tmpl_VALUE_TITLE: CO2
  - tmpl_INPUT_HOURS_TO_SHOW: input_select.graph_hours_to_show_test
  - tmpl_VALUE_SHOW_LEGEND: true
  - tmpl_VALUE_STATE_ADAPTIVE_COLOR: true
  ################
  - tmpl_INPUT_REALTIME: input_boolean.graph_realtime_test
  ################
  - tmpl_SENSOR: sensor.cleargrass_1_co2
  - tmpl_VALUE_NAME: CO2 (1)
  ################
  - tmpl_SENSOR_2: sensor.cleargrass_2_co2
  - tmpl_VALUE_NAME_2: CO2 (2)
  - tmpl_VALUE_SHOW_GRAPH_2: true
  - tmpl_VALUE_SHOW_STATE_2: true
  ################
  - tmpl_SENSOR_3: sensor.mijia_300_1_co2
  - tmpl_VALUE_NAME_3: CO2 (3)
  - tmpl_VALUE_SHOW_GRAPH_3: true
  - tmpl_VALUE_SHOW_STATE_3: true

image

With a background graph “Day / night”:

With minimal settings:

type: 'custom:decluttering-card'
template: decl_graph_tmpl
variables:
  - tmpl_VALUE_TITLE: CO2
  - tmpl_INPUT_HOURS_TO_SHOW: input_select.graph_hours_to_show_test
  ###############
  - tmpl_SENSOR: sensor.cleargrass_1_co2
  - tmpl_VALUE_NAME: CO2
  ###############
  - tmpl_SENSOR_BACK: sensor.night
  - tmpl_INPUT_SHOW_GRAPH_BACK: input_boolean.graph_show_night_test

image


With two background graphs - “Day / night” & “Available / unavailable”:

type: 'custom:decluttering-card'
template: decl_graph_tmpl
variables:
  - tmpl_VALUE_TITLE: CO2
  - tmpl_INPUT_HOURS_TO_SHOW: input_select.graph_hours_to_show_test
  ###############
  - tmpl_SENSOR: sensor.cleargrass_1_co2
  - tmpl_VALUE_NAME: CO2
  ###############
  - tmpl_SENSOR_BACK: sensor.night
  - tmpl_INPUT_SHOW_GRAPH_BACK: input_boolean.graph_show_night_air
  ###############
  - tmpl_SENSOR_BACK_2: sensor.cleargrass_1_availability_status_reversed
  - tmpl_INPUT_SHOW_GRAPH_BACK_2: input_boolean.service_true_value

image
Note: the 2nd background graph looks like a narrow stripe of red color in this example.


For two sensors with a background graph “Day / night”:

type: 'custom:decluttering-card'
template: decl_graph_tmpl
variables:
  - tmpl_VALUE_TITLE: CO2
  - tmpl_INPUT_HOURS_TO_SHOW: input_select.graph_hours_to_show_test
  ##################
  - tmpl_SENSOR: sensor.cleargrass_1_co2
  - tmpl_VALUE_NAME: CO2 (1)
  ##################
  - tmpl_SENSOR_2: sensor.cleargrass_2_co2
  - tmpl_VALUE_NAME_2: CO2 (2)
  - tmpl_VALUE_SHOW_GRAPH_2: true
  - tmpl_VALUE_SHOW_STATE_2: true
  ##################
  - tmpl_SENSOR_BACK: sensor.night
  - tmpl_INPUT_SHOW_GRAPH_BACK: input_boolean.graph_show_night_test

image

How to define sensors for background graphs:

"Day / night":
There are at least 3 methods:

  1. Using a "binary_sensor":
binary_sensor:
  - platform: template
    sensors:
      night:
        friendly_name: 'Night'
        icon_template: mdi:power-sleep
        value_template: "{% if is_state('sun.sun', 'above_horizon') -%}
                         {{ 'off' }}
                         {%- else -%}
                         {{ 'on' }}
                         {%- endif %}"

In this case you need to specify a "state_map" data:

      state_map:
        - value: 'off'
          label: 0
        - value: 'on'
          label: 1

But when using the "state_map", a Code Inspector’s log is flooded by messages like:

mini-graph-card: value [2] not found in state_map mini-graph-card-bundle.js:1:66925

This issue is discussed on Github.
P.S. Although the "state_map" property is supported by the template, I do not recommend using it because of these warning messages… Probably these warnings do not slow down a browser and do not make any other harm, but I just do not like seeing these messages in the Inspector.

  1. Using a “Times of the day” integration:
binary_sensor:
  - platform: tod
    name: Night_tod
    after: sunset
    before: sunrise

I decided not to use it - sometimes the sensor was not updated properly (discussed at least here & here). Probably it is already fixed but I am not sure - I have one "tod" sensor for some testing purpose and sometimes it seems like not updating properly…

  1. Using a "sensor":
sensor:
  - platform: template
    sensors:
      night:
        friendly_name: 'Night'
        icon_template: mdi:power-sleep
        value_template: "{% if is_state('sun.sun', 'above_horizon') -%}
                         {{ 0 | int }}
                         {%- else -%}
                         {{ 1 | int }}
                         {%- endif %}"

The easiest way, does not require the "state_map".
I decided to use this method.

"Available / unavailable":
This background graph shows whether some sensors are obtained from a properly working device or not.
How to define “the device is available” - depends on a particular device (using the "ping" integration, other methods).
Usually a result of availability check is a flag "true/false" ("on/off").
For making a background graph the result must be converted using a template sensor:

  • “available” → “0”;
  • “unavailable” → “1”.

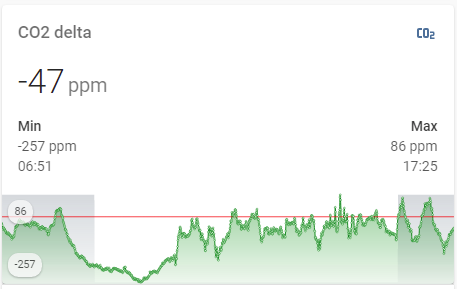
With a background graph “Day / night” + zero X-axis:

type: 'custom:decluttering-card'
template: decl_graph_tmpl
variables:
  - tmpl_VALUE_TITLE: CO2 delta
  - tmpl_INPUT_HOURS_TO_SHOW: input_select.graph_hours_to_show_test
  - tmpl_INPUT_SHOW_POINTS: input_boolean.graph_show_points_test
  - tmpl_INPUT_SHOW_EXTREMA: input_boolean.graph_show_extrema_test
  - tmpl_INPUT_REALTIME: input_boolean.graph_realtime_test
  ############
  - tmpl_SENSOR: sensor.calc_co2_diff_cg1_cg2
  - tmpl_VALUE_NAME: CO2 delta
  ############
  - tmpl_SENSOR_BACK: sensor.night
  - tmpl_INPUT_SHOW_GRAPH_BACK: input_boolean.graph_show_night_test
  ############
  - tmpl_VALUE_SHOW_GRAPH_X_AXIS: true

image
These graphs are useful for sensors which could have positive & negative values.

The first problem - trying to create a “bar” graph:

Intro:
I do not use “bar” graphs. I think they are not as accurate as usual “line” graphs.
Lets create 2 graphs for one sensor w/o using the template:

type: vertical-stack
cards:
  - type: 'custom:mini-graph-card'
    entities:
      - entity: sensor.cleargrass_1_co2
        name: CO2
    name: CO2
    hours_to_show: 24
    points_per_hour: 60
    aggregate_func: last
    show:
      state: true
      graph: line
      points: false
    line_width: 1
    smoothing: false
  - type: 'custom:mini-graph-card'
    entities:
      - entity: sensor.cleargrass_1_co2
        name: CO2
    name: CO2
    hours_to_show: 24
    points_per_hour: 60
    aggregate_func: last
    show:
      state: true
      graph: bar
    smoothing: false

image
The graphs are supposed to reflect a change of some value for 24 hours, every 1 minute (actual update interval of the data is about 30 sec).
These graphs look differently.

For 2 sensors the difference is more visible:

type: vertical-stack
cards:
  - type: 'custom:mini-graph-card'
    entities:
      - entity: sensor.cleargrass_1_co2
        name: CO2
      - entity: sensor.cleargrass_2_co2
        name: CO2
    name: CO2
    hours_to_show: 24
    points_per_hour: 60
    aggregate_func: last
    show:
      state: true
      graph: line
      points: false
    line_width: 1
    smoothing: false
  - type: 'custom:mini-graph-card'
    entities:
      - entity: sensor.cleargrass_1_co2
        name: CO2
      - entity: sensor.cleargrass_2_co2
        name: CO2
    name: CO2
    hours_to_show: 24
    points_per_hour: 60
    aggregate_func: last
    show:
      state: true
      graph: bar
    smoothing: false

I think that “bar” graphs are useful for sensors like:

  • a rarely updating sensor - for example, it is updated once per hour; so the “bar” graph for 24 hours will look like a “line” graph;
  • a sensor which is updated very often (like “every 1 minute”) but for which we do not need so accurate graph; for us it will be quite enough to see a graph for “every 1 hour for 24 hours”.

One more special case - using a "group_by" feature (like it is described here). Here the “bar” graph could be also appropriate.
And the more sensors you have on the card - the less precise the graph is.

So, my message is “I do not use bar graphs”.

But may I create “bar” graphs using the template?
Surely you can. Let’s do it:

type: vertical-stack
cards:
  - type: 'custom:decluttering-card'
    template: decl_graph
    variables:
      - VALUE_TITLE: CO2
      - VALUE_HOURS_TO_SHOW: 24
      - SENSOR: sensor.cleargrass_1_co2
      - VALUE_NAME: CO2
  - type: 'custom:decluttering-card'
    template: decl_graph
    variables:
      - VALUE_TITLE: CO2
      - VALUE_HOURS_TO_SHOW: 24
      - SENSOR: sensor.cleargrass_1_co2
      - VALUE_NAME: CO2
      - VALUE_GRAPH_TYPE: bar

image
First - the “bar” graph is less precise.
Second - why these bars are so wide???

Let’s simulate the same condition w/o the template.
The card below has 5 graphs (all w/o using the template):

  • one sensor, “line” graph;
  • one sensor, “bar” graph;
  • three sensors, “line” graph;
  • three sensors, “bar” graph;
  • three sensors (2 of them are not displayed), “bar” graph.
type: vertical-stack
cards:
  - type: 'custom:mini-graph-card'
    entities:
      - entity: sensor.cleargrass_1_co2
        name: CO2
        color: green
        show_graph: true
    name: CO2
    hours_to_show: 24
    points_per_hour: 60
    aggregate_func: last
    show:
      state: false
      graph: line
      points: false
      legend: false
    line_width: 1
    smoothing: false
  - type: 'custom:mini-graph-card'
    entities:
      - entity: sensor.cleargrass_1_co2
        name: CO2
        color: green
        show_graph: true
    name: CO2
    hours_to_show: 24
    points_per_hour: 60
    aggregate_func: last
    show:
      state: false
      graph: bar
      points: false
      legend: false
    line_width: 1
    smoothing: false
  - type: 'custom:mini-graph-card'
    entities:
      - entity: sensor.cleargrass_1_co2
        name: CO2-1
        color: green
        show_graph: true
      - entity: sensor.cleargrass_2_co2
        name: CO2-2
        color: orange
        show_graph: true
      - entity: sensor.mijia_300_1_co2
        name: CO2-3
        color: red
        show_graph: true
    name: CO2
    hours_to_show: 24
    points_per_hour: 60
    aggregate_func: last
    show:
      state: false
      graph: line
      points: false
      legend: false
    line_width: 1
    smoothing: false
  - type: 'custom:mini-graph-card'
    entities:
      - entity: sensor.cleargrass_1_co2
        name: CO2-1
        color: green
        show_graph: true
      - entity: sensor.cleargrass_2_co2
        name: CO2-2
        color: orange
        show_graph: true
      - entity: sensor.mijia_300_1_co2
        name: CO2-3
        color: red
        show_graph: true
    name: CO2
    hours_to_show: 24
    points_per_hour: 60
    aggregate_func: last
    show:
      state: false
      graph: bar
      points: false
      legend: false
    line_width: 1
    smoothing: false
  - type: 'custom:mini-graph-card'
    entities:
      - entity: sensor.cleargrass_1_co2
        name: CO2-1
        color: green
        show_graph: true
      - entity: sensor.cleargrass_2_co2
        name: CO2-2
        color: orange
        show_graph: false
      - entity: sensor.mijia_300_1_co2
        name: CO2-3
        color: red
        show_graph: false
    name: CO2
    hours_to_show: 24
    points_per_hour: 60
    aggregate_func: last
    show:
      state: false
      graph: bar
      points: false
      legend: false
    line_width: 1
    smoothing: false

The first two graphs are for one sensor - “line” & “bar” graphs:
image
Next two graphs are for three sensors - “line” & “bar” graphs:
image
And the most interesting case - a “bar” graph with 3 sensors (2 of them are not displayed):
image
We can see that bars for the 1st sensor occupies space which is supposed to be used by other 2 sensors - that is why these bars are so wide. I think this is a kind of bug: since some sensors are not displayed ("show_graph: false") the 1st sensor’s bars must be calculated like there is just one sensor in the card (i.e. like the 2nd graph described above).
That is why when using the template these bars are so wide - because the card has NINE sensors (6 sensors + 2 background graphs + 1 zero X-axis) - so the bars for ONE displayed graph occupy a space allocated for NINE sensors.

How to create nice “bar” graphs with the template?
The template which supports “6 sensors + 2 background graphs + 1 zero X-axis” must be rewritten into one more template “1 sensor”.

Reduced templates for “bar” graphs:

How to create reduced templates:
We know how to create templates for “6 sensors + 2 background graphs + 1 zero X-axis” - it is descibed above:

These templates work fine.
But when trying to create “bar” graphs we got bad results.

Now let’s create these reduced templates:

  • for one sensor (Template #1, Template #2);
  • for two sensors (Template #1, Template #2);
  • for three sensors (Template #1, Template #2).

These templates are supposed to be used only for “bar” graphs. I think that maximum 3 sensors must be enough for “bars” since “the more sensors - the less precision”. And because of clear reasons these templates do not support background graphs & zero X-axis.

Place this code in the same yaml-file as Template #1 (required for anchors):

decl_graph_1:
  default: *decl_graph_default
  card:
    <<: *decl_card_settings
    entities:
      - *decl_graph_entities_1
##################################################################
decl_graph_2:
  default: *decl_graph_default
  card:
    <<: *decl_card_settings
    entities:
      - *decl_graph_entities_1
      - *decl_graph_entities_2
##################################################################
decl_graph_3:
  default: *decl_graph_default
  card:
    <<: *decl_card_settings
    entities:
      - *decl_graph_entities_1
      - *decl_graph_entities_2
      - *decl_graph_entities_3

The 2nd template (based on "config-template-card") also must be placed in the same yaml-file as Template #2 (required for anchors):

decl_graph_1_tmpl:
  default: *decl_graph_tmpl_default
  card:
    type: custom:config-template-card
    variables: *decl_graph_variables
    entities: *decl_graph_tmpl_entities
    card:
      type: custom:decluttering-card
      template: decl_graph_1
      variables: *decl_graph_tmpl_call_variables
###############################################################################
decl_graph_2_tmpl:
  default: *decl_graph_tmpl_default
  card:
    type: custom:config-template-card
    variables: *decl_graph_variables
    entities: *decl_graph_tmpl_entities
    card:
      type: custom:decluttering-card
      template: decl_graph_2
      variables: *decl_graph_tmpl_call_variables
###############################################################################
decl_graph_3_tmpl:
  default: *decl_graph_tmpl_default
  card:
    type: custom:config-template-card
    variables: *decl_graph_variables
    entities: *decl_graph_tmpl_entities
    card:
      type: custom:decluttering-card
      template: decl_graph_3
      variables: *decl_graph_tmpl_call_variables

How to use these reduced templates:
Like it is described here:

type: vertical-stack
cards:
  - type: 'custom:decluttering-card'
    template: decl_graph
    variables:
      - VALUE_TITLE: CO2
      - VALUE_HOURS_TO_SHOW: 24
      - SENSOR: sensor.cleargrass_1_co2
      - VALUE_NAME: CO2
  - type: 'custom:decluttering-card'
    template: decl_graph_1
    variables:
      - VALUE_TITLE: CO2
      - VALUE_HOURS_TO_SHOW: 24
      - SENSOR: sensor.cleargrass_1_co2
      - VALUE_NAME: CO2
      - VALUE_GRAPH_TYPE: bar

image
For two sensors:

type: vertical-stack
cards:
  - type: 'custom:decluttering-card'
    template: decl_graph
    variables:
      - VALUE_TITLE: CO2
      - VALUE_HOURS_TO_SHOW: 24
      - SENSOR: sensor.cleargrass_1_co2
      - VALUE_NAME: CO2-1
      - SENSOR_2: sensor.cleargrass_2_co2
      - VALUE_NAME: CO2-2
      - VALUE_SHOW_GRAPH_2: true
      - VALUE_SHOW_STATE_2: true
  - type: 'custom:decluttering-card'
    template: decl_graph_2
    variables:
      - VALUE_TITLE: CO2
      - VALUE_HOURS_TO_SHOW: 24
      - SENSOR: sensor.cleargrass_1_co2
      - VALUE_NAME: CO2-1
      - SENSOR_2: sensor.cleargrass_2_co2
      - VALUE_NAME: CO2-2
      - VALUE_SHOW_GRAPH_2: true
      - VALUE_SHOW_STATE_2: true
      - VALUE_GRAPH_TYPE: bar

image

Settings for graphs:

Which settings are required:
The following settings may be used to customize graphs:

  • hours_to_show;
  • show_extrema;
  • show_average;
  • show_points;
  • show background graphs (separately for background #1, background #2);
  • “Realtime” flag.

Since each Lovelace view may be dedicated for showing data for some particular device (or a set of devices) or for some particular area, it may be convenient to have a unique set of settings for each device (set of devices) or area.
Examples:

  • settings for all network equipment (routers, switches);
  • settings for the air humidifier;
  • settings for all climate equipment.

Each setting is managed by a corresponding input helper (below examples for climate equipment are provided):

  1. "input_select.graph_hours_to_show_climate"
input_select:
  graph_hours_to_show_climate:
    name: 'input_graph: climate: hours_to_show'
    options:
      - 1
      - 2
      - 4
      ...
      - 66
      - 72
    icon: mdi:clock-start
  1. "input_boolean.graph_show_extrema_climate"
input_boolean:
  graph_show_extrema_climate:
    name: 'input_graph: climate: show_extrema'
    icon: mdi:arrow-up-down
  1. "input_boolean.graph_show_average_climate"
input_boolean:
  graph_show_average_climate:
    name: 'input_graph: climate: show_average'
    icon: mdi:format-align-middle
  1. "input_boolean.graph_show_points_climate"
input_boolean:
  graph_show_points_climate:
    name: 'input_graph: climate: show_points'
    icon: mdi:target
  1. "input_boolean.graph_realtime_climate"
input_boolean:
  graph_realtime_climate:
    name: 'input_graph: realtime_climate'
    icon: mdi:chart-areaspline
  1. "input_boolean.graph_show_ping_availability_climate", "input_boolean.graph_show_night_climate"
input_boolean:
  graph_show_ping_availability_climate:
    name: 'input_graph: climate: show_ping_availability'
    icon: mdi:server

  graph_show_night_climate:
    name: 'input_graph: climate: show_night'
    icon: mdi:server

How to manage the settings via GUI:
Since each Lovelace view may be dedicated for showing data for some particular device (or a set of devices) or for some particular area, it may be convenient to have a possibility to manage these settings directly on the view (not on some separate view), like this:


Using this approach, each view containing graphs can have its own possibility to manage these graphs.

For changing settings, a card may be used.
Since these settings may be similar for each view, it is a good idea to have a "decluttering-card":

  decl_graph_settings:
    default:
      - INPUT_NEW_STYLE: input_boolean.service_true_value
      - SHOW__SHOW_EXTREMA: input_boolean.service_true_value
      - SHOW__SHOW_AVERAGE: input_boolean.service_false_value
      - SHOW__SHOW_POINTS: input_boolean.service_true_value
      - SHOW__BACK: input_boolean.service_false_value
      - BACK_NAME: Day / night
      - SHOW__BACK_2: input_boolean.service_false_value
      - SHOW__REALTIME: input_boolean.service_true_value
    card:
      type: entities
      entities:
        - type: 'custom:fold-entity-row'
          head:
            entity: '[[INPUT_HOURS_TO_SHOW]]'
            name: Hours to show
            tap_action: none
          padding: 0
          open: false
          clickable: false
          entities:
            - type: conditional
              conditions:
                - entity: '[[INPUT_NEW_STYLE]]'
                  state: 'on'
                - entity: '[[SHOW__SHOW_EXTREMA]]'
                  state: 'on'
              row:
                entity: '[[INPUT_SHOW_EXTREMA]]'
                name: Min / max value
                state_color: true
                tap_action: none
            - type: conditional
              conditions:
                - entity: '[[INPUT_NEW_STYLE]]'
                  state: 'on'
                - entity: '[[SHOW__SHOW_AVERAGE]]'
                  state: 'on'
              row:
                entity: '[[INPUT_SHOW_AVERAGE]]'
                name: Average value
                state_color: true
                tap_action: none
            - type: conditional
              conditions:
                - entity: '[[INPUT_NEW_STYLE]]'
                  state: 'on'
                - entity: '[[SHOW__SHOW_POINTS]]'
                  state: 'on'
              row:
                entity: '[[INPUT_SHOW_POINTS]]'
                name: Show points
                state_color: true
                tap_action: none
            - type: conditional
              conditions:
                - entity: '[[INPUT_NEW_STYLE]]'
                  state: 'on'
                - entity: '[[SHOW__BACK]]'
                  state: 'on'
              row:
                entity: '[[INPUT_SHOW_BACK]]'
                name: '[[BACK_NAME]]'
                state_color: true
                tap_action: none
            - type: conditional
              conditions:
                - entity: '[[INPUT_NEW_STYLE]]'
                  state: 'on'
                - entity: '[[SHOW__BACK_2]]'
                  state: 'on'
              row:
                entity: '[[INPUT_SHOW_BACK_2]]'
                name: '[[BACK_NAME_2]]'
                state_color: true
                tap_action: none
        - type: conditional
          conditions:
            - entity: '[[SHOW__REALTIME]]'
              state: 'on'
          row:
            entity: '[[INPUT_REALTIME]]'
            name: Realtime graphs
            state_color: true
            tap_action: none
      show_header_toggle: false
      title: '[[TITLE]]'

Notes:

  1. The template can manage settings for "mini-graph-card" & "history-graph" card - depends on the "INPUT_NEW_STYLE" input variable (defines whether "mini-graph-style" or "history-graph" is managed).
    For this variable the default value is specified - "input_boolean.service_true_value" (means that the settings are for "mini-graph-style"):
input_boolean:
  service_true_value:
    name: "Service: true value"
    icon: mdi:plus-one
    initial: true

This entity must not be changed via GUI, must be always "true".

  1. Some settings are available only for "mini-graph-card" (“new style”), that is why the “Conditional card” is used.

  2. Each setting is displayed if it is “enabled” - i.e. the corresponding flag "SHOW__xxxx" is set to "input_boolean.service_true_value" which is always “ON” (or “True”).
    To disable some setting, use "input_boolean.service_false_value":

input_boolean:
  service_false_value:
    name: "Service: false value"
    icon: mdi:null
    initial: false

Also, some settings are enabled by default, some settings are disabled by default - check the "default" section of the decluttering template.

  1. The decluttering template allows to select TWO background graphs - for example, “Day / night” and “Available / unavailable”. To enable this feature, the "SHOW__BACK" & "SHOW__BACK_2" must be specified as per this example:
  - SHOW__BACK: input_boolean.service_true_value

Examples of use:
Example of use #1 - settings for graphs with the “Day / night” background, w/o the “Realtime” flag, w/o a title:

type: 'custom:decluttering-card'
template: decl_graph_settings
variables:
  - TITLE: ''
  - INPUT_HOURS_TO_SHOW: input_select.graph_hours_to_show_test
  - INPUT_SHOW_EXTREMA: input_boolean.graph_show_extrema_test
  - INPUT_SHOW_POINTS: input_boolean.graph_show_points_test
  - SHOW__BACK: input_boolean.service_true_value
  - INPUT_SHOW_BACK: input_boolean.graph_show_night_test
  - SHOW__REALTIME: input_boolean.service_false_value

Pictures of the settings card are provided below.
Collapsed view:
image
Expanded view:
image

Example of use #2:

type: 'custom:decluttering-card'
template: decl_graph_settings
variables:
  - TITLE: Settings
  - INPUT_HOURS_TO_SHOW: input_select.graph_hours_to_show_test
  - INPUT_SHOW_EXTREMA: input_boolean.graph_show_extrema_test
  - SHOW__SHOW_AVERAGE: input_boolean.service_true_value
  - INPUT_SHOW_AVERAGE: input_boolean.graph_show_average_test
  - INPUT_SHOW_POINTS: input_boolean.graph_show_points_test
  - SHOW__BACK: input_boolean.service_true_value
  - INPUT_SHOW_BACK: input_boolean.graph_show_ping_availability_host
  - BACK_NAME: Availablity (ping)
  - SHOW__BACK_2: input_boolean.service_true_value
  - INPUT_SHOW_BACK_2: input_boolean.graph_show_integration_availability_host
  - BACK_NAME_2: Availablity (Netdata)
  - INPUT_REALTIME: input_boolean.graph_realtime_test

This example provides settings for graphs for some PC (for statistical data like “CPU load”, “RAM usage” etc) including showing average value & two backgrounds:

  • availability of this PC (ping);
  • availability of Netdata node on this PC (source of statistical data).

Pictures of the settings card are provided below.
Collapsed view:
image
Expanded view:
image

Example of use #3 - a reduced set of settings for graphs w/o showing extrema values, w/o a background, w/o the “Realtime” graph:

type: 'custom:decluttering-card'
template: decl_graph_settings
variables:
  - TITLE: Settings
  - INPUT_HOURS_TO_SHOW: input_select.graph_hours_to_show_test
  - SHOW__SHOW_EXTREMA: input_boolean.service_false_value
  - INPUT_SHOW_POINTS: input_boolean.graph_show_points_test
  - SHOW__REALTIME: input_boolean.service_false_value

Pictures of the settings card are provided below.
Collapsed view:
image
Expanded view:
image

Example of use #4 - settings for "history-graph":

type: 'custom:decluttering-card'
template: decl_graph_settings
variables:
  - TITLE: Settings
  - INPUT_HOURS_TO_SHOW: input_select.graph_hours_to_show_test
  - INPUT_NEW_STYLE: input_boolean.service_false_value
  - INPUT_REALTIME: input_boolean.graph_realtime_test

Picture of the settings card is provided below (same for collapsed & expanded view):
image

How to show only extrema and/or average values:

It is rather convenient to see extrema and/or average values right in the graph:
image

But sometimes it is required to have 2 or more graphs on the card - in this case displaying extrema/average values is possible for only one sensor, which is confusing.
By using this template it is possible to display extrema/average values on a separate card, so you may display a mini-graph-card with 3 graphs and 3 small cards below stacked vertically:
image
Here is a code:

      type: custom:decluttering-card
      template: decl_graph_tmpl
      variables:
        - tmpl_VALUE_TITLE: ... some title ...
        - tmpl_INPUT_HOURS_TO_SHOW: ...
        - tmpl_INPUT_SHOW_EXTREMA: input_boolean.service_true_value
        - tmpl_INPUT_SHOW_AVERAGE: input_boolean.service_true_value
        - tmpl_VALUE_GRAPH_TYPE: false
        - tmpl_INPUT_REALTIME: ...
        - tmpl_VALUE_COMPACT_MIN_MAX_AVG_INFO: ... true or false ...
        ##############################################################
        - tmpl_SENSOR: ... some sensor...
        - tmpl_VALUE_NAME: ''
        - tmpl_VALUE_SHOW_STATE: false

The tmpl_VALUE_COMPACT_MIN_MAX_AVG_INFO variable is used to make fonts for extrema/average values smaller. Surely it may be used in a “usual graphs” (i.e. graphs with a curve & extrema/average values).
A small example: I needed these graphs to be stacked horizontally, so I applied this “small font” style.
image

reserved post

1 Like

reserved post

Can you show me an example of code without the decluttering template?

These examples you can find in the mini-graph-card community thread.
The whole idea of using decluttering templates was to simplify building graphs.

1 Like

Looked there, but I did not find an example, if suddenly, you have a link, please share, while I look at the whole topic again.

What do you want to achieve exactly?

Also, why do you need a “pure mini-graph-code” w/o templates? If you need it for learning purpose, probably it will be very useful to read the template’s code since it contains lots of features.
If it is difficult for you, then I will try to prepare these examples. Depends on what you need.

Spent some time, created additional sensors and I did what I wanted. Thanks so much for the idea, and the help.