Settings for graphs:
Which settings are required:
The following settings may be used to customize graphs:
- hours_to_show;
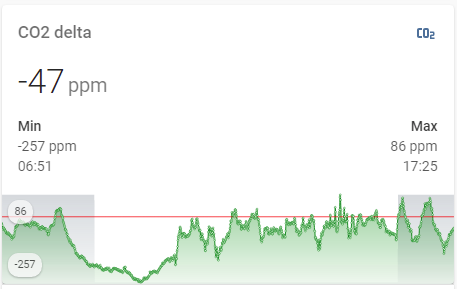
- show_extrema;
- show_average;
- show_points;
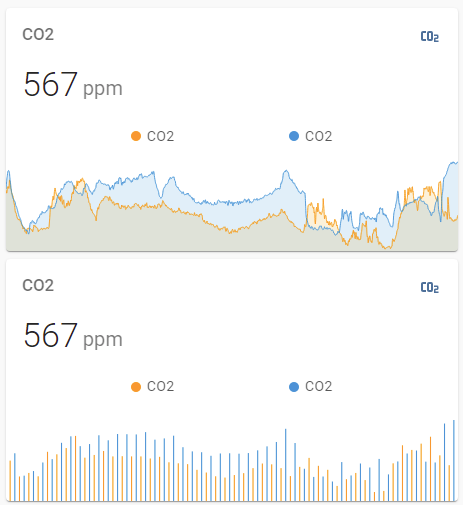
- show background graphs (separately for background #1, background #2);
-
“Realtime” flag.
Since each Lovelace view may be dedicated for showing data for some particular device (or a set of devices) or for some particular area, it may be convenient to have a unique set of settings for each device (set of devices) or area.
Examples:
- settings for all network equipment (routers, switches);
- settings for the air humidifier;
- settings for all climate equipment.
Each setting is managed by a corresponding input helper (below examples for climate equipment are provided):
"input_select.graph_hours_to_show_climate"
input_select:
graph_hours_to_show_climate:
name: 'input_graph: climate: hours_to_show'
options:
- 1
- 2
- 4
...
- 66
- 72
icon: mdi:clock-start
"input_boolean.graph_show_extrema_climate"
input_boolean:
graph_show_extrema_climate:
name: 'input_graph: climate: show_extrema'
icon: mdi:arrow-up-down
"input_boolean.graph_show_average_climate"
input_boolean:
graph_show_average_climate:
name: 'input_graph: climate: show_average'
icon: mdi:format-align-middle
"input_boolean.graph_show_points_climate"
input_boolean:
graph_show_points_climate:
name: 'input_graph: climate: show_points'
icon: mdi:target
"input_boolean.graph_realtime_climate"
input_boolean:
graph_realtime_climate:
name: 'input_graph: realtime_climate'
icon: mdi:chart-areaspline
-
"input_boolean.graph_show_ping_availability_climate", "input_boolean.graph_show_night_climate"
input_boolean:
graph_show_ping_availability_climate:
name: 'input_graph: climate: show_ping_availability'
icon: mdi:server
graph_show_night_climate:
name: 'input_graph: climate: show_night'
icon: mdi:server
How to manage the settings via GUI:
Since each Lovelace view may be dedicated for showing data for some particular device (or a set of devices) or for some particular area, it may be convenient to have a possibility to manage these settings directly on the view (not on some separate view), like this:
Using this approach, each view containing graphs can have its own possibility to manage these graphs.
For changing settings, a card may be used.
Since these settings may be similar for each view, it is a good idea to have a "decluttering-card":
decl_graph_settings:
default:
- INPUT_NEW_STYLE: input_boolean.service_true_value
- SHOW__SHOW_EXTREMA: input_boolean.service_true_value
- SHOW__SHOW_AVERAGE: input_boolean.service_false_value
- SHOW__SHOW_POINTS: input_boolean.service_true_value
- SHOW__BACK: input_boolean.service_false_value
- BACK_NAME: Day / night
- SHOW__BACK_2: input_boolean.service_false_value
- SHOW__REALTIME: input_boolean.service_true_value
card:
type: entities
entities:
- type: 'custom:fold-entity-row'
head:
entity: '[[INPUT_HOURS_TO_SHOW]]'
name: Hours to show
tap_action: none
padding: 0
open: false
clickable: false
entities:
- type: conditional
conditions:
- entity: '[[INPUT_NEW_STYLE]]'
state: 'on'
- entity: '[[SHOW__SHOW_EXTREMA]]'
state: 'on'
row:
entity: '[[INPUT_SHOW_EXTREMA]]'
name: Min / max value
state_color: true
tap_action: none
- type: conditional
conditions:
- entity: '[[INPUT_NEW_STYLE]]'
state: 'on'
- entity: '[[SHOW__SHOW_AVERAGE]]'
state: 'on'
row:
entity: '[[INPUT_SHOW_AVERAGE]]'
name: Average value
state_color: true
tap_action: none
- type: conditional
conditions:
- entity: '[[INPUT_NEW_STYLE]]'
state: 'on'
- entity: '[[SHOW__SHOW_POINTS]]'
state: 'on'
row:
entity: '[[INPUT_SHOW_POINTS]]'
name: Show points
state_color: true
tap_action: none
- type: conditional
conditions:
- entity: '[[INPUT_NEW_STYLE]]'
state: 'on'
- entity: '[[SHOW__BACK]]'
state: 'on'
row:
entity: '[[INPUT_SHOW_BACK]]'
name: '[[BACK_NAME]]'
state_color: true
tap_action: none
- type: conditional
conditions:
- entity: '[[INPUT_NEW_STYLE]]'
state: 'on'
- entity: '[[SHOW__BACK_2]]'
state: 'on'
row:
entity: '[[INPUT_SHOW_BACK_2]]'
name: '[[BACK_NAME_2]]'
state_color: true
tap_action: none
- type: conditional
conditions:
- entity: '[[SHOW__REALTIME]]'
state: 'on'
row:
entity: '[[INPUT_REALTIME]]'
name: Realtime graphs
state_color: true
tap_action: none
show_header_toggle: false
title: '[[TITLE]]'
Notes:
- The template can manage settings for
"mini-graph-card" & "history-graph" card - depends on the "INPUT_NEW_STYLE" input variable (defines whether "mini-graph-style" or "history-graph" is managed).
For this variable the default value is specified - "input_boolean.service_true_value" (means that the settings are for "mini-graph-style"):
input_boolean:
service_true_value:
name: "Service: true value"
icon: mdi:plus-one
initial: true
This entity must not be changed via GUI, must be always "true".
-
Some settings are available only for "mini-graph-card" (“new style”), that is why the “Conditional card” is used.
-
Each setting is displayed if it is “enabled” - i.e. the corresponding flag "SHOW__xxxx" is set to "input_boolean.service_true_value" which is always “ON” (or “True”).
To disable some setting, use "input_boolean.service_false_value":
input_boolean:
  service_false_value:
    name: "Service: false value"
    icon: mdi:null
    initial: false
Also, some settings are enabled by default, some settings are disabled by default - check the "default" section of the decluttering template.
- The decluttering template allows to select TWO background graphs - for example, “Day / night” and “Available / unavailable”. To enable this feature, the
"SHOW__BACK" & "SHOW__BACK_2" must be specified as per this example:
- SHOW__BACK: input_boolean.service_true_value
Examples of use:
Example of use #1 - settings for graphs with the “Day / night” background, w/o the “Realtime” flag, w/o a title:
type: 'custom:decluttering-card'
template: decl_graph_settings
variables:
  - TITLE: ''
  - INPUT_HOURS_TO_SHOW: input_select.graph_hours_to_show_test
  - INPUT_SHOW_EXTREMA: input_boolean.graph_show_extrema_test
  - INPUT_SHOW_POINTS: input_boolean.graph_show_points_test
  - SHOW__BACK: input_boolean.service_true_value
  - INPUT_SHOW_BACK: input_boolean.graph_show_night_test
  - SHOW__REALTIME: input_boolean.service_false_value
Pictures of the settings card are provided below.
Collapsed view:

Expanded view:

Example of use #2:
type: 'custom:decluttering-card'
template: decl_graph_settings
variables:
  - TITLE: Settings
  - INPUT_HOURS_TO_SHOW: input_select.graph_hours_to_show_test
  - INPUT_SHOW_EXTREMA: input_boolean.graph_show_extrema_test
  - SHOW__SHOW_AVERAGE: input_boolean.service_true_value
  - INPUT_SHOW_AVERAGE: input_boolean.graph_show_average_test
  - INPUT_SHOW_POINTS: input_boolean.graph_show_points_test
  - SHOW__BACK: input_boolean.service_true_value
  - INPUT_SHOW_BACK: input_boolean.graph_show_ping_availability_host
  - BACK_NAME: Availablity (ping)
  - SHOW__BACK_2: input_boolean.service_true_value
  - INPUT_SHOW_BACK_2: input_boolean.graph_show_integration_availability_host
  - BACK_NAME_2: Availablity (Netdata)
  - INPUT_REALTIME: input_boolean.graph_realtime_test
This example provides settings for graphs for some PC (for statistical data like “CPU load”, “RAM usage” etc) including showing average value & two backgrounds:
- availability of this PC (ping);
- availability of Netdata node on this PC (source of statistical data).
Pictures of the settings card are provided below.
Collapsed view:

Expanded view:

Example of use #3 - a reduced set of settings for graphs w/o showing extrema values, w/o a background, w/o the “Realtime” graph:
type: 'custom:decluttering-card'
template: decl_graph_settings
variables:
  - TITLE: Settings
  - INPUT_HOURS_TO_SHOW: input_select.graph_hours_to_show_test
  - SHOW__SHOW_EXTREMA: input_boolean.service_false_value
  - INPUT_SHOW_POINTS: input_boolean.graph_show_points_test
  - SHOW__REALTIME: input_boolean.service_false_value
Pictures of the settings card are provided below.
Collapsed view:

Expanded view:

Example of use #4 - settings for "history-graph":
type: 'custom:decluttering-card'
template: decl_graph_settings
variables:
  - TITLE: Settings
  - INPUT_HOURS_TO_SHOW: input_select.graph_hours_to_show_test
  - INPUT_NEW_STYLE: input_boolean.service_false_value
  - INPUT_REALTIME: input_boolean.graph_realtime_test
Picture of the settings card is provided below (same for collapsed & expanded view):