Using Home Assistant to calculate my energy bill using data from my Solar Inverter

Update 21/July/2023 - I have started a new topic that uses a fully manual solution I came up with using just the rest sensor for Enphase Envoy on D7 firmware.
It’s a lengthy guide with lots of explanation.
Hopefully it helps someone else out.

Original Guide from October 2021 - Hi,

Why am I writing this?
I am sharing this project as a lot of work went into it and I am hoping to help anyone else in a similar position.

What is the problem that needs solving?
I wouldn’t call it a problem, but rather a blind spot most people have with their power bills, and that is not having realtime information about your power usage and the direct financial cost of that usage.

What do I need before getting started?
You need a device that can measure the flow of electrons from your grid connected energy meter to the rest of your house. This is usually able to be done by placing a device called a Current Transformer (CT) Clamp on the wire coming our of your energy meter. In my case, I had a solar system installed where a CT clamp was installed and connected to the inverter (called Envoy in my specific case) of my solar system. My solar system then connects to my network via wifi where Home Assistant can extract this information.

You will also need to know as much as possible about your current power plan.
In my case, I was able to find my plan details at https://www.energymadeeasy.gov.au/

Complex Time Of Use (TOU) tariff plans.
I probably picked one of the most complicated tariff plans available (Discover Energy Solar Smart) which has created a little more work and is probably half the reason why I felt compelled to document this project.

Here are the 3 x different export compensation rates and daily service charge.
No Discount applies to these.
|Description|Unit|Base Rate|
|—|—|—|—|
|Daily Supply|day|$0.7400|$0.7400|
|Solar First 3.2877 kWh/Day|kWh|$0.1600|
|Solar Next 3.2877 kWh/Day|kWh|$0.1000|
|Solar All remaining|kWh|$0.0400|$0.0400|

Here are the 3 x different import charges with a 27% discount applied to import only.

Description Unit Base Rate 27% Discounted Rate
Peak Usage kWh $0.4961 $0.3622
Off Peak Usage kWh $0.1675 $0.1223
Shoulder Usage kWh $0.2052 $0.1498

To make things even more complex, my retailer then only charges peak rates at different times of day and year:

Season Peak time of day and week Duration Months
Summer 2:00PM - 8:00PM Mon-Fri 5 Months Nov-Mar
Autumn No Peak Charged 2 Months Apr-May
Winter 5:00PM - 9:00PM Mon-Fri 3 Months Jun-Aug
Spring No Peak Charged 2 Months Sep-Oct

Making the house consumption information available to Home Assistant.
I have an Enphase Envoy system with Consumption Monitoring. This project can work with other brands as well, you will just need to replace the sensor names with whatever yours are meant to be.

Verifying your house consumption and solar production is working.
In my case, it all starts with 2 sensors which i have then given shorter more friendly names in my customize.yaml file

sensor.envoy_SERIALNUMBER_current_power_consumption:
  friendly_name: Consumption Now
sensor.envoy_SERIALNUMBER_current_power_production:
  friendly_name: Production Now

This is what they look like in graph form
Screen Shot 2021-10-08 at 1.42.15 pm

Screen Shot 2021-10-08 at 1.42.40 pm

Ok, these figures are great for seeing and graphing how much power in Watts (W) my solar panels are producing and how much grid/solar power my house is consuming, but how do we work out how much power is being pulled from or pushed to the grid which is ultimately what the power company uses to bill you?
To work out the all important grid figures, we need to use Home Assistant to do some simple maths for us.

Here is how I get the grid in/out figures

  - sensor:
        name: Grid Import Power
        state_class: measurement
        icon: mdi:transmission-tower
        unit_of_measurement: W
        device_class: power
        state: >
            {{ [0, states('sensor.envoy_SERIALNUMBER_current_power_consumption') | int - states('sensor.envoy_SERIALNUMBER_current_power_production') | int ] | max }}

  - sensor:
        name: Grid Export Power
        state_class: measurement
        icon: mdi:transmission-tower
        unit_of_measurement: W
        device_class: power
        state: >
            {{ [0, states('sensor.envoy_SERIALNUMBER_current_power_production') | int - states('sensor.envoy_SERIALNUMBER_current_power_consumption') | int ] | max }}

Results in a graph
Screen Shot 2021-10-08 at 1.54.00 pm

Screen Shot 2021-10-08 at 1.53.47 pm

Ok, that is grid power in Watts (W) setup, now we have to convert power into energy in kiloWatt hours (kWh) which is exactly what your energy company uses as well.
To do this, we can use another Home Assistant Integration which is funnily enough also named Integration (not confusing at all guys).
Here is how we put that to work and convert W to kWh.

  - platform: integration
    name: Grid Import Energy
    source: sensor.grid_import_power
    method: left
    unit_prefix: k
    unit_time: h
    
  - platform: integration
    name: Grid Export Energy
    source: sensor.grid_export_power
    method: left
    unit_prefix: k
    unit_time: h

Result of this integration code gives us these sensors
Screen Shot 2021-10-08 at 2.07.57 pm

Screen Shot 2021-10-08 at 2.08.12 pm

Ok, now that we finally have energy measured in the same unit of measurement that your supplier bills you, we can finally get started on calculating costs.

Because I have such a complex energy plan with 3 different import charges and 3 different export credits, I needed a way of separating the 6 different tariffs.
I also wanted to see both how much energy per day I am consuming as well as per quarter of the year which is how often my bills are sent to me.
Here is how I started by using Utility Meter - Home Assistant

utility_meter:
  daily_energy:
    source: sensor.grid_import_energy
    name: Daily Import Meter
    cycle: daily
    tariffs:
      - DE_OffPeak
      - DE_Shoulder
      - DE_Peak

  quarterly_energy:
    source: sensor.grid_import_energy
    name: Quarterly Import Meter
    tariffs:
      - DE_OffPeak
      - DE_Shoulder
      - DE_Peak

  daily_energy_export:
    source: sensor.grid_export_energy
    name: Daily Export Meter
    cycle: daily
    tariffs:
      - DE1
      - DE2
      - DE3

  quarterly_energy_export:
    source: sensor.grid_export_energy
    name: Quarterly Export Meter
    tariffs:
      - DE1
      - DE2
      - DE3

Note: I deliberately left out cycle: from the quarterly meters as my bills are calculated at on the 13th of the month and I need to use automation to cycle the meters at the same time as my bill.
I previously tried using quarterly and that just cycled the meter on the 1st of October for example which was not good for my situation.

Here is what those meters look like when they are setup. (note: it is currently spring and therefore peak is not charged for 4 months of the year including autumn, hence why peak is empty at the moment)

Screen Shot 2021-10-08 at 2.19.31 pm

Screen Shot 2021-10-08 at 2.19.44 pm

Screen Shot 2021-10-08 at 2.18.23 pm

Screen Shot 2021-10-08 at 2.19.03 pm

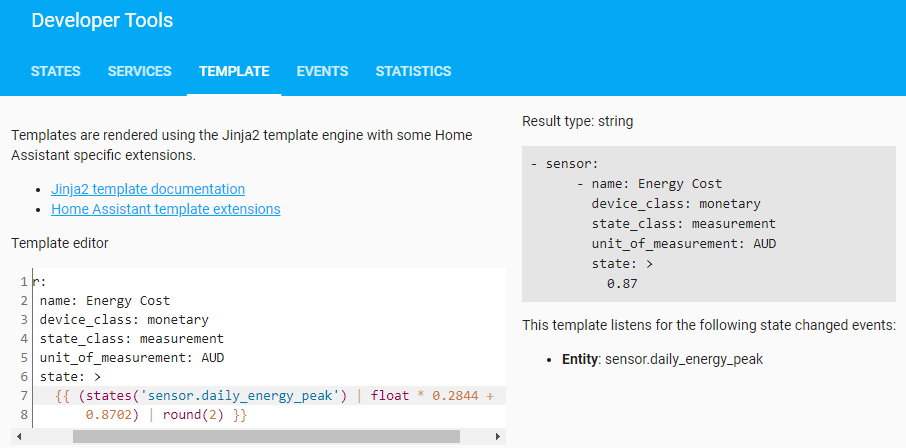
OK, so once we have tariffs defined, how do we assign different values to each tariff?
I used template sensors to show what the current rate is

template:
  - sensor:
      - name: Tariff Price
        unit_of_measurement: AUD/kWh
        state: >
            {% if is_state('utility_meter.daily_energy', 'DE_Peak') %}
                {{ 0.4961 * 0.73 }}
            {% elif is_state('utility_meter.daily_energy', 'DE_Shoulder') %}
                {{ 0.2052 * 0.73 }}
            {% elif is_state('utility_meter.daily_energy', 'DE_OffPeak') %}
                {{ 0.1675 * 0.73 }}
            {% else %}
                {{ 0.1675 * 0.73 }}
            {% endif %}

  - sensor:
      - name: Tariff Price Export
        unit_of_measurement: AUD/kWh
        state: >
            {% if is_state('utility_meter.daily_energy_export', 'DE1') %}
                {{ 0.16 }}
            {% elif is_state('utility_meter.daily_energy_export', 'DE2') %}
                {{ 0.10 }}
            {% elif is_state('utility_meter.daily_energy_export', 'DE3') %}
                {{ 0.04 }}
            {% else %}
                {{ 0.04 }}
            {% endif %}

How do we change the tariff rate to suit the time of day or amount of solar exported?
By using the Home Assistant automation to change the state of the sensor, I can change the tariff.
Here is the automations I setup.
I am going to break these down into sections

All year round Import Tariffs (7am shoulder trigger and 10pm off peak trigger)

- id: '1628426407631'
  alias: Tariff Shoulder
  description: ''
  trigger:
  - platform: time
    at: 07:00:00
  condition: []
  action:
  - service: utility_meter.select_tariff
    target:
      entity_id:
      - utility_meter.daily_energy
      - utility_meter.quarterly_energy
    data:
      tariff: DE_Shoulder
  mode: single
- id: '1628427071203'
  alias: Tariff Offpeak
  description: ''
  trigger:
  - platform: time
    at: '22:00:00'
  condition: []
  action:
  - service: utility_meter.select_tariff
    target:
      entity_id:
      - utility_meter.daily_energy
      - utility_meter.quarterly_energy
    data:
      tariff: DE_OffPeak
  mode: single

Once all those are setup, every day in the current season should look like this:

Then we have different peak Mon-Fri tariff start times for Winter and Summer

For reference:

Season Peak time of day and week Duration Months
Summer 2:00PM - 8:00PM Mon-Fri 5 Months Nov-Mar
Autumn No Peak Charged 2 Months Apr-May
Winter 5:00PM - 9:00PM Mon-Fri 3 Months Jun-Aug
Spring No Peak Charged 2 Months Sep-Oct

Summer Time
Mon-Fri 2PM-8PM Peak Tariff

- id: '1628426963820'
  alias: Tariff Peak Weekday Summer
  description: ''
  trigger:
  - platform: time
    at: '14:00:00'
  condition:
  - condition: time
    weekday:
    - mon
    - tue
    - wed
    - thu
    - fri
  action:
  - service: utility_meter.select_tariff
    data:
      tariff: DE_Peak
    target:
      entity_id:
      - utility_meter.daily_energy
      - utility_meter.quarterly_energy
  mode: single
- id: '1628427181909'
  alias: Tariff shoulder Weekday Summer
  description: ''
  trigger:
  - platform: time
    at: '20:00:00'
  condition:
  - condition: time
    weekday:
    - mon
    - tue
    - wed
    - thu
    - fri
  action:
  - service: utility_meter.select_tariff
    target:
      entity_id:
      - utility_meter.daily_energy
      - utility_meter.quarterly_energy
    data:
      tariff: DE_Shoulder
  mode: single

Winter Time
Mon-Fri 5PM-9PM Peak Tariff

- id: '1633657060594'
  alias: Tariff Peak Weekday Winter
  description: ''
  trigger:
  - platform: time
    at: '17:00:00'
  condition:
  - condition: time
    weekday:
    - mon
    - tue
    - wed
    - thu
    - fri
  action:
  - service: utility_meter.select_tariff
    data:
      tariff: DE_Peak
    target:
      entity_id:
      - utility_meter.daily_energy
      - utility_meter.quarterly_energy
  mode: single
- id: '1633657119928'
  alias: Tariff shoulder Weekday Winter
  description: ''
  trigger:
  - platform: time
    at: '21:00:00'
  condition:
  - condition: time
    weekday:
    - mon
    - tue
    - wed
    - thu
    - fri
  action:
  - service: utility_meter.select_tariff
    target:
      entity_id:
      - utility_meter.daily_energy
      - utility_meter.quarterly_energy
    data:
      tariff: DE_Shoulder
  mode: single

Next I needed to setup some time/date helpers so I could use them to trigger each season according to my energy provider. I did so by going to Configuration / Helpers / Add Helper / Date and/or time / Date and Time

image

image

image

image

I then used those helpers in the following seasonal automations that simply turn Summer or Winter Peak automations on and off as needed.

- id: '1633499708514'
  alias: TOU Summer
  description: ''
  trigger:
  - platform: time
    at: input_datetime.summer_months
  condition: []
  action:
  - service: automation.turn_on
    target:
      entity_id:
      - automation.tariff_peak
      - automation.tariff_offpeak_weekday
  mode: single
- id: '1633499918295'
  alias: TOU Autumn
  description: ''
  trigger:
  - platform: time
    at: input_datetime.autumn_tou
  condition: []
  action:
  - service: automation.turn_off
    target:
      entity_id:
      - automation.tariff_peak
      - automation.tariff_offpeak_weekday
  mode: single
- id: '1633500035108'
  alias: TOU Winter
  description: ''
  trigger:
  - platform: time
    at: input_datetime.winter_tou
  condition: []
  action:
  - service: automation.turn_on
    target:
      entity_id:
      - automation.tariff_peak_weekday_winter
      - automation.tariff_shoulder_weekday_winter
  mode: single
- id: '1633500066805'
  alias: TOU Spring
  description: ''
  trigger:
  - platform: time
    at: input_datetime.spring_tou
  condition: []
  action:
  - service: automation.turn_off
    target:
      entity_id:
      - automation.tariff_peak_weekday_winter
      - automation.tariff_shoulder_weekday_winter
  mode: single

Now, for the really tricky stuff, the solar export tariffs based on how many kWh has been exported to the grid for the day.
This first one just sets DE1 at midnight of each day.

- id: '1632882513229'
  alias: Tariff DE1
  description: ''
  trigger:
  - platform: state
    entity_id: sensor.daily_energy_export_de1
    attribute: last_reset
  condition: []
  action:
  - service: utility_meter.select_tariff
    data:
      tariff: DE1
    target:
      entity_id:
      - utility_meter.daily_energy_export
      - utility_meter.quarterly_energy_export
  mode: single

Then after 3.2877 kWh has been exported, it switches over to DE2

- id: '1632882631427'
  alias: Tariff DE2
  description: ''
  trigger:
  - platform: numeric_state
    entity_id: sensor.daily_energy_export_de1
    above: '3.2877'
  condition: []
  action:
  - service: utility_meter.select_tariff
    data:
      tariff: DE2
    target:
      entity_id:
      - utility_meter.daily_energy_export
      - utility_meter.quarterly_energy_export
  mode: single

Then after a further 3.2877 kWh has been exported, it switches over to DE3 for the rest of the day until the midnight reset.

- id: '1632882892704'
  alias: Tariff DE3
  description: ''
  trigger:
  - platform: numeric_state
    entity_id: sensor.daily_energy_export_de2
    above: '3.2877'
  condition: []
  action:
  - service: utility_meter.select_tariff
    data:
      tariff: DE3
    target:
      entity_id:
      - utility_meter.daily_energy_export
      - utility_meter.quarterly_energy_export

Here is what that looks like in action
image

This is POWER being exported
image

This is ENERGY being exported
image

This is the tariff price responding to the amount of ENERGY exported
image

This graph is my total cost per day which is the next bit of code I will show you.
(Most notably, every day starts with the $0.74 service charge)

image

This bonus graph is the instant cost per hour inclusive of the daily service change which I will also show the code for.
($0.74 divided by 24 hours in 1 day = approx. 3 cents per hour)

image

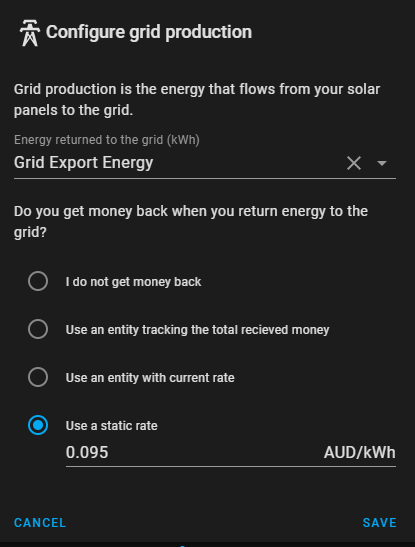
At this point, it is definitely worth mentioning that you can now also use these variable tariff price sensors in the energy dashboard.

image

image

The only drawback of energy dashboard, is that the daily service charge is not able to be represented.

Alternatively, I have another way to fill this daily service charge gap by calculating all 6 tariffs and the daily service charge into 1 number.
Note: The following is a workaround that does NOT involve Energy Dashboard.

template:
  - sensor:
      - name: Today Energy Total Cost
        device_class: monetary
        state_class: measurement
        unit_of_measurement: AUD
        state: >
          {{ (states('sensor.daily_energy_DE_Peak') | float * (0.4961 * 0.73) +
              states('sensor.daily_energy_DE_Shoulder') | float * (0.2052 * 0.73) +
              states('sensor.daily_energy_DE_OffPeak') | float * (0.1675 * 0.73) -
              states('sensor.daily_energy_export_DE1') | float * 0.16 -
              states('sensor.daily_energy_export_DE2') | float * 0.10 -
              states('sensor.daily_energy_export_DE3') | float * 0.04 +
              0.7400) | round(2) }}

Example:
image

While I was at it, I decided to apply the same logic to the day before.

  - sensor:
      - name: Yesterday Energy Total Cost
        device_class: monetary
        unit_of_measurement: AUD
        state: >
          {{ (state_attr('sensor.daily_energy_DE_Peak','last_period') | float * (0.4961 * 0.73) +
              state_attr('sensor.daily_energy_DE_Shoulder','last_period') | float * (0.2052 * 0.73) +
              state_attr('sensor.daily_energy_DE_OffPeak','last_period') | float * (0.1675 * 0.73) -
              state_attr('sensor.daily_energy_export_DE1','last_period') | float * 0.16 -
              state_attr('sensor.daily_energy_export_DE2','last_period') | float * 0.10 -
              state_attr('sensor.daily_energy_export_DE3','last_period') | float * 0.04 +
              0.7400) | round(2) }}

Example:
image

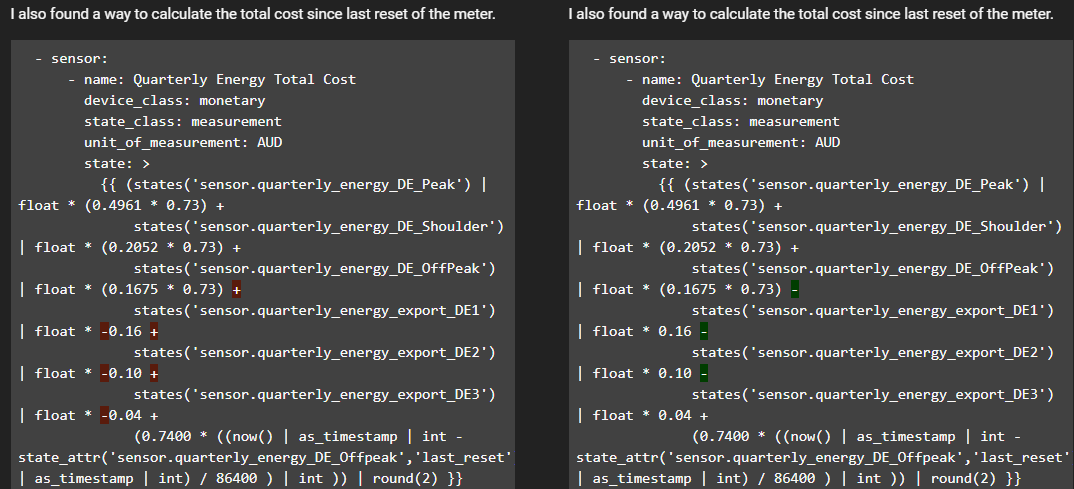
I also found a way to calculate the total cost since last reset of the meter.

  - sensor:
      - name: Quarterly Energy Total Cost
        device_class: monetary
        state_class: measurement
        unit_of_measurement: AUD
        state: >
          {{ (states('sensor.quarterly_energy_DE_Peak') | float * (0.4961 * 0.73) +
              states('sensor.quarterly_energy_DE_Shoulder') | float * (0.2052 * 0.73) +
              states('sensor.quarterly_energy_DE_OffPeak') | float * (0.1675 * 0.73) -
              states('sensor.quarterly_energy_export_DE1') | float * 0.16 -
              states('sensor.quarterly_energy_export_DE2') | float * 0.10 -
              states('sensor.quarterly_energy_export_DE3') | float * 0.04 +
              (0.7400 * ((now() | as_timestamp | int - state_attr('sensor.quarterly_energy_DE_Offpeak','last_reset') | as_timestamp | int) / 86400 ) | int )) | round(2) }}            
     

Example:
image

For the above sensors, I was able to apply the 27% discount by multiplying the original price by 0.73 instead (100 - 27 = 73).
This turned out to be more efficient and gave more accurate detail in the pricing.
Also, notice the step at 12am everyday? That is the $0.74 daily service charge getting added at midnight.

All that was really left was the automation needed to cycle the meters at the same time my power company issues a new bill.

I first start with setting up some date time helpers for when my quarterly bills start/finish.

Screen Shot 2021-10-08 at 9.57.35 pm

Screen Shot 2021-10-08 at 9.57.14 pm

Screen Shot 2021-10-08 at 9.57.45 pm

Screen Shot 2021-10-08 at 9.57.26 pm

Then I can finally follow up with the automation to reset the quarterly meters.

- id: '1628744454766'
  alias: Quarterly Meter Reset
  description: ''
  trigger:
  - platform: time
    at: input_datetime.spring
  - platform: time
    at: input_datetime.summer
  - platform: time
    at: input_datetime.autumn
  - platform: time
    at: input_datetime.winter
  condition: []
  action:
  - service: utility_meter.reset
    target:
      entity_id:
      - utility_meter.quarterly_energy
      - utility_meter.quarterly_energy_export
  - service: notify.notify
    data:
      message: quarterly meter reset
  mode: single

There is 1 more sensor that I use to see how much power is costing me at this very moment.

Code for Instant Cost Per Hour

template:
  - sensor:
        name: Instant Cost Per Hour
        state_class: measurement
        unit_of_measurement: AUD
        device_class: monetary
        state: >
            {% set hourly = 0.7400 / 24 %}
            {% set gridout = states('sensor.grid_export_power') | int %}
            {% set gridin = states('sensor.grid_import_power') | int %}
            {% if gridout > 0 %}
              {{ ((gridout/1000) * (states('sensor.tariff_price_export') | float * -1) + hourly) | round(2) }}
            {% else %}
              {{ ((gridin/1000) * states('sensor.tariff_price') | float + hourly) | round(2) }}
            {% endif %}

image

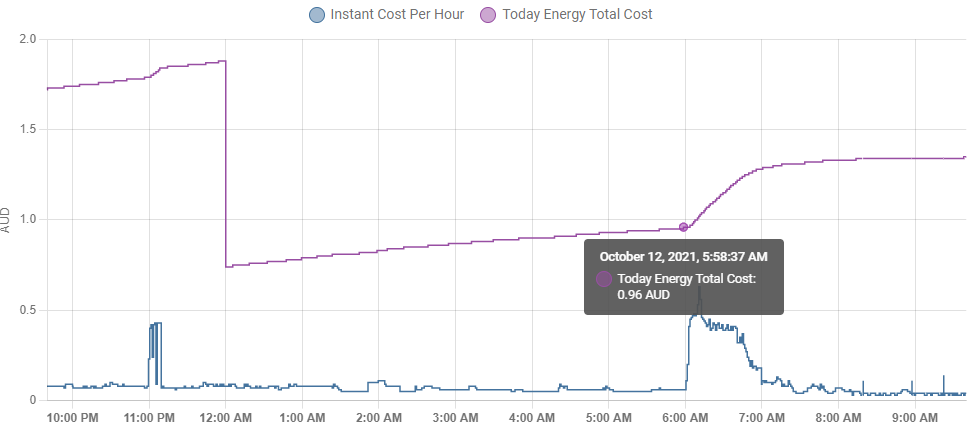
I usually overlay this graph with the Today Energy Total Cost

And here are the last 2 elements I thought were important was an average cost per day as well as a bill forecast using all this data.

  - sensor:
        name: Average Cost Per Day
        state_class: measurement
        unit_of_measurement: AUD
        device_class: monetary
        state: >
            {{ (states('sensor.quarterly_energy_total_cost') | float / ((now() | as_timestamp - state_attr('sensor.quarterly_energy_shoulder','last_reset') | as_timestamp) / 86400)) | round(2) }}

image

  - sensor:
        name: Bill Forecast
        state_class: measurement
        unit_of_measurement: AUD
        device_class: monetary
        state: >
            {{ states('sensor.average_cost_per_day') | float * ((state_attr('input_datetime.summer','timestamp') | int - state_attr('sensor.quarterly_energy_shoulder','last_reset') | as_timestamp | int) / 86400) | round(0) }}

image

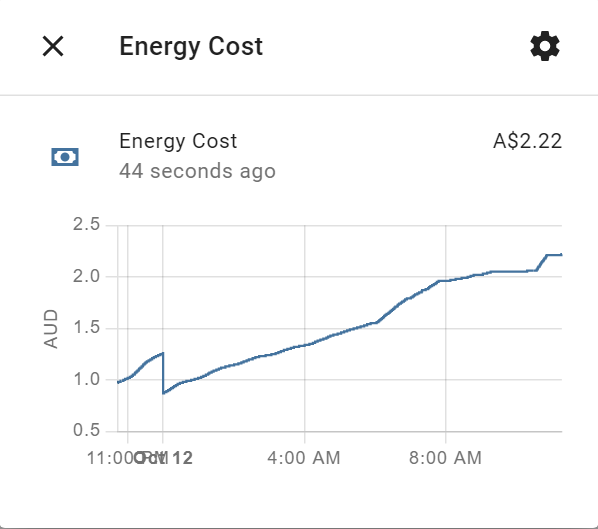
Then I was able to add all these elements into an always on dashboard in my home.
Final results:

Thats about it really. Happy to answer questions or try help out.

17 Likes

Wow so much just to add prices. Well done. I had been poking around for something like this.

I was considering just doing daily usage charge divided by 24 hours, and then adding that to each hour once. Not sure if that works. Although I suppose it could also just be added once per day too…

1 Like

Stay tuned, I have incorporated the daily price (not to Energy Dashboard, sadly that is currently not possible) and will continue my post very soon

Edit: I have now updated the article.

1 Like

Edit: This issue is now solved
I have now updated the code to reflect changes that fix this issue.
If you are curious, you can click this icon at the very top of the first post to see what I changed.
image

Hi,

I have just discovered there is a slight logic error in my code that only affects energy dashboard compensation.

In the past, I was on a static export rate and this is how I had configured it (with a positive number).

Now, I have set it up to use my tariff sensor (which now uses a negative number).

image

This is causing the import and export numbers to be added which is not what I intended. I initially thought this was a bug in 2021.10, which is exactly the same time I went from static positive number to variable negative number, but it’s actually my logic that is the cause.

image

This is an easy fix and I will soon update my original post above with the correct code so it all works with energy dashboard.

Edit: I have now updated the code to reflect changes that fix this issue.
If you are curious, you can click this icon at the very top of the first post to see what I changed.
image

Examples:

Once all the sensors are all setup, I can now accurately see precisely how much it costs me to run my air conditioner for 1 hour in the morning.

Before 6am

After 7am

$1.29 - $0.96 = $0.33 for 1 hour of Air Conditioning on the offpeak tariff.

Temperature graph for reference

Power Usage graph for reference

Note: For anyone wondering why my generation and consumption are so closely matched on the graphs, It is because I have a paladin solar diverter that uses any excess solar generated power, that would otherwise go to the grid, to instead heat up my home 315 Litre hot water bottle with the excess electricity.

1 Like

Hi del13r,

Firstly great work. Your code has helped me in the past and now I’m hoping you can point me in the right direction again for my simple issue.
I’m still a bit or a newbie at all this but I’m starting to get it thanks to guys like you and these forums.

I have a very simple cost structure Peak Rate import ($0.2844/kWh) + Daily charge ($0.8702/day) and a fixed export of $0.16/kWh

I’ve managed to create some simple sensors using utility meter and an import energy cost as below

utility_meter:
    daily_energy:
        source: sensor.grid_import_energy
        cycle: daily
        tariffs:
            - peak

template:
  - sensor:
      - name: Tariff Price
        unit_of_measurement: AUD/kWh
        state: >
            {% if is_state('utility_meter.daily_energy','Peak') %}
                {{ 0.2844 }}
            {% endif %}

- sensor:
      - name: Energy Cost
        device_class: monetary
        state_class: measurement
        unit_of_measurement: AUD
        state: >
          {{ (states('sensor.daily_energy_Peak') | float * (0.2844) + 0.8702) | round(2) }}

This seems to work as expected looking at the sensor chart. Cost ot 0.8702 at midnight then the kWh charge through the day.

I then tried adding this to the Energy Grid Consumption Cost so it would use the tariff + daily charge however when the dashboard updated this morning it had the wrong price which as far as I could tell didn’t correlate to anything

So seeing my energy cost chart works how do I incorporate this into the Energy Monitor?

One other this was that if I used the sensor in Energy monitor with unit_of_measurement as AUD it have an error as it was expecting AUD/kWh

Hopefully this makes some sense.

Thanks for any assistance you can provide

Cheers

Hi @Stake63,

When you only have 1 tariff, you probably don’t need an if statement.
When you have an if statement, i think you might need an else statement, otherwise it doesnt know what to do when your if statement doesnt match.

Try this instead

template:
  - sensor:
      - name: Tariff Price
        unit_of_measurement: AUD/kWh
        state: >
            {{ 0.2844 }}

Now for the energy cost

To be fair, this one looks good already. I have only messed with formatting to help me understand it.

- sensor:
      - name: Energy Cost
        device_class: monetary
        state_class: measurement
        unit_of_measurement: AUD
        state: >
          {{ (states('sensor.daily_energy_Peak') | float * 0.2844 +
              0.8702) | round(2) }}

I often use Developer tools to work out the logic.

Example:

As my retailer currently does not charge peak for Spring months (Sept-Oct), your code will not match mine exactly. Using your code, we can see the $0.87 result on the right of the picture. This deliberately unmatched sensor pretty much simulates what will happen at the start of every day (midnight) when the daily_energy_peak gets reset.

When I change the sensor to match one of my sensors, I can see the 0.87 being added to the current value of that sensor

Here is the value of my sensor
image

Lets break down the code using my sensor value above as an example.

4.457 kWh (energy consumed today) * $0.2844 (your peak rate per kWh) = $1.2675708
$1.2675708 + $0.8702 (daily service charge) = $2.1377708

That is your cost for the whole day including daily service charge. Note: this does not include solar compensation as its not in your code. Otherwise, looks good to me if you if you do not have solar.

My code also includes the solar compensation so I can see 3 elements…
1 - the whole daily grid import usage cost
2 - excess solar grid export compensation
3 - daily service charge
…all in 1 number that represents what I paid for power for the whole day.
That is the whole point of this whole project really :slight_smile:

Sorry, I think I may have misled you slightly.

This is the problem, no matter how hard you try, you cannot incorporate daily cost into energy dashboard as they use a simple kWh multiplier value that makes it impossible to implement the additional daily cost into Energy Dashboard. Even if you divided the daily cost into hours, it still will not work.

This is why I have gone to the trouble of creating the total cost sensor to fill the gap that energy dashboard currently has.

I hope you can understand the confusion.

Thanks for the fast reply and information. Very helpful

Thanks for clarifying the Energy dasboard shortcoming. It would have driven me mad

Can you add this to the Energy dashboard? If so I’m guessing I just need to create a few more sensors the same as import for export but with a -ve value create the total energy sensor and add it

Have I understood this correctly or is Energy Dashboard 100% incapable of doing it no matter what?

Thanks again

Energy dashboard can and does track the import cost and export compensation properly, with a caveat and that is no daily service charge.

Here is my setup

Energy dashboard uses the value below as a multiplier for the most recent hour of statistics it is recording.

In my case, the value that this sensor shows to energy dashboard varies depending on the time of day.
image

Lets break it down.
These 2 numbers below = 4.951 when added together
Energy Dashboard is always 1h12m behind so that’s why it doesnt match exactly.

image

image

4.457 kWh * 0.122275 (off peak tariff) = $0.544979675
0.494 kWh * 0.149796 (shoulder tariff) = $0.073999224
add them together and I get = $0.618978899
Which matches image in energy dashboard.

Incorporating daily service charge into energy dashboard is impossible for me. Only the Home Assistant Devs can fix this gap. In the meantime, I will be relying on my own daily total cost sensor that fills this gap.

Hi @Stake63,

I just went over my original post and found that I mentioned this caveat already.

Perhaps where I was not clear is in my next sentence after that, what I meant to say was that I have a workaround that does not involve Energy Dashboard.

I will update this to prevent any confusion.

I think that’s where I got confused

The daily charge has been mentioned here Daily Charge

Hopefully the devs or a community member can come up with a workable solution

Thanks again.

1 Like

That’s an interesting device. Does it interfere in any way with the way the Envoy reports consumption and production? How does it pick up that there’s a surplus of production, how does it measure the water temperature, and does it still run the heater appropriately when there is no surplus, preferably on off-peak where possible?

I know this is likely showing my ignorance but how/where do I place the syntax below within HA. Is it a template and put in config.yaml?

  • sensor:
    name: Grid Import Power
    state_class: measurement
    icon: mdi:transmission-tower
    unit_of_measurement: W
    device_class: power
    state: >
    {{ [0, states(‘sensor.envoy_SERIALNUMBER_current_power_consumption’) | int - states(‘sensor.envoy_SERIALNUMBER_current_power_production’) | int ] | max }}

I can tell its doing its job when production and consumption are overlapping each other or the numbers are roughly the same. On a sunny day, it will do its thing till a little bit after 11am and then drop off and start exporting excess solar to the grid.

Yesterday was a rainy day so it didnt finish till like 4:30pm

image

image

It has another CT clamp on the same wire that my solar CT clamp is on.
Blue CT Clamp is for Paladin and Black CT Clamp is for Solar.

image

image

The CT Clamp tells Paladin how much power is coming in/going out to the grid.
Paladin reacts very quickly to balance the grid in/out as close to 0 as it can.

I wedged a temp sensor between the foam insulation and the exterior of the stainless water tank. That sensor then has 2 wires that I connected to just 2 of the 8 wires of an ethernet cable that then goes into the paladin box.

image

This was the only weak point for me. It has several minimum temperature settings you can choose from. 60, 50, 40 (default), 30, 10.
If the water temp ever dropped below the minimum temp threshold, it would immediately pull power from the grid to get it back up to the minimum. This was a problem for me which made me feel like I had no control over the device. For example, if a bath was taken at 6pm which is within peak tariff, then it would draw a bunch of electricity from the grid to get it back up to minimum temp at the most expensive time for electricity. This sort of negated to whole point of the device. I regained control over the device by setting the minimum temp as low as it would go and that situation has not been a problem since. If there is a string of consecutive low production days, I just go out to the fusebox and switch it over from paladin (DAY) back to controlled load (NIGHT) and it will heat up over night using my changeover switch I installed.

It is also worth mentioning that the Paladin also has code that prevents legionnaire’s disease by heating up the water using grid power if the temp has not reached 60 degrees Celsius in the last 72 hours. I have never needed it so far. see https://www.paladinsolarcontroller.com.au/wp-content/uploads/2019/03/Paladin-V6-User-Guide.pdf

Changeover switch I used:

For installing, I found this diagram to be the most helpful for retaining the ability to use controlled load over night if I ever needed it. In the diagram below, switch position 1 is day and position 2 is night.

image

1 Like

Thanks for all the info. So it doesn’t interfere at all with what Enlighten records for consumption and production, or how your HA sensors work? When it diverts solar to the heater, that is counted as normal House consumption?

What if you don’t have much surplus production at all during the day? Is there a risk you’ll run out of hot water?

Did you do the installation yourself? The temp reading could be a problem for me, with the water heater being 2 floors away from the switchboard!

Hi, yes, it is a template sensor so put it in the template block.

Prett much all of the sensors I talk about are in the template block of configuration.yaml

The only exception is the - platform: integration sensors.
They have their own block I like to put after the template block. So it would go like this.

template:
  - sensor:
        name: Grid Import Power
        state_class: measurement
        icon: mdi:transmission-tower
        unit_of_measurement: W
        device_class: power
        state: >
            {{ [0, states('sensor.envoy_SERIALNUMBER_current_power_consumption') | int - states('sensor.solar_power_corrected') | int ] | max }}
sensor:
  - platform: integration
    name: Grid Import Energy
    source: sensor.grid_import_power
    method: left
    unit_prefix: k
    unit_time: h

Yep, as seen in this graph from yesterday.
Generation (purple) and Consumption (Blue) didnt separate until 4:30pm yesterday due to rainy day. These lines usually overlap due to how closely paladin tries to consume all excess solar power.

image

Grid Export (orange) is only seen after hot water is done heating up.
Grd Import (Aqua) is only seen once the sun goes down.

image

Yes, I did. I think the max length for a cat5e cable is normally 100 meters, however given there is a 5V temp sensor on the other end of it, I think the 5v signal degrades too much after 50 meters. I was able to run mine from upstairs fusebox, through the roof cavity and then down 2 levels to the hot water bottle on ground floor which was about 30 meters for me.

If you don’t feel like running a temp sensor, there are other cheaper devices that work in a similar way but don’t have a temp sensor. They rely purely on CT clamp data and algorithms instead. see https://www.catchpower.com.au/ ($649 for Catch Power Green Gen2)

Nope, other that having the production and consumption lines overlapping until just after 11am on a sunny day. Also, I see little spikes occasionally for the rest of the day to maintain the 73 degrees Celsius. Those spikes never exceed what is currently being produced. That is the only thing I notice.

Correct.

The only situation where I cannot see any data is if I manually switch from paladin (DAY) to controlled load (NIGHT) using the changeover switch I installed. This is because controlled load is essentially a seperate wire coming from my meter which is metered seperately. If I wanted to measure that, I would have to put a CT clamp on that wire. Given I have only had to use the changeover swtich once since installing paladin, its not worth worrying about. I’ll see it on my bill eventually anyway.

Here is the 1 night that I used the changeover switch as shown on my energy bill.


So, working with this 1 night of data, we can assume that $0.93 * 90 days = $83.7 per quarter in hot water costs if I didn’t have the diverter.
Now that solar compensation has dropped by 20% on October 1 2021 to lets say 6c - 7.6c per kwh exported, it has suddenly made the solar diverter a bit more attractive.

Installed everything yourself, or just the temp sensor?

I wonder how costs would be affected if a device simply always ran the heater overnight regardless, on off peak (not controlled load). The thermostat would stop it when it’s up to temp anyway. Looks like this might be what the catchpower one does.

Now all we need is an HA interface so we can visualise what these devices are doing in realtime!

EDIT: What do you use to produce those overlapping graphs?

Yep, and I am not an electrician. I was ready to pay an electrician to do it if I felt I had bit off more than I could chew. That wasn’t needed. As I am not an electrician, admittedly it did take me a lot longer to do than an expert would take and the power for the whole house was off for most of the day while I figured it out.

Nothing. Paladin is pulling the power from the same wire that the rest of the house uses which is also the same wire that your solar power gets fed into. It just stops itself from pulling more that what the CT clamp says it can use. The only reason it can do this is because hot water heaters are called a resistive load. You can send 1 watt or 3600 watts to the heater and it will still do something. Just takes longer to heat up when less than 3600 Watts is available.

The controlled load hookup is only there for emergency top up when multiple consecutive cloudy days are experienced. It’s main function is to save you money and will always try to heat using solar only as best it can given the conditions.

I have considered getting a ‘dual power automatic transfer switch’ to try and use controlled load at night every night and then use paladin for top up via solar in the day. I’m not sure its worth the time and money at this point. Plus the whole point of the $900 diverter was to use only solar power to heat up my water. If I go back to controlled load as the primary method of heating, then I have wasted my time and money and let the power company win, Also, If I go back to contolled load, I am using coal power to heat my water instead of sun power and I have to pay the power company for that power instead of using my own for free.
Given I have only had to switch over to controlled load for one night since installing in August, I’d say it’s a minor inconvenience to go outside and flick a switch after 3 rainy days in a row, it’s not worth spending any more money on.
When I did choose to go to controlled load, it wasn’t like my hot water went cold, it just went warm instead of boiling. I was still able to shower comfortably. This was possible because you still get solar production even on a rainy/cloudy day, it still heats it up the water. It just takes longer to do its job.
image