Update 21/July/2023 - I have started a new topic that uses a fully manual solution I came up with using just the rest sensor for Enphase Envoy on D7 firmware.
It’s a lengthy guide with lots of explanation.
Hopefully it helps someone else out.
Original Guide from October 2021 - Hi,
Why am I writing this?
I am sharing this project as a lot of work went into it and I am hoping to help anyone else in a similar position.
What is the problem that needs solving?
I wouldn’t call it a problem, but rather a blind spot most people have with their power bills, and that is not having realtime information about your power usage and the direct financial cost of that usage.
What do I need before getting started?
You need a device that can measure the flow of electrons from your grid connected energy meter to the rest of your house. This is usually able to be done by placing a device called a Current Transformer (CT) Clamp on the wire coming our of your energy meter. In my case, I had a solar system installed where a CT clamp was installed and connected to the inverter (called Envoy in my specific case) of my solar system. My solar system then connects to my network via wifi where Home Assistant can extract this information.
You will also need to know as much as possible about your current power plan.
In my case, I was able to find my plan details at https://www.energymadeeasy.gov.au/
Complex Time Of Use (TOU) tariff plans.
I probably picked one of the most complicated tariff plans available (Discover Energy Solar Smart) which has created a little more work and is probably half the reason why I felt compelled to document this project.
Here are the 3 x different export compensation rates and daily service charge.
No Discount applies to these.
|Description|Unit|Base Rate|
|—|—|—|—|
|Daily Supply|day|$0.7400|$0.7400|
|Solar First 3.2877 kWh/Day|kWh|$0.1600|
|Solar Next 3.2877 kWh/Day|kWh|$0.1000|
|Solar All remaining|kWh|$0.0400|$0.0400|
Here are the 3 x different import charges with a 27% discount applied to import only.
| Description | Unit | Base Rate | 27% Discounted Rate |
|---|---|---|---|
| Peak Usage | kWh | $0.4961 | $0.3622 |
| Off Peak Usage | kWh | $0.1675 | $0.1223 |
| Shoulder Usage | kWh | $0.2052 | $0.1498 |
To make things even more complex, my retailer then only charges peak rates at different times of day and year:
| Season | Peak time of day and week | Duration | Months |
|---|---|---|---|
| Summer | 2:00PM - 8:00PM Mon-Fri | 5 Months | Nov-Mar |
| Autumn | No Peak Charged | 2 Months | Apr-May |
| Winter | 5:00PM - 9:00PM Mon-Fri | 3 Months | Jun-Aug |
| Spring | No Peak Charged | 2 Months | Sep-Oct |
Making the house consumption information available to Home Assistant.
I have an Enphase Envoy system with Consumption Monitoring. This project can work with other brands as well, you will just need to replace the sensor names with whatever yours are meant to be.
Verifying your house consumption and solar production is working.
In my case, it all starts with 2 sensors which i have then given shorter more friendly names in my customize.yaml file
sensor.envoy_SERIALNUMBER_current_power_consumption:
  friendly_name: Consumption Now
sensor.envoy_SERIALNUMBER_current_power_production:
  friendly_name: Production Now
This is what they look like in graph form


Ok, these figures are great for seeing and graphing how much power in Watts (W) my solar panels are producing and how much grid/solar power my house is consuming, but how do we work out how much power is being pulled from or pushed to the grid which is ultimately what the power company uses to bill you?
To work out the all important grid figures, we need to use Home Assistant to do some simple maths for us.
Here is how I get the grid in/out figures
  - sensor:
        name: Grid Import Power
        state_class: measurement
        icon: mdi:transmission-tower
        unit_of_measurement: W
        device_class: power
        state: >
            {{ [0, states('sensor.envoy_SERIALNUMBER_current_power_consumption') | int - states('sensor.envoy_SERIALNUMBER_current_power_production') | int ] | max }}

  - sensor:
        name: Grid Export Power
        state_class: measurement
        icon: mdi:transmission-tower
        unit_of_measurement: W
        device_class: power
        state: >
            {{ [0, states('sensor.envoy_SERIALNUMBER_current_power_production') | int - states('sensor.envoy_SERIALNUMBER_current_power_consumption') | int ] | max }}
Results in a graph


Ok, that is grid power in Watts (W) setup, now we have to convert power into energy in kiloWatt hours (kWh) which is exactly what your energy company uses as well.
To do this, we can use another Home Assistant Integration which is funnily enough also named Integration (not confusing at all guys).
Here is how we put that to work and convert W to kWh.
  - platform: integration
    name: Grid Import Energy
    source: sensor.grid_import_power
    method: left
    unit_prefix: k
    unit_time: h

  - platform: integration
    name: Grid Export Energy
    source: sensor.grid_export_power
    method: left
    unit_prefix: k
    unit_time: h
Result of this integration code gives us these sensors


Ok, now that we finally have energy measured in the same unit of measurement that your supplier bills you, we can finally get started on calculating costs.
Because I have such a complex energy plan with 3 different import charges and 3 different export credits, I needed a way of separating the 6 different tariffs.
I also wanted to see both how much energy per day I am consuming as well as per quarter of the year which is how often my bills are sent to me.
Here is how I started by using Utility Meter - Home Assistant
utility_meter:
  daily_energy:
    source: sensor.grid_import_energy
    name: Daily Import Meter
    cycle: daily
    tariffs:
      - DE_OffPeak
      - DE_Shoulder
      - DE_Peak

  quarterly_energy:
    source: sensor.grid_import_energy
    name: Quarterly Import Meter
    tariffs:
      - DE_OffPeak
      - DE_Shoulder
      - DE_Peak

  daily_energy_export:
    source: sensor.grid_export_energy
    name: Daily Export Meter
    cycle: daily
    tariffs:
      - DE1
      - DE2
      - DE3

  quarterly_energy_export:
    source: sensor.grid_export_energy
    name: Quarterly Export Meter
    tariffs:
      - DE1
      - DE2
      - DE3
Note: I deliberately left out cycle: from the quarterly meters as my bills are calculated at on the 13th of the month and I need to use automation to cycle the meters at the same time as my bill.
I previously tried using quarterly and that just cycled the meter on the 1st of October for example which was not good for my situation.
Here is what those meters look like when they are setup. (note: it is currently spring and therefore peak is not charged for 4 months of the year including autumn, hence why peak is empty at the moment)


OK, so once we have tariffs defined, how do we assign different values to each tariff?
I used template sensors to show what the current rate is
template:
  - sensor:
      - name: Tariff Price
        unit_of_measurement: AUD/kWh
        state: >
            {% if is_state('utility_meter.daily_energy', 'DE_Peak') %}
                {{ 0.4961 * 0.73 }}
            {% elif is_state('utility_meter.daily_energy', 'DE_Shoulder') %}
                {{ 0.2052 * 0.73 }}
            {% elif is_state('utility_meter.daily_energy', 'DE_OffPeak') %}
                {{ 0.1675 * 0.73 }}
            {% else %}
                {{ 0.1675 * 0.73 }}
            {% endif %}

  - sensor:
      - name: Tariff Price Export
        unit_of_measurement: AUD/kWh
        state: >
            {% if is_state('utility_meter.daily_energy_export', 'DE1') %}
                {{ 0.16 }}
            {% elif is_state('utility_meter.daily_energy_export', 'DE2') %}
                {{ 0.10 }}
            {% elif is_state('utility_meter.daily_energy_export', 'DE3') %}
                {{ 0.04 }}
            {% else %}
                {{ 0.04 }}
            {% endif %}
How do we change the tariff rate to suit the time of day or amount of solar exported?
By using the Home Assistant automation to change the state of the sensor, I can change the tariff.
Here is the automations I setup.
I am going to break these down into sections
All year round Import Tariffs (7am shoulder trigger and 10pm off peak trigger)
- id: '1628426407631'
  alias: Tariff Shoulder
  description: ''
  trigger:
  - platform: time
    at: 07:00:00
  condition: []
  action:
  - service: utility_meter.select_tariff
    target:
      entity_id:
      - utility_meter.daily_energy
      - utility_meter.quarterly_energy
    data:
      tariff: DE_Shoulder
  mode: single
- id: '1628427071203'
  alias: Tariff Offpeak
  description: ''
  trigger:
  - platform: time
    at: '22:00:00'
  condition: []
  action:
  - service: utility_meter.select_tariff
    target:
      entity_id:
      - utility_meter.daily_energy
      - utility_meter.quarterly_energy
    data:
      tariff: DE_OffPeak
  mode: single
Once all those are setup, every day in the current season should look like this:
Then we have different peak Mon-Fri tariff start times for Winter and Summer
For reference:
| Season | Peak time of day and week | Duration | Months |
|---|---|---|---|
| Summer | 2:00PM - 8:00PM Mon-Fri | 5 Months | Nov-Mar |
| Autumn | No Peak Charged | 2 Months | Apr-May |
| Winter | 5:00PM - 9:00PM Mon-Fri | 3 Months | Jun-Aug |
| Spring | No Peak Charged | 2 Months | Sep-Oct |
Summer Time
Mon-Fri 2PM-8PM Peak Tariff
- id: '1628426963820'
  alias: Tariff Peak Weekday Summer
  description: ''
  trigger:
  - platform: time
    at: '14:00:00'
  condition:
  - condition: time
    weekday:
    - mon
    - tue
    - wed
    - thu
    - fri
  action:
  - service: utility_meter.select_tariff
    data:
      tariff: DE_Peak
    target:
      entity_id:
      - utility_meter.daily_energy
      - utility_meter.quarterly_energy
  mode: single
- id: '1628427181909'
  alias: Tariff shoulder Weekday Summer
  description: ''
  trigger:
  - platform: time
    at: '20:00:00'
  condition:
  - condition: time
    weekday:
    - mon
    - tue
    - wed
    - thu
    - fri
  action:
  - service: utility_meter.select_tariff
    target:
      entity_id:
      - utility_meter.daily_energy
      - utility_meter.quarterly_energy
    data:
      tariff: DE_Shoulder
  mode: single
Winter Time
Mon-Fri 5PM-9PM Peak Tariff
- id: '1633657060594'
  alias: Tariff Peak Weekday Winter
  description: ''
  trigger:
  - platform: time
    at: '17:00:00'
  condition:
  - condition: time
    weekday:
    - mon
    - tue
    - wed
    - thu
    - fri
  action:
  - service: utility_meter.select_tariff
    data:
      tariff: DE_Peak
    target:
      entity_id:
      - utility_meter.daily_energy
      - utility_meter.quarterly_energy
  mode: single
- id: '1633657119928'
  alias: Tariff shoulder Weekday Winter
  description: ''
  trigger:
  - platform: time
    at: '21:00:00'
  condition:
  - condition: time
    weekday:
    - mon
    - tue
    - wed
    - thu
    - fri
  action:
  - service: utility_meter.select_tariff
    target:
      entity_id:
      - utility_meter.daily_energy
      - utility_meter.quarterly_energy
    data:
      tariff: DE_Shoulder
  mode: single
Next I needed to setup some time/date helpers so I could use them to trigger each season according to my energy provider. I did so by going to Configuration / Helpers / Add Helper / Date and/or time / Date and Time


I then used those helpers in the following seasonal automations that simply turn Summer or Winter Peak automations on and off as needed.
- id: '1633499708514'
  alias: TOU Summer
  description: ''
  trigger:
  - platform: time
    at: input_datetime.summer_months
  condition: []
  action:
  - service: automation.turn_on
    target:
      entity_id:
      - automation.tariff_peak
      - automation.tariff_offpeak_weekday
  mode: single
- id: '1633499918295'
  alias: TOU Autumn
  description: ''
  trigger:
  - platform: time
    at: input_datetime.autumn_tou
  condition: []
  action:
  - service: automation.turn_off
    target:
      entity_id:
      - automation.tariff_peak
      - automation.tariff_offpeak_weekday
  mode: single
- id: '1633500035108'
  alias: TOU Winter
  description: ''
  trigger:
  - platform: time
    at: input_datetime.winter_tou
  condition: []
  action:
  - service: automation.turn_on
    target:
      entity_id:
      - automation.tariff_peak_weekday_winter
      - automation.tariff_shoulder_weekday_winter
  mode: single
- id: '1633500066805'
  alias: TOU Spring
  description: ''
  trigger:
  - platform: time
    at: input_datetime.spring_tou
  condition: []
  action:
  - service: automation.turn_off
    target:
      entity_id:
      - automation.tariff_peak_weekday_winter
      - automation.tariff_shoulder_weekday_winter
  mode: single
Now, for the really tricky stuff, the solar export tariffs based on how many kWh has been exported to the grid for the day.
This first one just sets DE1 at midnight of each day.
- id: '1632882513229'
  alias: Tariff DE1
  description: ''
  trigger:
  - platform: state
    entity_id: sensor.daily_energy_export_de1
    attribute: last_reset
  condition: []
  action:
  - service: utility_meter.select_tariff
    data:
      tariff: DE1
    target:
      entity_id:
      - utility_meter.daily_energy_export
      - utility_meter.quarterly_energy_export
  mode: single
Then after 3.2877 kWh has been exported, it switches over to DE2
- id: '1632882631427'
  alias: Tariff DE2
  description: ''
  trigger:
  - platform: numeric_state
    entity_id: sensor.daily_energy_export_de1
    above: '3.2877'
  condition: []
  action:
  - service: utility_meter.select_tariff
    data:
      tariff: DE2
    target:
      entity_id:
      - utility_meter.daily_energy_export
      - utility_meter.quarterly_energy_export
  mode: single
Then after a further 3.2877 kWh has been exported, it switches over to DE3 for the rest of the day until the midnight reset.
- id: '1632882892704'
  alias: Tariff DE3
  description: ''
  trigger:
  - platform: numeric_state
    entity_id: sensor.daily_energy_export_de2
    above: '3.2877'
  condition: []
  action:
  - service: utility_meter.select_tariff
    data:
      tariff: DE3
    target:
      entity_id:
      - utility_meter.daily_energy_export
      - utility_meter.quarterly_energy_export
Here is what that looks like in action

This is POWER being exported

This is ENERGY being exported

This is the tariff price responding to the amount of ENERGY exported

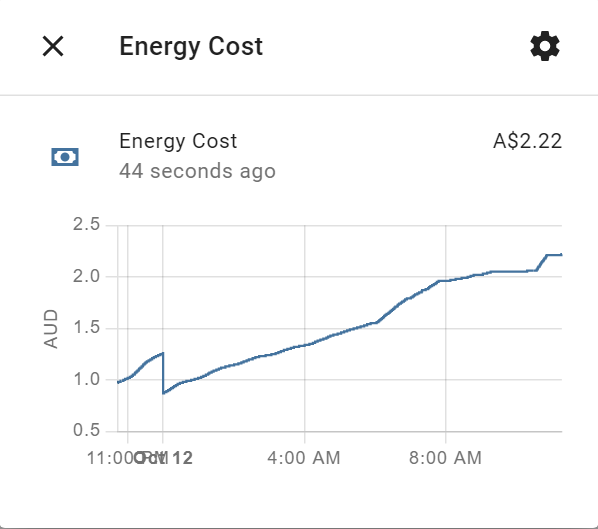
This graph is my total cost per day which is the next bit of code I will show you.
(Most notably, every day starts with the $0.74 service charge)

This bonus graph is the instant cost per hour inclusive of the daily service change which I will also show the code for.
($0.74 divided by 24 hours in 1 day = approx. 3 cents per hour)

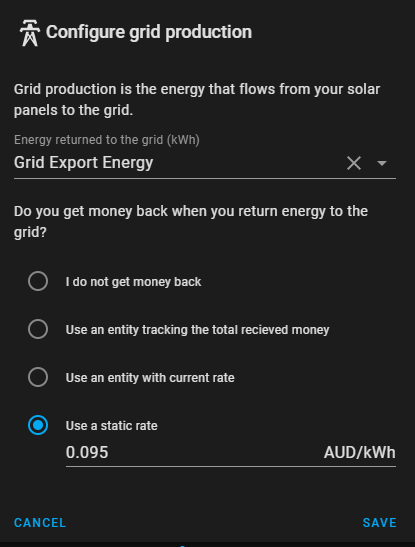
At this point, it is definitely worth mentioning that you can now also use these variable tariff price sensors in the energy dashboard.


The only drawback of energy dashboard, is that the daily service charge is not able to be represented.
Alternatively, I have another way to fill this daily service charge gap by calculating all 6 tariffs and the daily service charge into 1 number.
Note: The following is a workaround that does NOT involve Energy Dashboard.
template:
  - sensor:
      - name: Today Energy Total Cost
        device_class: monetary
        state_class: measurement
        unit_of_measurement: AUD
        state: >
          {{ (states('sensor.daily_energy_DE_Peak') | float * (0.4961 * 0.73) +
              states('sensor.daily_energy_DE_Shoulder') | float * (0.2052 * 0.73) +
              states('sensor.daily_energy_DE_OffPeak') | float * (0.1675 * 0.73) -
              states('sensor.daily_energy_export_DE1') | float * 0.16 -
              states('sensor.daily_energy_export_DE2') | float * 0.10 -
              states('sensor.daily_energy_export_DE3') | float * 0.04 +
              0.7400) | round(2) }}
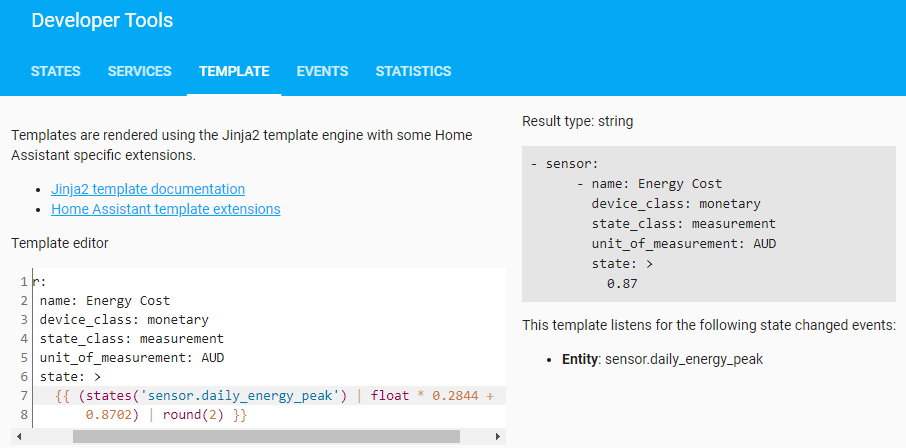
Example:

While I was at it, I decided to apply the same logic to the day before.
  - sensor:
      - name: Yesterday Energy Total Cost
        device_class: monetary
        unit_of_measurement: AUD
        state: >
          {{ (state_attr('sensor.daily_energy_DE_Peak','last_period') | float * (0.4961 * 0.73) +
              state_attr('sensor.daily_energy_DE_Shoulder','last_period') | float * (0.2052 * 0.73) +
              state_attr('sensor.daily_energy_DE_OffPeak','last_period') | float * (0.1675 * 0.73) -
              state_attr('sensor.daily_energy_export_DE1','last_period') | float * 0.16 -
              state_attr('sensor.daily_energy_export_DE2','last_period') | float * 0.10 -
              state_attr('sensor.daily_energy_export_DE3','last_period') | float * 0.04 +
              0.7400) | round(2) }}
Example:

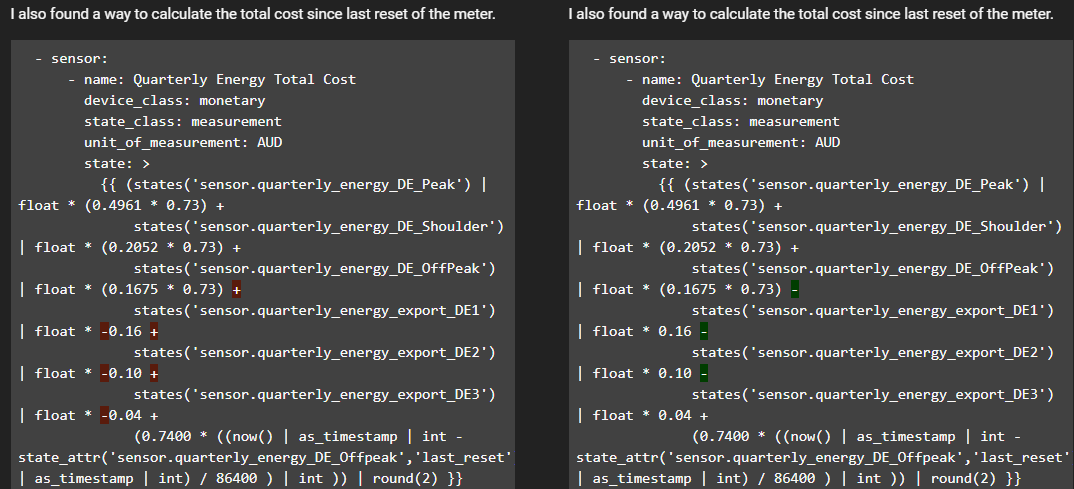
I also found a way to calculate the total cost since last reset of the meter.
  - sensor:
      - name: Quarterly Energy Total Cost
        device_class: monetary
        state_class: measurement
        unit_of_measurement: AUD
        state: >
          {{ (states('sensor.quarterly_energy_DE_Peak') | float * (0.4961 * 0.73) +
              states('sensor.quarterly_energy_DE_Shoulder') | float * (0.2052 * 0.73) +
              states('sensor.quarterly_energy_DE_OffPeak') | float * (0.1675 * 0.73) -
              states('sensor.quarterly_energy_export_DE1') | float * 0.16 -
              states('sensor.quarterly_energy_export_DE2') | float * 0.10 -
              states('sensor.quarterly_energy_export_DE3') | float * 0.04 +
              (0.7400 * ((now() | as_timestamp | int - state_attr('sensor.quarterly_energy_DE_Offpeak','last_reset') | as_timestamp | int) / 86400 ) | int )) | round(2) }}
Example:

For the above sensors, I was able to apply the 27% discount by multiplying the original price by 0.73 instead (100 - 27 = 73).
This turned out to be more efficient and gave more accurate detail in the pricing.
Also, notice the step at 12am everyday? That is the $0.74 daily service charge getting added at midnight.
All that was really left was the automation needed to cycle the meters at the same time my power company issues a new bill.
I first start with setting up some date time helpers for when my quarterly bills start/finish.


Then I can finally follow up with the automation to reset the quarterly meters.
- id: '1628744454766'
  alias: Quarterly Meter Reset
  description: ''
  trigger:
  - platform: time
    at: input_datetime.spring
  - platform: time
    at: input_datetime.summer
  - platform: time
    at: input_datetime.autumn
  - platform: time
    at: input_datetime.winter
  condition: []
  action:
  - service: utility_meter.reset
    target:
      entity_id:
      - utility_meter.quarterly_energy
      - utility_meter.quarterly_energy_export
  - service: notify.notify
    data:
      message: quarterly meter reset
  mode: single
There is 1 more sensor that I use to see how much power is costing me at this very moment.
Code for Instant Cost Per Hour
template:
  - sensor:
        name: Instant Cost Per Hour
        state_class: measurement
        unit_of_measurement: AUD
        device_class: monetary
        state: >
            {% set hourly = 0.7400 / 24 %}
            {% set gridout = states('sensor.grid_export_power') | int %}
            {% set gridin = states('sensor.grid_import_power') | int %}
            {% if gridout > 0 %}
              {{ ((gridout/1000) * (states('sensor.tariff_price_export') | float * -1) + hourly) | round(2) }}
            {% else %}
              {{ ((gridin/1000) * states('sensor.tariff_price') | float + hourly) | round(2) }}
            {% endif %}

I usually overlay this graph with the Today Energy Total Cost
And here are the last 2 elements I thought were important was an average cost per day as well as a bill forecast using all this data.
  - sensor:
        name: Average Cost Per Day
        state_class: measurement
        unit_of_measurement: AUD
        device_class: monetary
        state: >
            {{ (states('sensor.quarterly_energy_total_cost') | float / ((now() | as_timestamp - state_attr('sensor.quarterly_energy_shoulder','last_reset') | as_timestamp) / 86400)) | round(2) }}

  - sensor:
        name: Bill Forecast
        state_class: measurement
        unit_of_measurement: AUD
        device_class: monetary
        state: >
            {{ states('sensor.average_cost_per_day') | float * ((state_attr('input_datetime.summer','timestamp') | int - state_attr('sensor.quarterly_energy_shoulder','last_reset') | as_timestamp | int) / 86400) | round(0) }}

Then I was able to add all these elements into an always on dashboard in my home.
Final results:
Thats about it really. Happy to answer questions or try help out.


