Thanks. Yeah I think that one seems the top contender from my research.
I’ve gone a bit off custom components which is why I was hoping for a core one.
Fingers crossed this one becomes core soon.
The core BoM integration was removed because it used web scraping to gather data.
Bram developed the custom integration in response.
Beginner here. Is it possible for me to play alert notification on google home based on certain parameters like at 7AM it will broadcast to my google home speakers if its going to rain (% chance of rain) ?
Sure that is possible with an automation. Please start your own topic about it as it is not within the scope of this year old topic. How to help us help you - or How to ask a good question
Is this integration going to keep working after 14 March 2023? Github says “ This grabs data from an undocumented API that is used to provide data to https://weather.bom.gov.au/“ and that page says “ This page will be retired on 14 March 2023”
Not sure if is just the web page that is going to be retired or the undocumented API too. 
Good point 
We’ll find out on the 14th March.
The BoM app uses the same API as the web page, so the integration should continue to work. It’s only the website that is being retired.
1 Like
thanks for confirming.
Can I confirm if the BOM integration is still working, the page for the Integration says it’s no longer maintained. Mine doesn’t seem to be updating unless I reload Integration. I am on 1.2.0 I tried upgrading to 1.3.2 but the Integration page still shows I’m running 1.2.0?
Any feedback welcome, I’m not sure what is going on here.
Don’t believe the badge. It’s broken. There was a release only a week ago:

Working fine here.

HACS ('Im using the experimental interface):


Do you have a custom repository set for this integration?
You shouldn’t. It is a default HACS repository.


You’re on the latest version (1.3.2).
Looks like they forgot to update the version number somewhere. I see 1.2.0 on the Device page too.
1 Like
Sweet, thanks for confirming.
I am using @mlamberts78 Weather Chart Card to display my weather in Tasmania.
I use a combination of the out of the box Meteorologisk institutt (Met.no) & HACS installed BOM Weather once downloaded you install from the Devices and Services Page.
You can see that the Condition is not updated as often with the BOM Weather. BOM seems to follow what the weather condition will be over all for the day, rather than hour by hour.
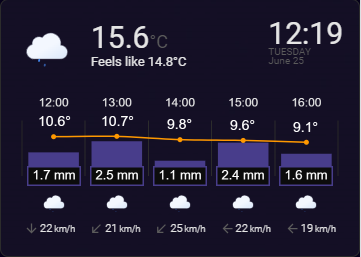
In the below image the top chart displays my hourly data. I use Meteorologisk institutt (Met.no) as the weather condition updates more regularly inline with the weather. Also gives a better per hour rain.
The bottom chart is data from BOM, I use this for my long term forecast, ideal because it give chance of rain and the amount.

Large Screen Conditional Card Code for the above cards. (A fair few configuration customization have been made to make these look like they do.
# THIS IS THE TOP CARD
          - type: conditional
            conditions:
              - condition: screen
                media_query: '(min-width: 768px)'
            card:
              type: custom:weather-chart-card
              entity: weather.home
              show_main: true
              show_temperature: true
              show_current_condition: false
              show_attributes: false
              show_time: true
              show_day: true
              show_date: true
              show_humidity: false
              show_pressure: false
              show_wind_direction: false
              show_wind_speed: false
              show_sun: false
              show_feels_like: true
              use_12hour_format: false
              icons_size: '60'
              animated_icons: true
              icon_style: style1
              forecast:
                precipitation_type: rainfall
                labels_font_size: '18.5'
                precip_bar_size: '70'
                precipitation_color: darkslateblue
                style: style2
                show_wind_forecast: true
                condition_icons: true
                round_temp: false
                type: hourly
                chart_height: '178'
                chart_text_color: white
                show_probability: true
                disable_animation: false
              units:
                pressure: hPa
                speed: km/h
              current_temp_size: '140'
              temp: sensor.netatmo_devonport_tas_indoor_outdoor_temperature
              title: ''
              winddir: sensor.devonport_airport_wind_direction
              windspeed: sensor.devonport_airport_gust_speed_kilometre
              humid: sensor.netatmo_devonport_tas_indoor_outdoor_humidity
              press: sensor.netatmo_devonport_tas_indoor_pressure
              feels_like: sensor.outside_feels_like_temperature
              show_time_seconds: false
              time_size: '80'
              day_date_size: '40'
              uv: null
              dew_point: sensor.dewpoint_outside
              wind_gust_speed: sensor.netatmo_devonport_tas_indoor_wind_gust_strength
              show_dew_point: false
              show_wind_gust_speed: false
              show_last_changed: false
# THIS IS THE BOTTOM CARD
          - type: conditional
            conditions:
              - condition: screen
                media_query: '(min-width: 768px)'
            card:
              type: custom:weather-chart-card
              entity: weather.devonport
              show_main: false
              show_temperature: false
              show_current_condition: false
              show_attributes: false
              show_time: true
              show_day: true
              show_date: true
              show_humidity: false
              show_pressure: false
              show_wind_direction: false
              show_wind_speed: false
              show_sun: false
              show_feels_like: true
              use_12hour_format: false
              icons_size: '40'
              animated_icons: true
              icon_style: style1
              forecast:
                precipitation_type: rainfall
                labels_font_size: '18.5'
                precip_bar_size: '80'
                precipitation_color: darkslateblue
                style: style2
                show_wind_forecast: false
                condition_icons: true
                round_temp: false
                type: daily
                show_probability: true
                chart_height: '200'
                chart_text_color: white
                temperature2_color: deepskyblue
                disable_animation: false
              units:
                pressure: hPa
                speed: km/h
              current_temp_size: '40'
              temp: sensor.netatmo_devonport_tas_indoor_outdoor_temperature
              show_dew_point: true
              show_last_changed: false
          - type: conditional
            conditions:
              - condition: screen
                media_query: '(min-width: 0px) and (max-width: 767px)'
            card:
              type: custom:weather-chart-card
              entity: weather.devonport
              show_main: false
              show_temperature: false
              show_current_condition: false
              show_attributes: false
              show_time: false
              show_day: true
              show_date: true
              show_humidity: false
              show_pressure: false
              show_wind_direction: false
              show_wind_speed: false
              show_sun: false
              show_feels_like: false
              use_12hour_format: false
              icons_size: '40'
              animated_icons: true
              icon_style: style1
              forecast:
                precipitation_type: rainfall
                labels_font_size: '11'
                precip_bar_size: '80'
                precipitation_color: darkslateblue
                style: style2
                show_wind_forecast: false
                condition_icons: true
                round_temp: false
                type: daily
                show_probability: true
                chart_height: '100'
                chart_text_color: white
                temperature2_color: deepskyblue
                disable_animation: false
              units:
                pressure: hPa
                speed: km/h
              current_temp_size: '40'
              temp: sensor.netatmo_devonport_tas_indoor_outdoor_temperature

Small Screen Conditional Card Code for the above cards.
#TOP CARD
          - type: conditional
            conditions:
              - condition: screen
                media_query: '(min-width: 0px) and (max-width: 767px)'
            card:
              type: custom:weather-chart-card
              entity: weather.home
              show_main: true
              show_temperature: true
              show_current_condition: false
              show_attributes: false
              show_time: true
              show_day: true
              show_date: true
              show_humidity: false
              show_pressure: false
              show_wind_direction: false
              show_wind_speed: false
              show_sun: false
              show_feels_like: true
              use_12hour_format: false
              icons_size: '30'
              animated_icons: true
              icon_style: style1
              forecast:
                precipitation_type: rainfall
                labels_font_size: '13'
                precip_bar_size: '80'
                precipitation_color: darkslateblue
                style: style2
                show_wind_forecast: true
                condition_icons: true
                round_temp: false
                type: hourly
                chart_height: '100'
                chart_text_color: white
                show_probability: true
                disable_animation: false
              units:
                pressure: hPa
                speed: km/h
              current_temp_size: '30'
              temp: sensor.netatmo_devonport_tas_indoor_outdoor_temperature
              title: ''
              winddir: sensor.devonport_airport_wind_direction
              windspeed: sensor.devonport_airport_gust_speed_kilometre
              humid: sensor.netatmo_devonport_tas_indoor_outdoor_humidity
              press: sensor.netatmo_devonport_tas_indoor_pressure
              feels_like: sensor.outside_feels_like_temperature
              show_time_seconds: false
              time_size: '30'
              day_date_size: '10'
              wind_gust_speed: sensor.netatmo_devonport_tas_indoor_wind_gust_strength
              dew_point: sensor.dewpoint_outside
              uv: null
              show_dew_point: false
              show_wind_gust_speed: false
              show_last_changed: false
# BOTTOM CARD
          - type: conditional
            conditions:
              - condition: screen
                media_query: '(min-width: 0px) and (max-width: 767px)'
            card:
              type: custom:weather-chart-card
              entity: weather.devonport
              show_main: false
              show_temperature: false
              show_current_condition: false
              show_attributes: false
              show_time: false
              show_day: true
              show_date: true
              show_humidity: false
              show_pressure: false
              show_wind_direction: false
              show_wind_speed: false
              show_sun: false
              show_feels_like: false
              use_12hour_format: false
              icons_size: '40'
              animated_icons: true
              icon_style: style1
              forecast:
                precipitation_type: rainfall
                labels_font_size: '11'
                precip_bar_size: '80'
                precipitation_color: darkslateblue
                style: style2
                show_wind_forecast: false
                condition_icons: true
                round_temp: false
                type: daily
                show_probability: true
                chart_height: '100'
                chart_text_color: white
                temperature2_color: deepskyblue
                disable_animation: false
              units:
                pressure: hPa
                speed: km/h
              current_temp_size: '40'
              temp: sensor.netatmo_devonport_tas_indoor_outdoor_temperature
BOM Provides a heap of other sensors that you can drive automations with and extract data.
This post gives a guide to what BOM Provides.
2 Likes
Sorry to revisit this, Does your current temp update regularly? Mine is now 2 days out of date. I installed Tommor.io integration to test and it updates every couple of hours. I’m sure the BOM data used to update but it appears to have stopped recently. Any thoughts?
Yes mine does:

![]()
Maybe check the BoM ID you are using (in the sensor attributes). It might be a station that is not updated often. You can check the observations on the BoM website.
1 Like
Thanks, I’ve changed the station and will monitor updates. Strange it stopped, I’ve been using same one forever.