“Failed to call service alarm_control_panel/ALARM_YAML_SAVE.” when trying to select sensors in alarm settings. Running 0.87.1
Change your panels/alarm.html so in every t.toLocaleString call (there are 2 in there) it does not use timezone, like this:
from
return t.toLocaleString('en-GB', { timeZone: 'UTC' }).split(",")[1] + " - " + t.toLocaleString('en-GB', { timeZone: 'UTC' }).split(",")[0];
to
return t.toLocaleString('en-GB').split(",")[1] + " - " + t.toLocaleString('en-GB').split(",")[0];
and don’t forget to clear your browser(s)’ cache
there is a PR here
Thanks!!
I suppose then there is also a way to switch the date to mm-DD-yyyy vice dd-mm-yyyy in there as well?
you can try this:
replace all calls of
toLocaleString('en-GB', { timeZone: 'UTC' })
to
toLocaleString('en-US', { hour12: false })
for more info check that out
In addition to the bugs that @AhmadK mentioned, (and akasma74 on github put in PR’s for. I hope they get merged soon!)
I’m having problems writing the configuration when trying to select sensors from the frontend.
I get:
Failed to call service alarm_control_panel/ALARM_YAML_SAVE.
However, settings on the other pages do get written.
Hi.
Running Hassio 0.87.1 and latest version of the alarm. Everything seems to work fine, but in Safari (not in eg. Chrome) I keep getting an error in the log when accessing the alarm-panel:
https://mydomain.com/local/lib/jscolor.js:532:50 TypeError: undefined is not an object (evaluating 'e.path[0]')
Is this something that’s easy fixable?
It would be great if you could file a bug report on Github or at least describe how to reproduce the issue.
I tried to select a lot of sensors for all modes, and it works fine, no errors in the log.
If you search this thread, you’ll find it’s and old issue with OS X/iOS browsers.
Check that out
Thanks. I did search the thread, but I only searched for “jscolor.js:532:50” and therefore didn’t see the specific post you are pointing to. Not my intention to seem lazy 
That did it! Once again, thanks!
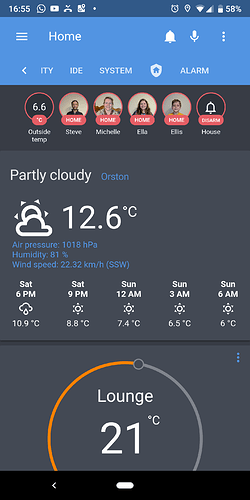
Is there a way to get the alarm to show up as a tab across the top of Lovelace in addition to the left side?
Or maybe as a card in an existing tab?
sorry edited as i had 2 methods mixed up lol.
i have just created a new tab and put the url: alarm
and checked the panel switch
2 questions:
- how exactly did you create a new tab and what did you do with it?
- the last screenshot, is it from a tablet? that clipping of alarm state and time is pretty annoying, and with the latest alarm update the bottom icons are unnecessarily HUGE :\
I am using yaml mode.
I added this but the tab is blank (it’s not really “secret” just edited it for this post):
  - title: Alarm
url: https://secret.duckdns.org/alarmjust use the built in ui editor in lovelace
3 dots top right
yes that was off my phone as i just wanted to give a screenshot easily. it doesn’t scale the best lol but fine on my pc or 7" tablet
I’ve finally got everything perfect.
the ide is a great addon too plus i found a backup to google drive addon  .
.
ive also got the mqtt alarm panel app working again after following the pull requests in github plus the alarm log ones for displaying which sensor triggered
all with no errors in the log lmao
scroll right on header to reveal the red +
sorry i missed a section.
just press 3 dots and goto ui configuration then hit the 3 dots again and select raw edit mode.
then add the bottom card from this screenshot manually.
i will push my config files to my github later, I’ve just got a couple of secrets to sort out 1st 
Thanks for showing the code. That worked in my yaml file for Lovelace. Thanks!


