It’s been a while since I last published an in-depth article, and I wanted to make one about debugging. It’s quite obviously an intermediate-to-advanced level because HA increasingly “hides” complexity, which is a good thing. But if you are like me, a control freak, and quickly get upset when things aren’t acting as expected, well, this one is for you.
1 - Debugging with the internal tools
Obvious but necessary. Those tools are a treasure trove. It takes a bit of time to realize the beauty of their completeness. In the recent HA versions, you’ll find them in Settings → Developer tools
1.1) Developer tools
Template debugger
This is my go-to whenever I create a template, especially for triggers and conditions. When I write a Jinja2 templated condition or trigger, I first cut/paste it into the template debugger to see if it spits an error. It becomes easy to see right away if a sensor exists, if you have a syntax issue, or, most commonly for me, if you compare a string to an integer or something similar. 10 seconds check, hours of headache. This is a reflex to build.
Example of condition I tend to test:
- "{{ (as_timestamp(now()) - as_timestamp(state_attr('automation.alarm_security_tiggers','last_triggered'), 0) | int > 600) }}"
Or a trigger:
     - trigger: template
       value_template: >
         {%- set count = namespace() %}
         {%- set count.value = 0 %}
         {%- for sensor in expand('group.presence_detectors') -%}
           {%- if (now() - sensor.last_changed) < timedelta(seconds=90) -%}
             {%- set count.value = count.value +1 %}
           {%- endif -%}
         {%- endfor %}
         {%- for pirs in expand('group.outdoor_pirs') -%}
           {%- if (now() - pirs.last_changed) < timedelta(seconds=90) -%}
             {%- set count.value = count.value +1 %}
           {%- endif -%}
         {%- endfor %}
         {{ count.value >1 }}
States
There is more to unpack than meets the eye.
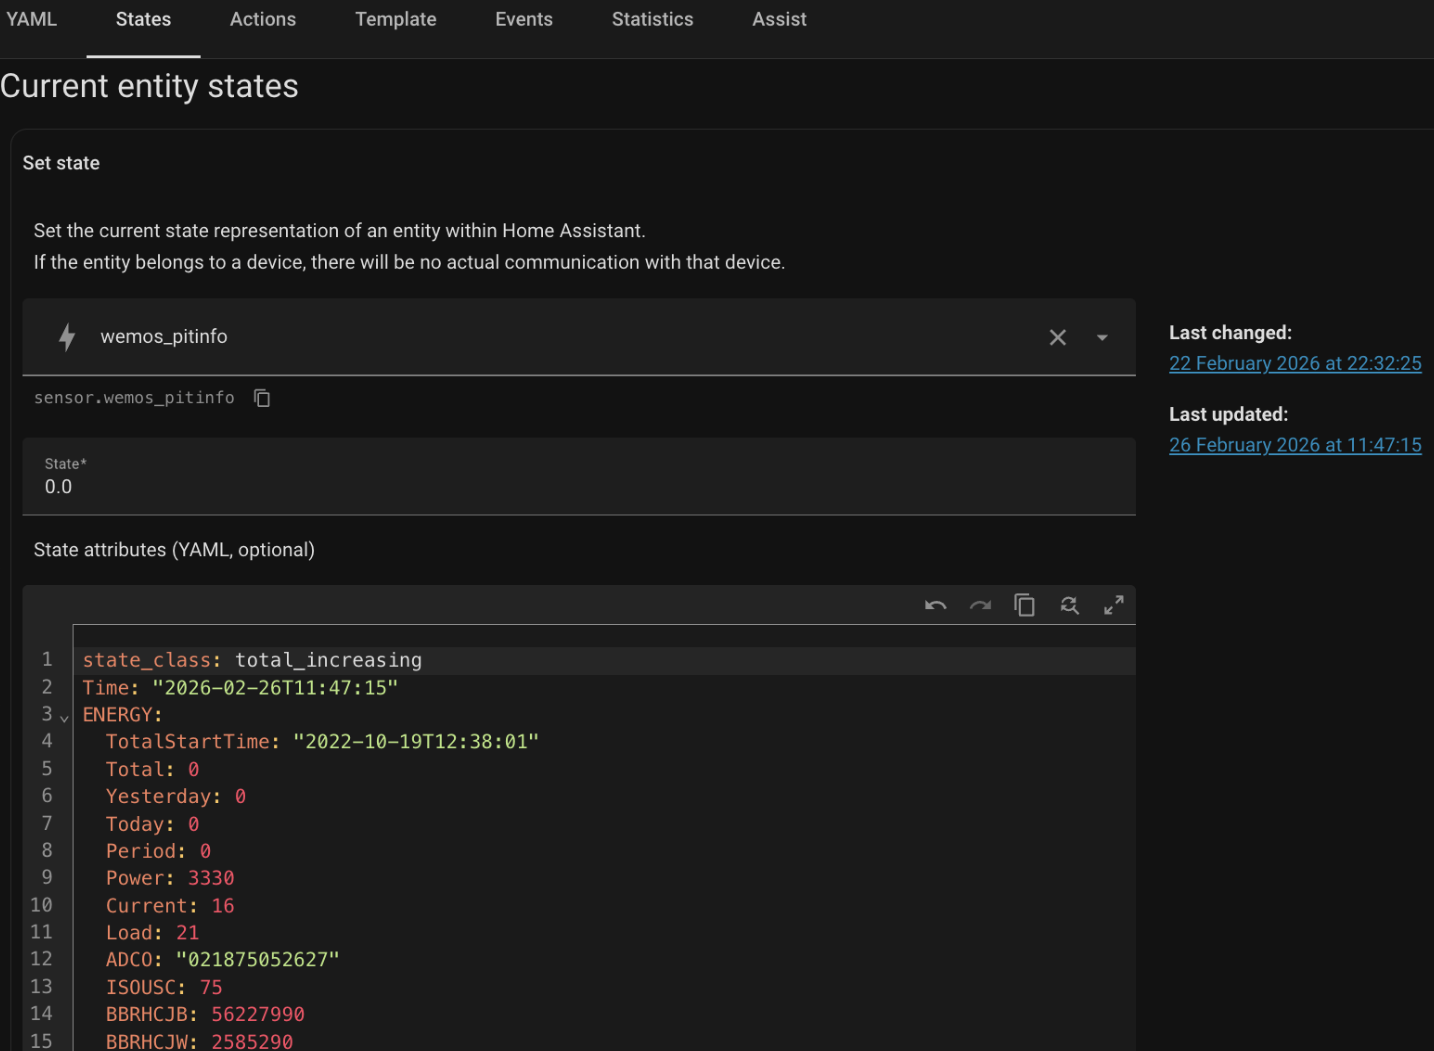
1st, see the cut/paste icon just below the sensor name, quite useful. You look for an entity, you type in a part of the name, HA finds it, you can then cut/paste it. Also the date on the right is an hyperlink to the history of the entity, which allows you to graph quickly it’s historical values. Then you can force the state and below you see the value of it and it’s various other attributes. Here my wemos.pitinfo is getting my main electric counter value (0 here because my solar PV are producing) and all other attributes.
Actions
The Action tab allows kicking a script or automation and checking if it passes the test. It’s practical because you can see the return code of HTTP queries, for example, or shell scripts if they have an output. It’s also good to know your action is understood by HA. Same principle as Jinja templates in the debugger, make it a habit and spare yourself time.
Events
I find this one particularly useful when using MQTT. You can input a request and see the result, or just listen to all MQTT events or those of a specific category. Now, this isn’t limited to MQTT; you can just listen to any event type you’re looking for. HA, being an event-based system, you can also simulate events by firing on which will trigger your automations, for example. You may also want to test an ESP listening to MQTT messages sent by HA. So you can fire your mqtt_pub from a Linux CLI or just use HA UX. Listening to “*” is usually very verbose, but you can find a list of the events here to narrow down.
Statistic
Who didn’t crash a long-term sensor because a ZHA or Zwave update ruined a specific entry? Or just you botched a template used in a utility meter, and well, now this graph looks like nothing. Statistic correction is exactly here to help you fix a value without pulling your favorite SQL wrapper. Better even, it’ll help you identify outliers quickly.
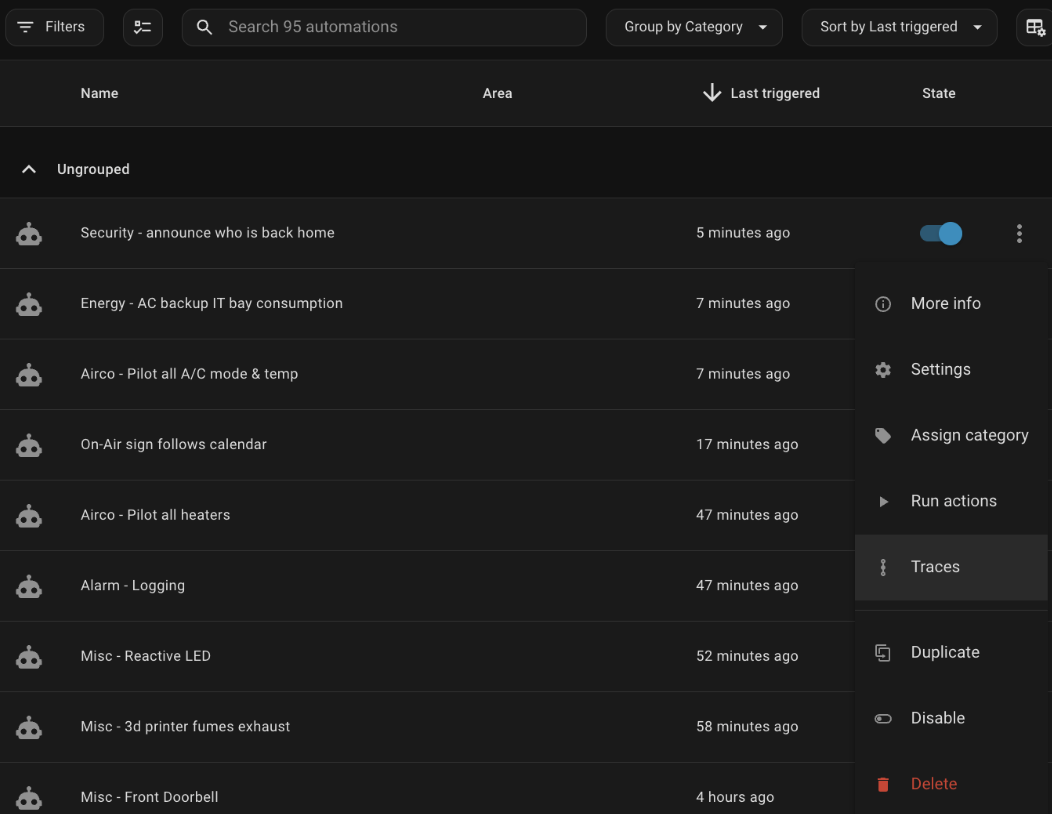
1.2) Automations & Scripts traces
Located in Settings → Automations & scenes.
This one is pure gold, let’s dive into it:
First, just know that what I explain here is also valid for scripts and not only automations.
Now you can click the 3 dot menu and “run actions” or use “traces”. Run actions will ignore triggers and conditions of your automations/scripts and only run … the actions. Quite obvious. If those actions are containing some if/then, I think they are still being evaluated though.
But the gold mine is … traces and its many facets:
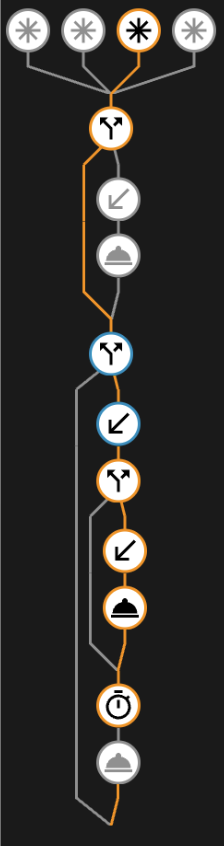
Here, we can see the 4 triggers which may start an automation on top, then the conditional branching and the actions taken.
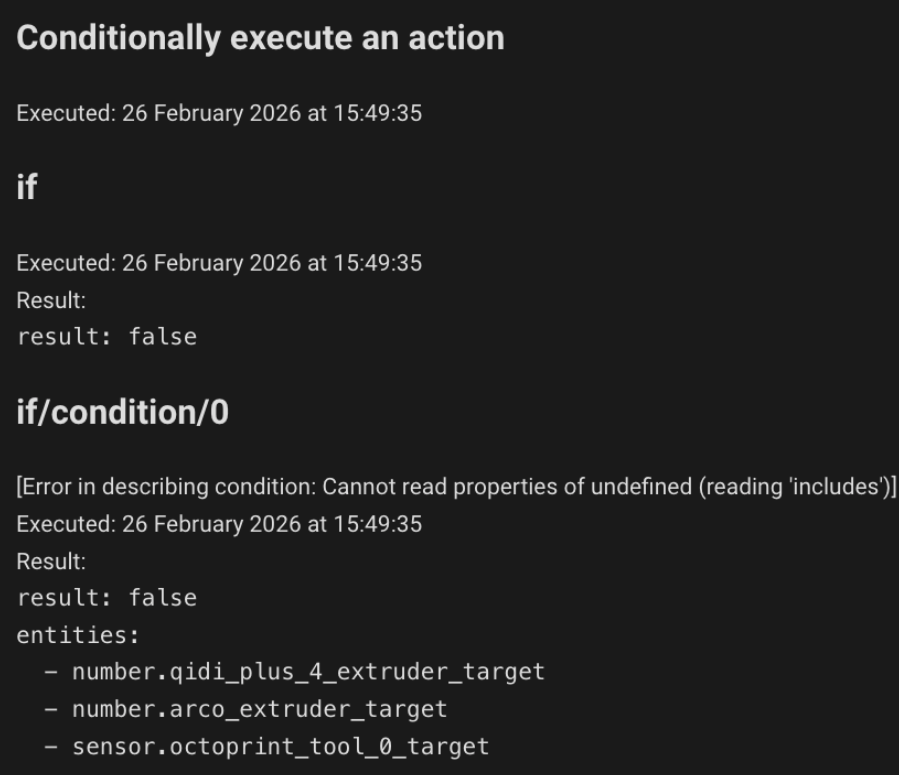
On the right block we can see details of the currently selected step in the tree, here, the conditional evaluation, with the values returned when applicable. (don’t mind the error in describing condition, old bug)
Above it, you have a date selector to see the last 3 executions and in the tabs of this block you’ll also see the trace timeline. If anything went wrong in an automation or script, you’ll find where, why and how 95% of times in this tracer. If not… there is a advanced mode: in the upright corner, click the 3 dot menu button and select “Download trace”. You’ll get a raw dump file that sometimes includes extra details on why it fails and previous execution iterations.
1.3) “ha core logs”
I’ll just lightly cover this one since we’ll put together a much better way.
Long story short, start the shell (install the addon ssh if need be) and in the window, type in “ha core logs”. Well you’ll see the last lines, it’s messy, not very descriptive, etc. Good for survival but not really for long term. More about this soon.
2 - Configurations, scripts, automations & widgets
2.1) YAML Configuration
We need traces. So we need proper logger configuration along with a few options.
In configuration.yaml:
system_log:
 max_entries: 15
 fire_event: true # set to true to receive notification if a problem is detected in the logs
Carefull here, this could become intensive on your system is set too high.
If you get sudden slow downs, turn if back off and revisit. Next, the logger.yaml:
default: warning
filters:
 homeassistant.components.homekit.util:
   - "media_player.philips_tv_2"
 homeassistant.components.websocket_api.http.connection:
   - "Received invalid command: mobile_app/push_notification_channel"
 frontend.js.modern:
   - "Uncaught error from Chrome"

logs:
 #homeassistant.components.zha: warning
 #zigpy: warning
 homeassistant.components.zha.core.device: warning
 homeassistant.components.device_tracker.unifi: error
 homeassistant.components.sonos.speaker: error
 homeassistant.components.nanoleaf: error
 homeassistant.components.device_tracker.iphonedetect: error
 homeassistant.core: warning
 homeassistant.components.mqtt: warning
 homeassistant.components.python_script: error
 aiohttp: error
 custom_components.spotcast: warning
 custom_components.localtuya.common: error
 ring_doorbell.doorbot: error
 custom_components.moonraker: error
Some things are to be logged always, other on error or warnings only, some need to be ignored because they repeat but you don’t care, etc and finally some need to be activated only when needed, if you actively troubleshoot something. Your burger, your sauce.
2.2) Scripts & Automation
Here is an automation I like, which isolate logs which are problematic in separate files:
 - id: "510121"
   alias: Misc - HA - Automation log error handling
   description: Capture HA automation/script warnings & errors and log them via my logger
   mode: queued
   max: 5
   initial_state: true
   triggers:
     - trigger: event
       event_type: system_log_event
   conditions:
     - condition: template
       value_template: >
         {% set d = trigger.event.data | default({}) %}
         {% set lvl = (d.get('level','') | string | upper) %}
         {% set n = (d.get('name','') | string) %}
         {# system_log_event level is typically WARNING or ERROR #}
         {% set is_error = lvl in ['ERROR','CRITICAL'] %}
         {% set is_ha_auto =
             n.startswith('homeassistant.components.automation')
             or n.startswith('homeassistant.components.script')
             or n.startswith('homeassistant.helpers.script')
             or n.startswith('homeassistant.helpers.service')
         %}
         {{ is_error and is_ha_auto }}
   actions:
     - variables:
         d: "{{ trigger.event.data | default({}) }}"
         summary: >-
           [{{ (d.get('level','') | string | upper) }}] {{ d.get('name','unknown.logger') }}
           — {{ (d.get('message','') | string) | replace('\n',' | ') }}
           {% if d.get('source') %} @ {{ d.get('source') }}{% endif %}
           {% if d.get('exception') %} :: {{ (d.get('exception') | string) | replace('\n',' | ') }}{% endif %}
     - action: script.uns
       data:
         log_facility: errors
         logbook: true
         message: "{{ summary }}"
(Much) More about script.uns below, but suffice to say it’s my goto to replace every other notification system.
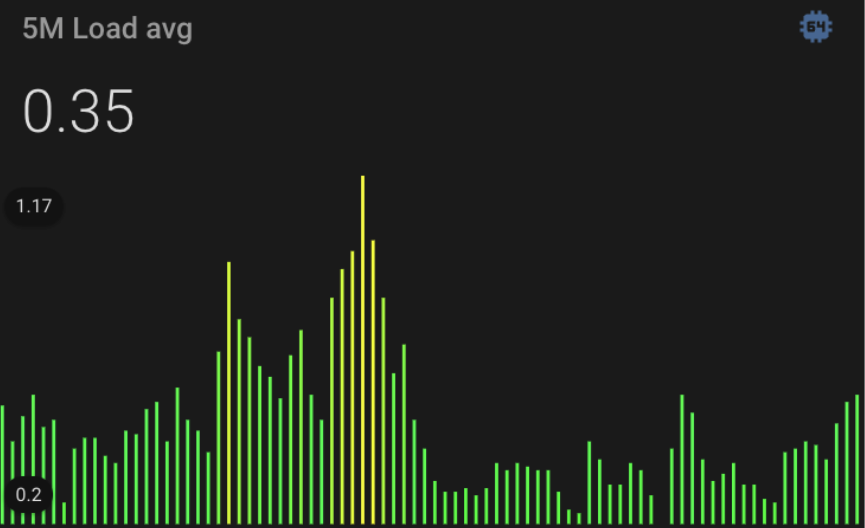
2.3) Dashboard Widget
I’m graphing my raspi5 CPU:
type: custom:mini-graph-card
hours_to_show: 7
points_per_hour: 12
cache: true
smoothing: false
height: 200
line_width: 0
show:
  graph: bar
  fill: false
color_thresholds:
  - value: 0
    color: "#00FF00"
  - value: 0.5
    color: "#00FF50"
  - value: 1
    color: "#ffff00"
  - value: 1.5
    color: "#FFFF50"
  - value: 2
    color: "#FF0000"
entities:
  - name: 5M Load avg
    entity: sensor.load_5m
    graph: bar
    show_state: true
    show_points: true
    labels: true
    aggregate_func: max
    group_by: interval
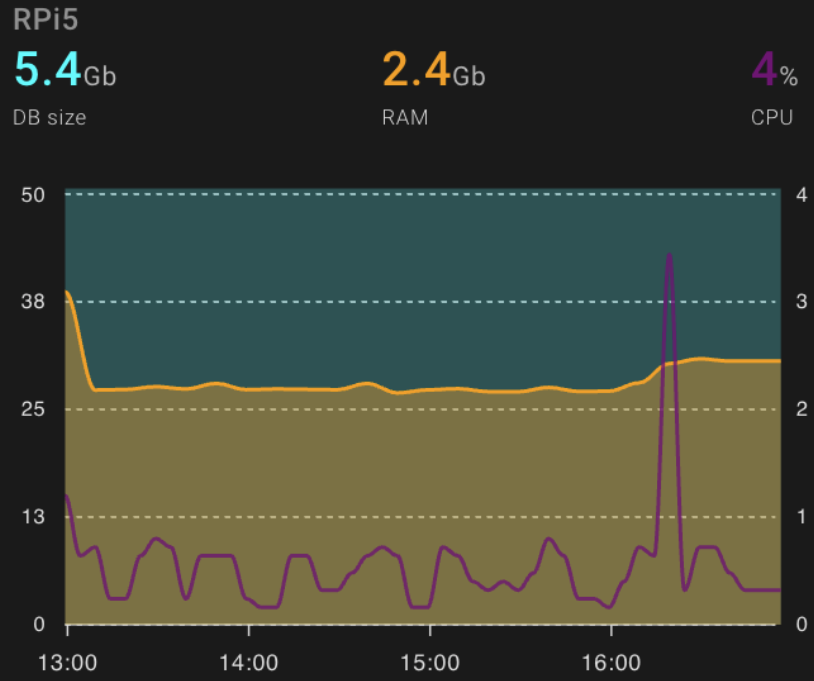
Checking my ram as well:
type: custom:apexcharts-card
graph_span: 4h
update_interval: 5min
header:
  show: true
  title: RPi5
  show_states: true
  colorize_states: true
apex_config:
  legend:
    show: false
  dataLabels:
    enabled: false
  tooltip:
    x:
      format: ddd dd MMM
yaxis:
  - id: first
    opposite: false
    min: 0
    max: ~50
    decimals: 0
    apex_config:
      tickAmount: 4
    show: true
  - id: second
    opposite: true
    min: 0
    max: 4
    decimals: 0
    apex_config:
      tickAmount: 4
    show: true
series:
  - entity: sensor.home_assistant_v2_db_size
    transform: return(x/1024)
    name: DB size
    yaxis_id: second
    type: area
    opacity: 0.25
    stroke_width: 0.05
    unit: Gb
    color: cyan
    group_by:
      func: last
      duration: 5min
    show:
      datalabels: false
  - entity: sensor.memory_use
    name: RAM
    transform: return(x/1024)
    yaxis_id: second
    type: area
    opacity: 0.4
    stroke_width: 2
    color: orange
    unit: Gb
    group_by:
      func: last
      duration: 10min
    show:
      datalabels: false
  - entity: sensor.processor_use
    name: CPU
    yaxis_id: first
    type: line
    opacity: 0.8
    stroke_width: 2
    unit: "%"
    color: purple
    group_by:
      func: last
      duration: 5min
    show:
      datalabels: false
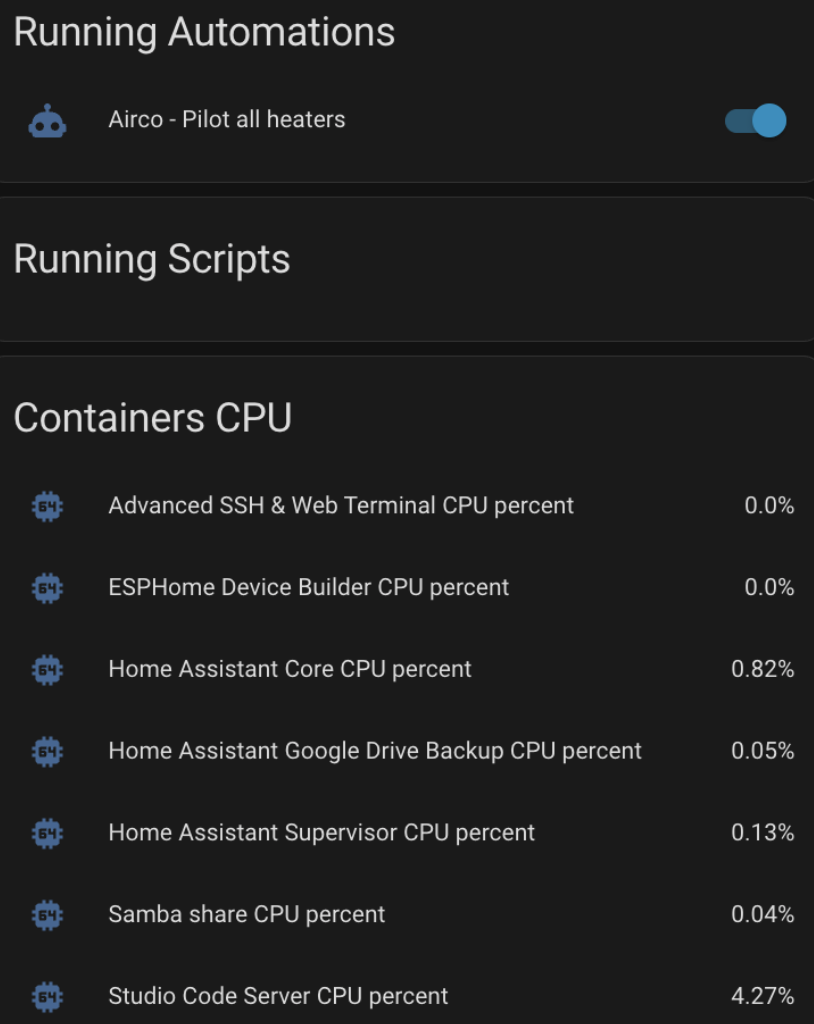
Checking the containers health:
type: vertical-stack
cards:
  - type: custom:auto-entities
    card:
      type: entities
      title: Running Automations
    filter:
      exclude:
        - state: unavailable
        - attributes:
            current: "= 0"
      include:
        - domain: automation
    show_empty: true
    sort:
      ignore_case: true
      method: name
  - type: custom:auto-entities
    card:
      type: entities
      title: Running Scripts
    filter:
      exclude:
        - state: "off"
        - state: "unavailable"
      include:
        - domain: script
    show_empty: true
    sort:
      ignore_case: true
      method: name
  - type: custom:auto-entities
    card:
      type: entities
      title: Containers CPU
    filter:
      exclude:
        - entity_id: sensor.z_wave_js_cpu_percent
        - entity_id: sensor.ring_mqtt_with_video_streaming_cpu_percent
        - entity_id: sensor.z_wave_js_memory_percent
        - entity_id: sensor.ring_mqtt_with_video_streaming_memory_percent
      include:
        - name: CPU
        - entity_id: sensor.*_cpu_percent
    sort:
      ignore_case: true
      method: name
3 - The advanced notification system I always wanted
I called it Universal Notification Script. It covers any kind of notification I can want so far. Could be better with interactive notification and all, but it’s a strong start:
#-------- UNIVERSAL NOTIFICATION SYSTEM ----------------------------------------
 uns:
   mode: parallel
   alias: Universal Notification System
   fields:
     message:
       description: "Message to be distributed"
       example: "May the force be with you"
       required: true
     logbook:
       description: "Log message in the logbook"
       default: true
       required: false
     log_facility:
       description: "security|airco|safety|pool|zwave|evcars|misc|solar|energy|errors"
       example: "security (-> notify.security_log -> ~/8-security.log)"
       default: "misc"
       required: false
     emergency:
       default: False
       required: false
     notified_users:
       example: "me,her"
       description: "Send a notification to phone of listed persons"
       default: "me"
       required: false
     media_players:
       description: "Media players TTS to speak through"
       example: kitchen, office
     audio_cue:
       description: "A sound bit to play"
       example: "/local/siren.wav, /local/firealarm.wav, /local/dog.wav"
     image:
       description: "Image to attach."
       example: "/config/tmp/test.jpg"
       default: " "
     led:
       description: "Set the ESP reative LED to a color and rythm"
       example: "prio:90 flash:red:3 or prio:55 ttl:15s breathe:yellow or prio:65 ttl:5m breathe:blue"
       required: false
       default: "prio:60 train:orange:120/120:3"
   variables:
     urgent: >
       {% if (emergency is defined and emergency == true) %}
         {{ True }}
       {% else %}
         {{ False }}
       {% endif %}
     mediaplayers: >
       {% if (emergency is defined and emergency == 'true') or (media_players is defined and media_players == 'all') %}
         {{ '["media_player.kitchen","media_player.terrasse_sud","media_player.office","media_player.living","media_player.gaming_room","media_player.kid","media_player.kitchen"]' }}
       {% elif media_players is defined %}
         {{- '[' -}}
           {%- for i in media_players.split(',') -%}
             {% if loop.last%}
               {{- '"media_player.'+i|replace(' ','')+'"' -}}
             {% else %}
               {{- '"media_player.'+i|replace(' ','')+'",' -}}
             {% endif %}
           {%- endfor -%}
           {{- ']' -}}
       {% else %}
         none
       {% endif %}
     logto: >
       {% if log_facility == 'security' %}
         {{ "notify.security_log" }}
       {% elif log_facility == 'errors' %}
         {{ "notify.errors_log"}}
       {% elif log_facility == 'pool' %}
         {{ "notify.pool_log" }}
       {% elif log_facility == 'evcars' %}
         {{ "notify.evcars_log" }}
       {% elif log_facility == 'solar' %}
         {{ "notify.solar_log" }}
       {% elif log_facility == 'energy' %}
         {{ "notify.energy_log" }}
       {% elif log_facility == 'zwave' %}
         {{ "notify.zwave_log" }}
       {% elif log_facility == 'airco' %}
         {{ "notify.airco_log" }}
       {% elif log_facility == 'safety' %}
         {{ "notify.safety_log" }}
       {% elif log_facility == 'misc' %}
         {{ "notify.misc_log" }}
       {% else %}
         {{ "notify.misc_log" }}
       {% endif %}
     img: >
       {% if image is defined %}
         {{ image }}
       {% else %}
         www/none.png
       {% endif %}
   sequence:
     - action: notify.send_message
       target:
         entity_id: "{{ logto }}"
       data:
         message: "{{ message }}"
     - if: "{{ logbook is defined }}"
       then:
         - action: logbook.log
           data:
             name: "{{ log_facility }}"
             domain: "text"
             message: "{{ message }}"
     - if: "{{ led is defined }}"
       then:
         - action: mqtt.publish
           data:
             topic: home/led/cmd
             payload: "{{ led }}"
     - if: "{{ notified_users is defined }}"
       then:
         - if: "{{ 'me' in notified_users and (now().hour not in (1,2,3,4,5,6,7,8) or urgent) }}"
           then:
             - action: shell_command.send_pushover # www/tmp/xyz.png for Pushover
               data:
                 message: "{{ message }}"
                 image: "{{ img }}"
         - if: "{{ 'her' in notified_users and now().hour not in (1,2,3,4,5,6,7,8)}}"
           then:
             - action: notify.mobile_app_iphone # "/local/tmp/xyz.png" for HA notifications
               data:
                 message: "{{ message }}"
                 data:
                   image: "{{ img | replace('www','/local') }}"
         - if: "{{ 'fabian' in notified_users and now().hour not in (1,2,3,4,5,6,7,8)}}"
           then:
             - action: notify.mobile_app_fabian_phone
               data:
                 message: "{{ message }}"
                 data:
                   image: "{{ img | replace('www','/local') }}"
     - if: "{{ mediaplayers != 'none' }}"
       then:
         - if: "{{ (now().hour not in (1,2,3,4,5,6,7,8) and states('group.homies') == 'home') or urgent }}"
           then:
             - action: tts.amazon_polly_say
               data:
                 entity_id: "{{ mediaplayers }}"
                 message: "{{ message }}"
             - if: "{{ audio_cue is defined }}"
               then:
                 - delay: 10 # Delay for the TTS to finish generating
                 - action: media_player.play_media
                   data:
                     entity_id: "{{ mediaplayers }}"
                     media_content_type: music
                     media_content_id: "{{ audio_cue }}"
And using the “file” integration, I created hooks for my personnalized log files:
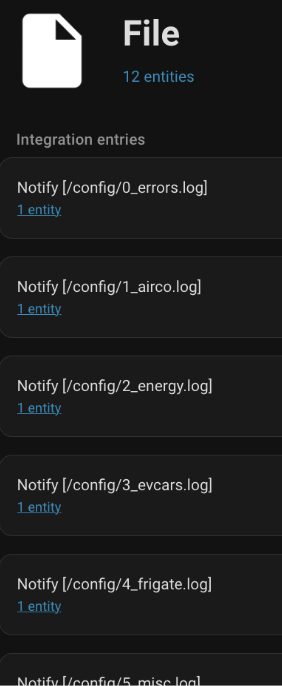
Okayyy, it’s a bit chunky but here are some usecase:
     - action: script.uns
       data:
         logbook: true
         log_facility: security
         notified_users: me
         emergency: true
         message: >
           {% for sensor in expand('group.security') -%}
             {% if (now() - sensor.last_changed) < timedelta(seconds=60) -%}
               {{- state_attr(sensor.entity_id, 'friendly_name').partition(' ')[0] + '|' -}}
             {% endif -%}
           {%- endfor %}
         media_players: gaming_room
         audio_cue: /local/dog.wav
It logs to the logbook, but also in a specific file named 8_security.log. So if I search for a precise problem regarding my EV, my cameras or Airco, I can directly look in the proper file. Handy really. The message is also voiced on the gaming room media player, here a dog is barking (it’s the alarm system). If the emergency flag is on, then I can be notified at night.
Another one, coupled with Frigate api:
     - repeat:
         for_each:
           - camera: camera.wyze
             entity_id: binary_sensor.living_room_person_occupancy
             where: "living room"
             image: "http://192.168.0.75:5000/api/wyze/latest.jpg?height=1080&quality=95"
           - camera: camera.rox
             entity_id: binary_sensor.pool_person_occupancy
             where: "south terrace"
             image: "http://192.168.0.75:5000/api/rox/latest.jpg?height=1080&quality=95"
           - camera: camera.rookie
             entity_id: binary_sensor.garage_person_occupancy
             where: "garage"
             image: "http://192.168.0.75:5000/api/rookie/latest.jpg?height=1080&quality=95"
           - camera: camera.sagittaire
             entity_id: binary_sensor.terrace_person_occupancy
             where: "north terrace"
             image: "http://192.168.0.75:5000/api/sagittaire/latest.jpg?height=1080&quality=95"
           - camera: camera.tic
             entity_id: binary_sensor.garden_person_occupancy
             where: "garden"
             image: "http://192.168.0.75:5000/api/tic/latest.jpg?height=1080&quality=95"
           - camera: camera.radada
             entity_id: binary_sensor.gate_person_occupancy
             where: "gate"
             image: "http://192.168.0.75:5000/api/radada/latest.jpg?height=1080&quality=95"
         sequence:
           - variables:
               ent: "{{ repeat.item.entity_id }}"
               recent: "{{ (now() - states[ent].last_changed).total_seconds() < 60 }}"
               stamp: "{{ now().strftime('-%H%MT%d%m%Y') }}"
               base: "{{ repeat.item.camera[7:] }}"
           - if: "{{ recent }}"
             then:
               - action: downloader.download_file
                 data:
                   overwrite: true
                   url: "{{ repeat.item.image }}"
                   filename: "{{ base ~ stamp ~ '.jpg' }}"
               - delay: 2
               - action: script.uns
                 data:
                   logbook: true
                   log_facility: security
                   notified_users: me
                   message: "Person detected in {{ repeat.item.where }} by {{ repeat.item.camera }}"
                   image: "{{ 'www/tmp/' ~ base ~ stamp ~ '.jpg' }}"
4 - Checking your containers’ health
Always a pain. Containers are great, until they’re not.
You basically run a mini OS of its own and it’s often hard to know what really happens inside. There are ways, but it’s tricky.
You can list running containers running:
sudo docker ps --format "table {{.ID}}\t{{.Names}}"
And from there on, explore what’s happening inside a specific container by running a bash into it:
docker exec -it addon_45df7312_zigbee2mqtt bash
5 - Shrinking your Database size
A classical hurdle in HA is the database size getting out of control.
5.1) Stop the bleeding
This is in recorder.yaml. Make it tighter.
purge_keep_days: 30
exclude:
 domains:
   - updater
   - alarm_control_panel
   - calendar
   - camera
   - climate
   - media_player
   - proximity
   - script
   - sun
   - vacuum
   - weather
   - zone
   - media_player
   - uptime
   - time_date
   - worldclock
   - system_log_event
 entities:
   - sun.sun
   - sensor.server_temp_cfac_temperature
   - sensor.server_temp_cfac_humidity
   - sensor.sonoff_100153d4ec_voltage
   - sensor.memory_free
   - sensor.memory_use
   - sensor.processor_temperature
   - sensor.memory_use_percent
   - sensor.processor_use
   - sensor.date
   - sensor.time
   - sensor.internet_time
   - sensor.solar_angle
   - sensor.home_assistant_v2_db
   - sensor.galaxy_tab_a7_free_memory
 entity_globs:
   - sensor.load_*
   - sensor.shellyem_*_channel_*_power
   - sensor.shellyem_*_channel_*_voltage
   - sensor.shelly_em_channel_*_power_factor
   - sensor.sonoff_*_power
   - sensor.sonoff_*_current
   - sensor.network_throughput_*
   - sensor.*_last_seen
   - sensor.faikin_*_ble_humidity
   - sensor.faikin_*_ble_temp
   - sensor.teleinfo*
   - sensor.smart_meter_*
   - sensor.faikin_*_humidity
   - sensor.*last_seen
   - sensor.sonoff_*_power
   - sensor.sonoff_*_current
   - sensor.sonoff_*_voltage
   - update.*
   - input_text.*
   - input_boolean.*
   - sensor.ipad*
   - sensor.roborock_s8_pro_ultra*
   - sensor.*last_seen
   - sensor.node_*_node_status
   - sensor.home*
 event_types:
   - service_registered
   - system_log_event
   - call_service
5.2) Clean the mess
This is a bit more dependent on your setup and SQL skills. If you use sqlite, you can add the “app” (addon) SQLite web to explore your database. Don’t overclick, requests take time.
The big picture:
SELECT
  SUM(pgsize) bytes,
  name
FROM dbstat
GROUP BY name
ORDER BY bytes DESC
(This one is loooong, count minutes)
This should show you the biggest tables.
Then, likely states and event_data should be your biggest ones.
To dig into them a bit more:
SELECT
  COUNT(*) as cnt,
  COUNT(*) * 100 / (SELECT COUNT(*) FROM events) AS cnt_pct,
  event_types.event_type
FROM events
INNER JOIN event_types ON events.event_type_id = event_types.event_type_id
GROUP BY event_types.event_type
ORDER BY cnt ASC
SELECT
  COUNT(*) AS cnt,
  COUNT(*) * 100 / (SELECT COUNT(*) FROM states) AS cnt_pct,
  states_meta.entity_id
FROM states
INNER JOIN states_meta ON states.metadata_id=states_meta.metadata_id
GROUP BY states_meta.entity_id
ORDER BY cnt ASC
For more about this topic, a great post here.
6 - Prompting LLMs to help you debug
I used Chatgpt to health check my packages and it did… awesome job.
The only thing is that the knowledge cutoff (when the LLM’s training data ended) should be considered. At the time of writing this, I use ChatGPT 5.2, and its knowledge horizon is August 2025. But this varies with models, and I tend to always refresh them about the updated syntax, which took place in October 2024. See release notes here. Just give it the link and tell it to apply the new syntax (trigger/triggers, service/actions, etc.)
(My other posts: 20 things I wished I knew when I started with Home Assistant || Integrate any remote in home assistant || Anti false positive PIR+camera alarm system || Automation from zero to hero || Securing & segregating your home network || Solar panel supervision || Daikin full automation)