This is a code to be used in yaml mode:
view: ...
...
cards:

  - type: custom:mini-graph-card
    entities:
      - entity: water_heater.vicare_water
This is a code to be used in storage mode - i.e.creating cards from UI:
type: custom:mini-graph-card
entities:
  - entity: water_heater.vicare_water
A view = a list of cards.
- abc
  jkkkkjkj
  yyyyyyyyyy
- def
  jjuuy
- 123abc
pepe59
December 12, 2021, 11:42pm
1932
If you are using user interfaces, remove the hyphen at type.
type: custom:mini-graph-card
entities:
  - entity: sensor.living_room_temperature
SteveA
December 20, 2021, 5:02pm
1933
It is possible to show_state for multiple entities in a single row as opposed to stacked across the right side? I am tracking 5 Temperature sensors and showing the legend it would be cleaner to show the legend and the current state together. Thanks
Possible with using hacks only.
You can use only options provided by the card + some tricks provided by card-mod.
[image]
Choose any background picture you want - blue, white or whatever…
type: picture-elements
card_mod:
style: |
ha-card {
height: 202px !important;
}
elements:
- &ref_card
type: 'custom:mini-graph-card'
entities:
- sensor.cleargrass_1_co2
show:
labels: true
name: false
align_state: left
upper_bound: 1000
lower_bound: ~400
line_color: green
l…
SteveA
December 20, 2021, 6:24pm
1935
Thank you. Perhaps a future enhancement for the show_legend option?
Initial idea of @kalkih (see here ), added some flexibility.
type: custom:mini-graph-card
entities:
  - entity: sensor.speedtest_local_download
  - entity: sensor.speedtest_local_upload
    y_axis: secondary
    show_state: true
show:
  labels: true
  labels_secondary: true
height: 300
hours_to_show: 24
line_width: 2
points_per_hour: 60
lower_bound_secondary: 0
lower_bound: 0
card_mod:
  style: |
    .line--rect,
    .fill--rect,
    .line--points {
      transform: scaleY(50%);
    }
    .line--rect:last-of-type,
    .fill--rect:nth-of-type(2),
    .line--points:last-of-type {
      transform-origin: center center;
      transform: rotateX(180deg) scaleY(50%) translateY(-150px);
    }
    .graph__labels.--secondary {
      flex-direction: column-reverse;
    }
    .graph__container__svg {
      margin-bottom: 20px
    }
Also, it is possible to to add a divider line as an X-axis:
type: custom:mini-graph-card
entities:
  - entity: sensor.speedtest_local_download
  - entity: sensor.speedtest_local_upload
    y_axis: secondary
    show_state: true
height: 200
show:
  labels: true
  labels_secondary: true
  fill: fade
card_mod:
  style: |
    .line--rect,
    .fill--rect,
    .line--points {
      transform: scaleY(50%);
    }
    rect.fill--rect:nth-of-type(1) {
      outline: 1px solid var(--secondary-text-color);
    }
    rect.fill--rect:nth-of-type(2),
    rect.line--rect:last-of-type,
    .line--points:last-of-type {
      transform-origin: center center;
      transform: rotateX(180deg) scaleY(50%) translateY(-100px);
    }
    .graph__labels.--secondary {
      flex-direction: column-reverse;
    }
    .graph__container__svg {
      margin-bottom: 16px;
    }
Find more card-mod examples .
5 Likes
Jonn87
December 28, 2021, 12:56am
1937
How can I set a title instead of a name?
Like this:
I tried setting a title parameter with show name to false, but it did,t work
You may set only parameters described in docs.
This simple code:
type: custom:mini-graph-card
entities:
  - entity: sensor.cleargrass_1_co2
    name: co2
hours_to_show: 24
name: My title
shows a whole graph name:
1 Like
Jonn87
December 29, 2021, 6:43am
1939
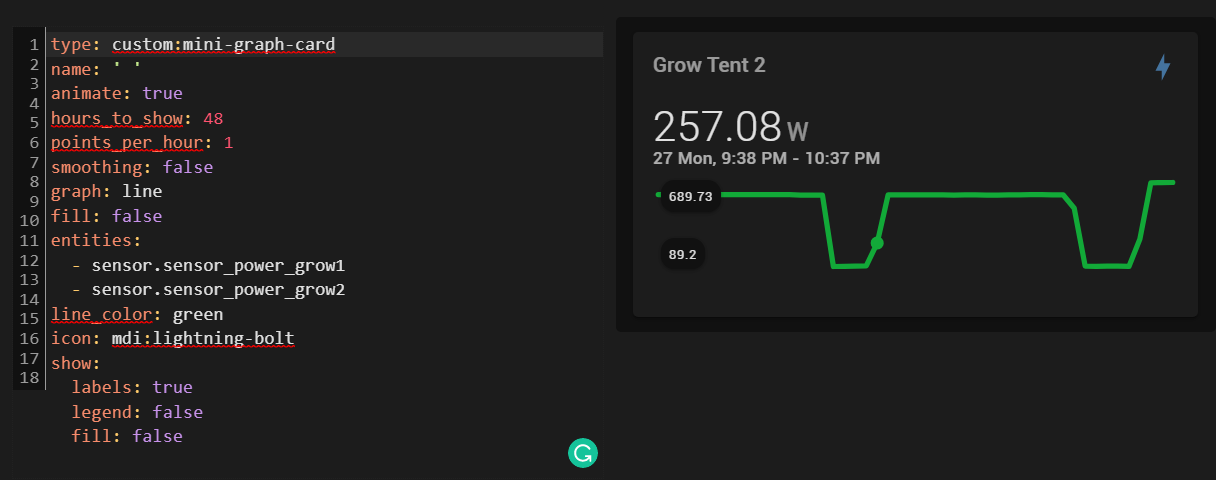
I’m charting power usage of a plug which is either consuming ~600W or ~90W, there is no in-between
But in mini-graph-chart it appears as is the power was 257W for a while, even when smoothing is disabled
These wrong values are displayed due to approximation.aggregate-functions
Jonn87
December 30, 2021, 12:02pm
1941
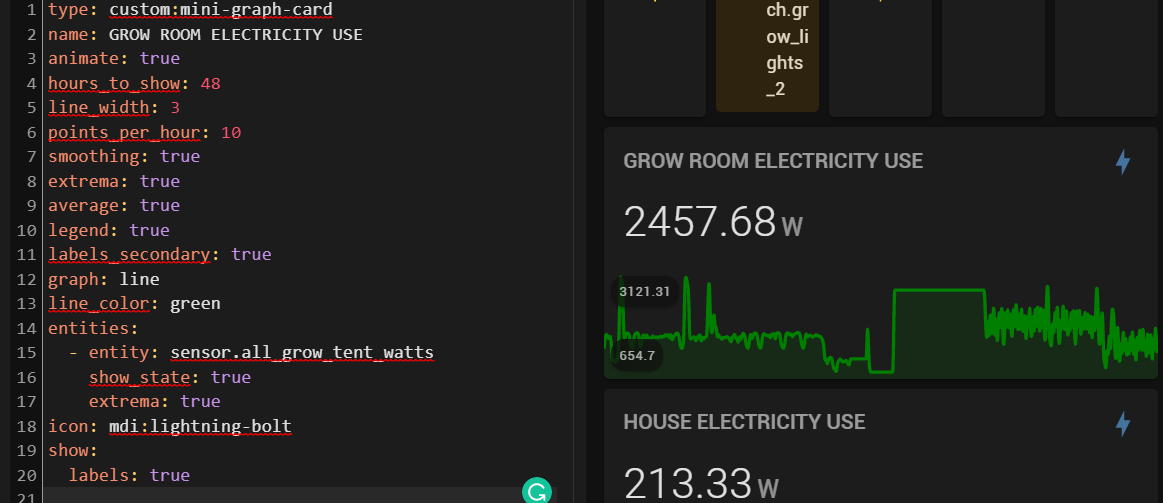
“aggregate_func: max” makes it a little better but still the same problem. Is there anything else I can do? I tried others aggregate parameters too
Try aggregate_func: last and more points_per_hour
1 Like
Jonn87
January 5, 2022, 2:46am
1944
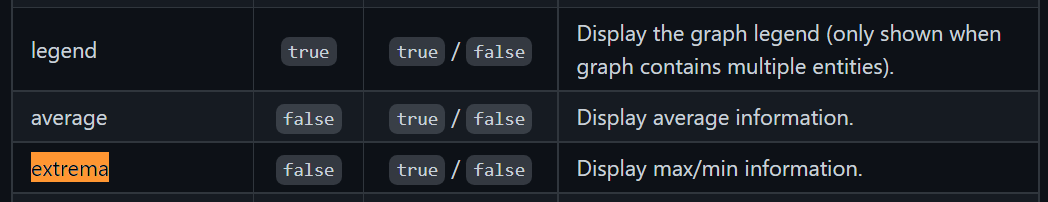
Thank you I got it fixed but I am wondering why the min/max values are not showing up when enabling extrema?
You have not enabled extrema - check the doc. As well as legend. The code contains misplaced options.
Jonn87
January 6, 2022, 9:44pm
1946
Which doc are you referring to? I’ve read many times this one: https://github.com/kalkih/mini-graph-card
And I’m not sure what I have to do with the legend either
See this section .show” section.
1 Like
How to set a color for the last bar:
  - type: custom:mini-graph-card
    entities:
      - entity: sensor.cleargrass_1_co2
    show:
      graph: bar
    card_mod:
      style: |
        rect.bar:last-of-type {
           fill: red;
        }
(as an answer for this issue )
More about card-mod .
MxDx
January 7, 2022, 3:47pm
1949
Hello, I was trying to make a stock graph where the color is red when the market is under the previous close value, but I not able to have variable in my code I don’t understand why. I already tried everything I could find here but it still doesn’t work.
type: custom:mini-graph-card
variables:
  - current_val: states['sensor.yahoofinance_cspx_as'].state
  - previous_market_close: stat_attr('sensor.yahoofinance_cspx_as', 'regularMarketPreviousClose')
entities:
  - sensor.yahoofinance_cspx_as
hours_to_show: 25
points_per_hour: 4
color_thresholds:
  - value: '${previous_market_close}'
    color: '#8AFF8A'
  - value: '${previous_market_close}'
    color: '#c0392b'
show:
  labels: true
  points: false
  y_axis: true
  show_line: true
  icon_adaptive_color: true
  extrema: true
parautenbach
January 7, 2022, 9:29pm
1950
Where in the mini graph card docs did you see this support for variables?
1 Like
CDRX2
January 8, 2022, 9:21am
1951
You’ll have to use config-template-card in combination with the mini-graph for what you want to achieve.
1 Like