Per-panel PV power / energy visualization (solaredge optimizer data)

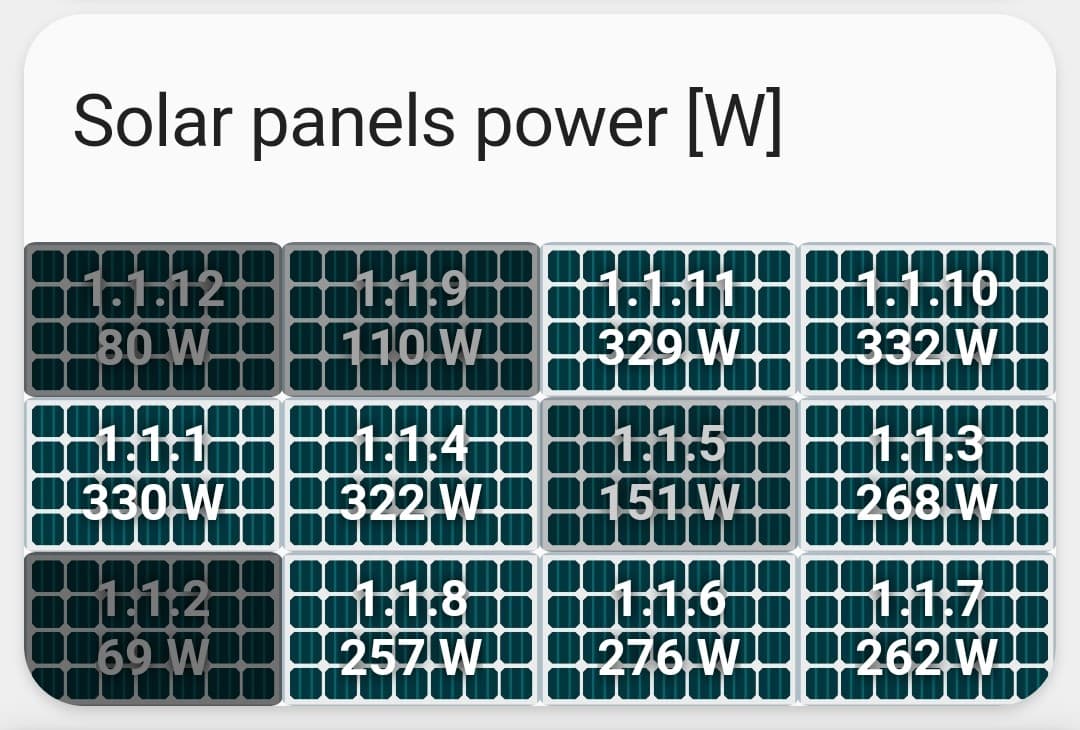
I made a yaml config to visualize the production of a grid of PV panels:

Credits to @Mariusthvdb for helping with the css :smiley:

To get per-panel optimizer data from my solaredge inverter I used the unofficial integration of SolarEdge Optimizers Data. Unfortunately the data is only available through webscraping.

The YAML config for the card is:

type: custom:stack-in-card
title: Solar panels power [W]
mode: vertical
cards:
  - type: horizontal-stack
    cards:
      - type: custom:button-card
        template: pv_panel
        entity: sensor.power_1_1_12
        name: 1.1.12
      - type: custom:button-card
        template: pv_panel
        entity: sensor.power_1_1_9
        name: 1.1.9
      - type: custom:button-card
        template: pv_panel
        entity: sensor.power_1_1_11
        name: 1.1.11
      - type: custom:button-card
        template: pv_panel
        entity: sensor.power_1_1_10
        name: 1.1.10
  - type: horizontal-stack
    cards:
      - type: custom:button-card
        template: pv_panel
        entity: sensor.power_1_1_1
        name: 1.1.1
      - type: custom:button-card
        template: pv_panel
        entity: sensor.power_1_1_4
        name: 1.1.4
      - type: custom:button-card
        template: pv_panel
        entity: sensor.power_1_1_5
        name: 1.1.5
      - type: custom:button-card
        template: pv_panel
        entity: sensor.power_1_1_3
        name: 1.1.3
  - type: horizontal-stack
    cards:
      - type: custom:button-card
        template: pv_panel
        entity: sensor.power_1_1_2
        name: 1.1.2
      - type: custom:button-card
        template: pv_panel
        entity: sensor.power_1_1_8
        name: 1.1.8
      - type: custom:button-card
        template: pv_panel
        entity: sensor.power_1_1_6
        name: 1.1.6
      - type: custom:button-card
        template: pv_panel
        entity: sensor.power_1_1_7
        name: 1.1.7

With the button-card template being:

button_card_templates:
  pv_panel:
    aspect_ratio: 200/120
    show_entity_picture: true
    show_icon: false
    show_state: true
    styles:
      name:
        - font-weight: bold
      card:
        - '--keep-background': 'true'
        - border-radius: 5%
        - text-shadow: 0px 0px 5px black
        - padding: '-10%'
        - background-image: |
            [[[ return  `url("/local/images/solarpanel_simple.png")`; ]]]
        - background-size: cover
        - background-repeat: no-repeat
        - color: white
        - text-transform: uppercase
        - font-weight: bold
        - background-color: rgb(255,235,171)
        - filter: |
            [[[
              return "brightness("+Math.min(100*(Math.round(Number(entity.state)) / 250 + 0.2), 100) + "%)"
            ]]]   
    state_display: |
      [[[
        return Math.round(Number(entity.state))+" W" 
      ]]]   

The solar panel was made in paint, using an example image:

image

You should put this image in config/www/images/solarpanel_simple.png for this to work.

(or any other location, but you will have to adapt this line in the button-card template: url("/local/images/solarpanel_simple.png") to reflect the change)

The card is pretty basic at this point, but it should be fairly easy to adapt the button-card template as it is very customizable.

1 Like

Nice!
might even re-install the integration providing those entities again. I had it installed but this makes for a nice addition to the solar dashboard indeed.

youā€™re sure this isnt a remnant of stack-in-card?
btw, I do believe we can get to those panels using the official Api, have to look it up

1 Like

because I have a failing optimizer, I figured why wasnt I notified by my providerā€¦ lets create my own monitor inside HA.

changed the card like this:

type: vertical-stack
cards:

  - type: custom:button-card
    template: button_default_title
    name: >

      [[[ let actueel = states['sensor.zp_actuele_opbrengst'].state;
          return 'Solar panels: ' + parseFloat(actueel).toFixed(2) + ' W'; ]]]

  - type: grid
    columns: 4
    square: false
    cards:
    #   - type: horizontal-stack
    #     cards:
          - type: custom:gap-card
          - type: custom:gap-card
          - type: custom:button-card
            template: pv_panel
            entity: sensor.power_1_1_7
            name: 1.1.7
          - type: custom:gap-card

          - type: custom:button-card
            template: pv_panel
            entity: sensor.power_1_1_15
            name: 1.1.15
          - type: custom:button-card
            template: pv_panel
            entity: sensor.power_1_1_20
            name: 1.1.20
          - type: custom:button-card
            template: pv_panel
            entity: sensor.power_1_1_6
            name: 1.1.6
          - type: custom:button-card
            template: pv_panel
            entity: sensor.power_1_1_2
            name: 1.1.2

etcetc

to mimick the layout in the Solar edge app of my strings. Not sure if I will add some background to the grid to make it better readable, will see. for now my main focus is creating some automation warning me of a single panel getting too low numbers, not sure how I must proceed.

Guess we should at least add the Voltage to the individual panels for the first glance, that might be a good red flag for issues

1 Like

HI Stefan,

trying to find a way to indicate my failing panel, I figured, since all of my panels are directed identically, only suffer some circling shade, so they should all have a reading not too widely spread, whinny create a ā€˜meanā€™ sensor in the helpers and compare the individual state to that:

    card:
      - border: >
          [[[ let gemiddeld = states['sensor.power_zonnepanelen_gemiddeld'].state;
              return entity.state < parseFloat(gemiddeld)/2 ? '2px solid red' : 'none'; ]]]

if the state is less than half of the mean, not would really be broken :wink:

on this horrific day for panel ownersā€¦ it ends up like this:

so I get a fait warning of the panel being broken.
Would my calculation be solid enough in your opinion, or would you suggest find the broken optimizer panel in another way. ofc we can also go into the other properties (amperage/voltage etc) but this seemed the quickest for now.

btw, as you can see I took out the filter because it made all panels dark, and unreadable in fact. Also made another panel image based on the solar edge app, and edited a bit in the templateā€¦

most importantly I change from using a name to label, swapping the content on the card. I want the state to be centered some more, but that I will take care of later on.

btw, I set the background of the title card to use the same image, as there seems to be an issue using the rgb colors of that image, and I couldnā€™t get it to be identical. This is a cool background too, so so far so good :wink:

pv_panel:
  aspect_ratio: 200/120
#   show_entity_picture: true
  show_icon: false
  show_state: true
  show_name: false
  show_label: true
  styles:
    name:
      - font-weight: bold
      - font-size: 14px
    label:
      - font-weight: bold
      - font-size: 12px
      - justify-self: center
      - align-self: end
      - padding: 0px 6px
      - color: black
    card:
      - border: >
          [[[ let gemiddeld = states['sensor.power_zonnepanelen_gemiddeld'].state;
              return entity.state < parseFloat(gemiddeld)/2 ? '2px solid red' : 'none'; ]]]

#       - border-radius: 5%
#       - text-shadow: 0px 0px 5px black
#       - padding: '-10%'
      - background-image: |
          [[[ return  `url('/local/images/solarpanel2.png')`; ]]]
      - background-size: cover
      - background-repeat: no-repeat
      - color: var(--text-color-off)
#       - text-transform: uppercase
      - font-weight: 400
      - font-size: 16px
#       - background-color: rgb(255,235,171)
#       - filter: |
#           [[[
#             return "brightness("+Math.min(100*(Math.round(Number(entity.state)) / 250 + 0.2), 100) + "%)"
#           ]]]

and the card:

type: vertical-stack
cards:

  - type: custom:button-card
    template: button_default_title
    styles:
      card:
        - background-image: |
            [[[ return  `url("/local/images/solarpanel2.png")`; ]]]
        - background-size: contain
#         - background: rgb(33,100,194) #'#2164c2'

    name: >

      [[[ let actueel = states['sensor.zp_actuele_opbrengst'];
          let gemiddeld = states['sensor.power_zonnepanelen_gemiddeld'];
          return 'Solar panels: ' + helpers.localize(actueel) + ' | ' +
                  'gemiddeld: ' + helpers.localize(gemiddeld); ]]]

  - type: grid
    columns: 5
    square: false
    cards:

          - type: custom:gap-card
          - type: custom:gap-card
          - type: custom:gap-card
          - type: custom:button-card
            template: pv_panel
            entity: sensor.power_1_1_7
            label: 1.1.7
          - type: custom:gap-card

or, a bit more eye catching:

pv_panel:
  template: extra_styles
  aspect_ratio: 1.5
#   show_entity_picture: true
  show_icon: false
  show_state: true
  show_name: false
  show_label: true
  variables:
    alert: >
      [[[ let gemiddeld = states['sensor.power_zonnepanelen_gemiddeld'].state;
              return entity.state < parseFloat(gemiddeld)/2; ]]]
  styles:
    label:
      - font-weight: bold
      - font-size: 12px
      - justify-self: center
      - align-self: end
      - color: black
    card:
      - border: >
          [[[ return variables.alert ? '2px solid red' : 'none'; ]]]
      - color: >
          [[[ return variables.alert ? 'red' : 'var(--text-color-off)'; ]]]
      - animation: >
          [[[ return variables.alert ? 'card_bounce 2s ease infinite' : 'none'; ]]]
      - background-image: |
          [[[ return  `url('/local/images/solarpanel2.png')`; ]]]
      - background-size: cover
      - background-repeat: no-repeat
      - font-weight: 400
      - font-size: 16px

Oct-05-2023 12-21-08

1 Like

For outlier detection you could calculate the standard deviation (sd) and the mean (mu) of the PV production of all your panels, and then for every panel check if itā€™s below: mu - 2*sd

(2 standard deviations below the mean has a probability of about 2.5%, you can go even lower to 3 standard deviations: 0.1%)

rightā€¦thx.

would you know if the statistics helper is any good at that, or would we need an old fashioned template.

(tbh, I was just wondering if we have to add all of the panels to 2 helpers, 1 for sum, and 1 for mean. Would somehow be nice if we had this as attributes for the same set of source entities, and not have to do all of that more than once)

btw adding a silver border gives those buttons a nice solar-panel look:

got to say the custom integration does make one nervous, as it has false alarms tooā€¦

I did take the 3* advice you gave me thereā€¦

Like this? (night now so ofc its 0, but its about the template for the detection value)

if yes, then Ill try and figure out a template for a total binary turning on if any of the panels has a value below that outlier entity

first effort:

{% set outlier = states('sensor.power_zonnepanelen_outlier')|float(0) %}
{{expand(integration_entities('solaredgeoptimizers'))
  |selectattr('entity_id','search','power')
  |map(attribute='state')
  |map('float')
  |select('<',outlier )
  |list
  |count > 0 }}

second:

{% set outlier = states('sensor.power_zonnepanelen_outlier')|float(0) %}
{{expand(['sensor.power_1_1_20','sensor.power_1_1_19','sensor.power_1_1_18', 
          'sensor.power_1_1_17','sensor.power_1_1_16','sensor.power_1_1_15',
          'sensor.power_1_1_14','sensor.power_1_1_13','sensor.power_1_1_12', 
          'sensor.power_1_1_11','sensor.power_1_1_10','sensor.power_1_1_9',
          'sensor.power_1_1_8','sensor.power_1_1_7','sensor.power_1_1_6', 
          'sensor.power_1_1_5','sensor.power_1_1_4','sensor.power_1_1_3', 
          'sensor.power_1_1_2','sensor.power_1_1_1'])
  |map(attribute='state')|select('is_number')
  |map('float')
  |select('<',outlier )
  |list
  |count > 0 }}

:wink: reduce the number of listened entities from 120 to 20ā€¦ seems too significant not to minimize that

well, that outlier does not work correctly ( or as expected, being a negative numberā€¦) I did play a bit with the factor but that seems not very scientific approach on my behalf.

returning to my earlier template (with an alert for any panel less than half of the mean value of all) I now made this binary:

  - binary_sensor:

      - unique_id: zonnepanelen_optimizers_alert
        state: >
          {% set mean =states('sensor.power_zonnepanelen_gemiddeld')|float(0) %}
          {% from 'optimizers.jinja' import opti_power %}
          {{expand(opti_power)
            |map(attribute='state')|select('is_number')
            |map('float')
            |select('<',mean/2 )
            |list
            |count > 0}}
        attributes:
          status: >
            {% set mean =states('sensor.power_zonnepanelen_gemiddeld')|float(0) %}
            {% from 'optimizers.jinja' import opti_power %}
            {% for o in expand(opti_power) if o.state|float < mean/2 %}
              {% if loop.first %} {{loop.length}} Optimizer met problemen: {% endif %}
                {{o.name}}: {{o.state}}
            {% else %} Alle optimizers ok
            {% endfor %}
        device_class: problem

where the import is just the list I posted earlier, so I can easily use that in more than 1 spot.

and I can use that binary for alert automations etc etc
might need to return to the outlier you proposed, but it needs more finetuning to be useful/correct

2 Likes

@Mariusthvdb
Iā€™m glad I found this thread.
I also have a problem with an inverter that no longer works, and your solution is exactly what I was looking for.
Thank you very much. :smiley:

1 Like

thanks, also to Stefan! And theFes for some
Templating nudges

meanwhile I changed to

- binary_sensor:

      - unique_id: zonnepanelen_optimizers_alert
        state: >
          {% set mean =states('sensor.power_zonnepanelen_gemiddeld')|float(0) %}
          {% set threshold = states('input_number.optimizer_threshold')|float(0) %}
          {% from 'optimizers.jinja' import opti_power %}
          {{opti_power
            |map('states')|select('is_number')|map('float')
            |select('<',mean/threshold )
            |list|count > 0}}
        attributes:
          issues: >
            {% set mean =states('sensor.power_zonnepanelen_gemiddeld')|float(0) %}
            {% set threshold = states('input_number.optimizer_threshold')|float(0) %}
            {% from 'optimizers.jinja' import opti_power %}
            {{opti_power
              |map('states')|select('is_number')|map('float')
              |select('<',mean/threshold)
              |list|count}}
          status: >
            {% set mean =states('sensor.power_zonnepanelen_gemiddeld')|float(0) %}
            {% set threshold = states('input_number.optimizer_threshold')|float(0) %}
            {% from 'optimizers.jinja' import opti_power %}
            {% for o in opti_power if states(o)|float < mean/threshold %}
              {% if loop.first %} {{loop.length}} Optimizer{{'s'
                   if loop.length !=1}} met problemen: {% endif %}
              Opti {{states[o].name.split('Power_')[1]}}: {{states(o)}} W{{', ' if not loop.last}}
              {% else %} Alle optimizers ok
            {% endfor %}
        device_class: problem

and the same in the dynamic variable in the button_card_template:

  variables:
    alert: >
      [[[ let gemiddeld = states['sensor.power_zonnepanelen_gemiddeld'].state;
          let threshold = states['input_number.optimizer_threshold'].state;
              return entity.state < parseFloat(gemiddeld/threshold); ]]]

I believe we still have to play bit with the mean/divider (somewhere between 2 and 3 is the sweetspot I believe), because depending on the day the numbers change of course and the calculation isnā€™t always as reliable.

still, the true outlier is found, and the binary alerts the system nicely.
Using the same mean/divider in the button-card template brings it all together, and the panels that are broken nicely bounceā€¦

1 Like

Very nice, I think this is worthy of its own topic :wink:

This thread really helped me set up what I wanted, but Iā€™m more focused on getting all the sensor information on my dashboard vs. setting up alerts. I iterated on your example code and came up with a template that merged in the voltage/current/lifetime data as well.

  pv_panel:
    aspect_ratio: 1.5
    show_icon: false
    show_state: true
    show_name: false
    show_label: true
    label: |
      [[[
        return entity.entity_id.replace(/^sensor\.power\_/, '').replace(/\_/g, '.')
      ]]]
    styles:
      grid:
        - grid-template-areas: >-
            "s s s" "lifetime lifetime lifetime" "current voltage
            optimizer_voltage"  "l l l"
        - grid-template-columns: 1fr 1fr 1fr
        - grid-template-rows: min-content min-content min-content min-content min-content
      label:
        - font-weight: bold
        - font-size: 12px
        - justify-self: center
        - align-self: end
        - color: black
      card:
        - border-radius: 5%
        - padding: '-10%'
        - background-image: |
            [[[ return  `url("/local/images/solaredge/panel.jpg")`; ]]]
        - background-size: cover
        - background-repeat: no-repeat
        - color: white
        - font-weight: bold
        - font-size: 24px
        - filter: |
            [[[
              return "brightness("+Math.min(100*(Math.round(Number(entity.state)) / 250 + 0.2), 100) + "%)"
            ]]]
      custom_fields:
        current:
          - font-size: 14px
          - padding: 5px
        voltage:
          - font-size: 14px
          - padding: 5px
        optimizer_voltage:
          - font-size: 14px
          - padding: 5px
        lifetime:
          - font-size: 14px
          - padding: 5px
    custom_fields:
      current: |
        [[[ 
          return `Current <br/> ${states[entity.entity_id.replace(/^sensor\.power\_/, 'sensor.current_')].state} A`]]]
      voltage: >
        [[[ return `Voltage <br/>
        ${states[entity.entity_id.replace(/^sensor\.power\_/,
        'sensor.voltage_')].state} V` ]]]
      optimizer_voltage: >
        [[[ return `Optimizer
        <br/>${states[entity.entity_id.replace(/^sensor\.power\_/,
        'sensor.optimizer_voltage_')].state} V` ]]]
      lifetime: >
        [[[ return `Lifetime <br/>
        ${states[entity.entity_id.replace(/^sensor\.power\_/,
        'sensor.lifetime_energy_')].state} kWh` ]]]

Iā€™m using it with a basic grid layout

      - square: false
        type: grid
        columns: 5
        cards:
          - entity: sensor.power_1_0_1
            type: custom:button-card
            template: pv_panel
          - entity: sensor.power_1_0_2
            type: custom:button-card
            template: pv_panel
          ...
        title: SolarEdge Power Optimizers

I know itā€™s a little weird to parse out the panel index from the entity ID and then use that to reference related entities, but it makes the template really easy to reuse.

1 Like

nice! Do you have an image of what that looks like?

Hello
As I am beginner in HA, can you tell me where you put this code (pv_panel: ā€¦) ?
Is is in the ui-lovelace.yaml file ?

Thanks

V.

Hereā€™s the background image I used:
panel
I cropped it out of a larger image I found on google image search, so hopefully itā€™s fair use.

For the whole setup, I

  • Installed button-card (GitHub - custom-cards/button-card: ā‡ļø Lovelace button-card for home assistant) via HACS
  • Uploaded the panel.png image into my homassisstant server at homeassistant/config/www/images/solaredge/panel.png
  • Used the ā€œRaw configuration editorā€ to edit the dashboard where I wanted to put this. I created a top-level button_card_templates element and pv_panel was nested directly underneath that.
  • Used the ADD CARD button to add a Grid Card and used the raw configuration editor to customize the card as I posted above.

Iā€™m running Home Assistant via docker on a NAS, so I donā€™t have dedicated hardware and I donā€™t have a ui-lovelace.yaml file to edit manually.

Hereā€™s my final product:

1 Like

Looks great. But I think that the text would be too small for a mobile view.

Iā€™m using the following auto-entities card that automatically shows all modules using multiple-entity-row card:

type: custom:auto-entities
card:
  type: entities
  title: solaredgeoptimizers
filter:
  template: >-
    {% for entity_id in integration_entities("solaredgeoptimizers") |
    select("match", "sensor.power.*") -%}
      {{
        {
          'type': 'custom:multiple-entity-row',
          'entity': entity_id,
          'name': state_attr(entity_id, 'friendly_name').replace('Power_', ''),
          'format': 'precision1',
          'entities':
            [
              {
                'entity': entity_id.replace('power', 'lifetime_energy'),
                'name': ' ',
                'format': 'precision1'
              },
              {
                'entity': entity_id.replace('power', 'voltage'),
                'name': ' ',
                'format': 'precision1'
              },
              {
                'entity': entity_id.replace('power', 'current'),
                'name': ' ',
                'format': 'precision1'
              }
            ],
        }
      }},
    {%- endfor %}

I found a more mobile-friendly way to do this by replacing the grid with layout-cards (GitHub - thomasloven/lovelace-layout-card: šŸ”¹ Get more control over the placement of lovelace cards.)

      - type: custom:layout-card
        layout_type: custom:masonry-layout
        layout:
          max_cols: 5
        cards:
          - entity: sensor.power_1_0_1
            type: custom:button-card
            template: pv_panel
          - ....
        title: SolarEdge Power Optimizers

1 Like

Any chance you could share a picture of what this looks like?

did you hard code all buttons there, or did you already find a way to combine the layout card with auto-entities , a bit like the card above with multiple-entity-row.

also, you could make that button-card template a lot more readable if you set the ā€˜idā€™ in a variable, and inject that in the other fields.

  variables:
    panel: >
      [[[ return entity.entity_id.replace(/^sensor\.power\_/, '').replace(/\_/g, '.'); ]]]
    id: >
      [[[ return entity.entity_id.split('power_')[1]; ]]]
  label: >
    [[[ return variables.panel; ]]]

or, since we now can use nested variables when they are declared in alphabetical order:

  variables:
    id: >
      [[[ return entity.entity_id.split('power_')[1]; ]]]
    panel: >
      [[[ return variables.id.replace(/\_/g, '.'); ]]]
  label: |
    [[[ return variables.panel; ]]]

and call them like:

  custom_fields:
    current: |
      [[[return `Current <br/> ${states['sensor.current_'+ variables.id].state} A`;]]]
    voltage: >
      [[[ return `Voltage <br/> ${states['sensor.voltage_'+ variables.id].state} V`; ]]]
    optimizer_voltage: >
      [[[ return `Optimizer <br/> ${states['sensor.optimizer_voltage_'+ variables.id].state} V`; ]]]
    lifetime: >
      [[[ return `Lifetime <br/> ${states['sensor.lifetime_energy_'+ variables.id].state} kWh`; ]]]

having 2 of these on mobile is the max though, so it might not be easy to make it resemble the actual plane layout

btw, I added a bit to that multiple-entity-row code to make it display with some niceties in the dashboard:

    - type: entities
      entities:
        - type: custom:auto-entities
          card:
            type: entities
            card_mod:
              class: class-header-margin
              style: |
                ha-card {
                  box-shadow: none;
                  margin: -16px;
                }
                .card-content {
                  max-height: 450px;
                  overflow-y: scroll;
                }
            title: SolarEdge optimizers
          filter:
            template: >-
              {% for entity_id in integration_entities("solaredgeoptimizers") |
              select("match", "sensor.power.*") -%}
                {{
                  {
                    'type': 'custom:multiple-entity-row',
                    'entity': entity_id,
                    'name': state_attr(entity_id, 'friendly_name').replace('Power_', ''),
                    'format': 'precision1',
                    'styles': {'width': '30px'},
                    'entities':
                      [
                        {
                          'entity': entity_id.replace('power', 'lifetime_energy'),
                          'name': ' ',
                          'format': 'precision1',
                          'styles': {'width': '50px'}
                        },
                        {
                          'entity': entity_id.replace('power', 'voltage'),
                          'name': ' ',
                          'format': 'precision1',
                          'styles': {'width': '30px'}
                        },
                        {
                          'entity': entity_id.replace('power', 'current'),
                          'name': ' ',
                          'format': 'precision1',
                          'styles': {'width': '30px'}
                        }
                      ],
                  }
                }},
              {%- endfor %}

its kind of basic, but friendly for mobile and allows for a direct, no whistle&bells overview. Might need to add some exception handling, not sure yet, they havent failed until now :wink:

Feb-28-2024 10-28-20

2 Likes