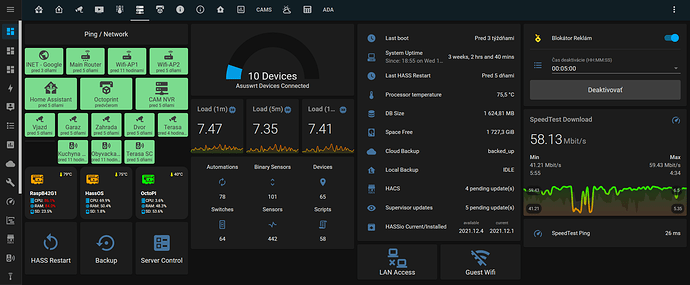
This is how mine is looking 
what do you use to get the CPU temp and load of a remote computer?
What are you using for the battery sensors there?
custom:button-card
Your AdGuard average processing speed seems pretty high. Mine is at 16ms. How come yours is so high? You’re also blocking a small amount of traffic perhaps not enough filter lists? I’m at 60% out of 418k queries.
Not sure it’s running on a i5-650, but it’s also my NAS, I might move it elsewhere.
Want to share your block lists? ![]()
I’m running it on a pi 4b 8gb. I was running it on an odroid n2 + but I moved it to the pi for the extra ram.
I have a ton of lists I tried to make sure they didn’t overlap. It blocks a ton. You will have to see what it breaks and figure out what it broke and unblock the specific queries you think will fix it without unblocking everything just to fix it unless you have to or don’t want to spend the time unblocking. I’ll DM you my yaml to avoid more off topic discussion lol.
For Windows im using the Open Hardware Monitor integration:
For Linux im using Glances:
https://nicolargo.github.io/glances/
How are you getting the buttons side-by-side?
Mind sharing a snippet of card code? 
with grid card
type: grid
cards:
  - type: custom:button-card
    entity: sensor.ble_battery_a4c13898aecb
    name: Wohnzimmer
    show_icon: true
    show_label: false
    show_name: true
    show_state: true
    styles:
      icon:
        - color: var(--card-background-color)
      label:
        - justify-self: start
        - align-self: start
        - font-weight: bold
        - font-size: 12px
        - filter: opacity(40%)
        - margin-left: 12px
        - color: ''
      name:
        - align-self: end
        - justify-self: start
        - font-weight: bold
        - font-size: 15px
        - margin-left: 12px
        - color: var(--secondary-text-color)
      state:
        - justify-self: start
        - align-self: start
        - font-weight: bold
        - font-size: 12px
        - filter: opacity(40%)
        - margin-left: 12px
      img_cell:
        - background-color: |
            [[[
              if (entity.state >= 60) return 'rgba(77, 163, 100, 0.5)';
              if (entity.state >= 40) return 'rgba(255, 199, 0, 0.5)';
              if (entity.state >= 20) return 'rgba(255, 130, 0, 0.5)';
              else return 'gba(255, 0, 0, 0.5)';
            ]]]
        - border-radius: 50%
        - place-self: center
        - width: 30px
        - height: 30px
      grid:
        - grid-template-areas: '"i n" "i s" "i l"'
        - grid-template-columns: min-content auto
        - grid-template-rows: min-content min-content
      card:
        - border-radius: 15px
        - box-shadow: null
        - padding: 10px
    size: 60%
  - type: custom:button-card
  - type: custom:button-card
  - type: custom:button-card
  - type: custom:button-card
  - type: custom:button-card
  - type: custom:button-card
  - type: custom:button-card
square: false
columns: 2
Thanks a bunch!
Nice. I have stolen a lot of your ideas there!  One question is what graph card are you using for the FritzBox. I am looking for exactly what you have there with the x axis labels.
I’m happy when I can inspire other people.
type: custom:apexcharts-card
show:
  loading: false
graph_span: 24h
header:
  title: Dowload / Upload
  show: false
  show_states: false
  colorize_states: true
apex_config:
  tooltip:
    enabled: true
    followCursor: true
  grid:
    show: false
  chart:
    height: 130
  yaxis:
    show: false
    labels:
      style:
        fontSize: 11px
        colors: gray
  xaxis:
    labels:
      style:
        fontSize: 11px
        colors: gray
    axisBorder:
      show: false
  legend:
    show: true
    fontSize: 11px
    labels:
      colors: grey
all_series_config:
  stroke_width: 1.5
  opacity: 0.2
  type: area
  group_by:
    func: avg
    duration: 60min
  show:
    extremas: true
color_list:
  - '#bf5e5e'
  - '#3b6ba1'
series:
  - entity: sensor.fritz_box_7490_ui_gb_received
    name: Download
  - entity: sensor.fritz_box_7490_ui_gb_sent
    name: Upload
This is my Lovelace System Monitoring, It has based me on many ideas in this thread, although I really started with the NUC and took the ideas of these 2 colleagues:
Liam: Nuc System Monitoring Card - #12 by liamstears
Hs82H: Nuc System Monitoring Card - #28 by Hs82H
In order to create these cards, I had to use several methods to obtain sensor, a long and rewarding task.
Next step is InfluxDB + Grafana
Greetings
This is mine, very simple and just monitoring the essentials, and optimized for mobile.

How do you get the pages to swipe like that?
That looks really tidy. Would you mind sharing the config?


