Enphase Envoy with Energy Dashboard

Update 21/July/2023 - I have started a new topic that uses a fully manual solution I came up with using just the rest sensor for Enphase Envoy on D7 firmware.
It’s a lengthy guide with lots of explanation.
Hopefully it helps someone else out.

Original guide from August 2021 - I am setting up a new topic here as Energy Management in Home Assistant is getting pretty crowded and hard to follow with over 380 posts.

Ok, so, all of this recent activity started when when Home Assistant 2021.8 launched with a new Energy feature.

My Enphase Envoy was not doing what I expected it to do in Home Assistant so I read some other posts and this is what I came up with to get it working.

I wont go into detail about why it didnt work, but rather concentrate on what i did to get it working.

As a pre-requisite, please make sure your envoy is a metered version.
This can be confirmed multiple ways.
Within home assistant, go to developer tools / states and search the page for _current

If you see these entries (they dont have to be identical), and they have numbers in the state column in the middle, then you have a metered enphase envoy. Production might be 0 or close to 0 at night. That is fine and expected. Also, the unit_of_measurement should be W and state_class should be measurement in the right column.

Please pay very close attention to the sensor name and note if it says energy or power in the name as some older integrations incorrectly say energy and new integrations correctly say power in the sensor name. Don’t panic if yours says energy in the name, it wont break functionality. Its just confusing naming a sensor with the word energy which is meant to be only used for numbers in kWh.

Now we can start creating the power sensors.

I added the following 2 power sensors to my configuration.yaml file

Please make sure to include these lines for these 2 power sensors as they are not optional and failure to include them will mean this wont work. see Sensor Entity | Home Assistant Developer Docs

state class: measurement - The state represents a measurement in present time
device class: power is applied to the latest power measurement expressed in W for Watts

template:
  - sensor:
        name: Grid Import Power
        state_class: measurement
        icon: mdi:transmission-tower
        unit_of_measurement: W
        device_class: power
        state: >
            {{ [0, states('sensor.envoy_SERIALNUMBER_current_power_consumption') | int(0) - states('sensor.envoy_SERIALNUMBER_current_power_production') | int(0) ] | max }}
  - sensor:
        name: Grid Export Power
        state_class: measurement
        icon: mdi:transmission-tower
        unit_of_measurement: W
        device_class: power
        state: >
            {{ [0, states('sensor.envoy_SERIALNUMBER_current_power_production') | int(0) - states('sensor.envoy_SERIALNUMBER_current_power_consumption') | int(0) ] | max }}

What do these sensors do?
This allows us to separate incoming grid power and outgoing grid power into 2 seperate numbers which is what the energy dashboard needs.
These sensors only record positive numbers and ignore any negative numbers generated by the formula.
Without this part, you will see negative numbers in your energy dashboard and you definetly dont want that messing things up.

Next, I then added 2 non-template sensors to the configuration.yaml file. Please make sure these energy sensors are placed lower in the config than the template block which has the power sensors

sensor:
  - platform: integration
    name: Grid Import Energy
    source: sensor.grid_import_power
    unit_prefix: k
    unit_time: h
    method: left
    
  - platform: integration
    name: Grid Export Energy
    source: sensor.grid_export_power
    unit_prefix: k
    unit_time: h
    method: left

These energy sensors do not need any other options as they will format themselves based on positive data from the power sensors. These lines allow the ‘integration’ integration to convert power in W to energy in kWh. See Integration - Riemann sum integral - Home Assistant

What do these do?
These take the live Power readings in W from the first 2 sensors we created and converts them to an Energy reading over time in kWh.

That should be the bare minimum you need to get you started with the energy dashboard.

NOTE: ENERGY DASHBOARD WILL TAKE 1.2 HOURS (1h12m) TO RECORD AND DISPLAY THE LAST HOUR OF DATA.

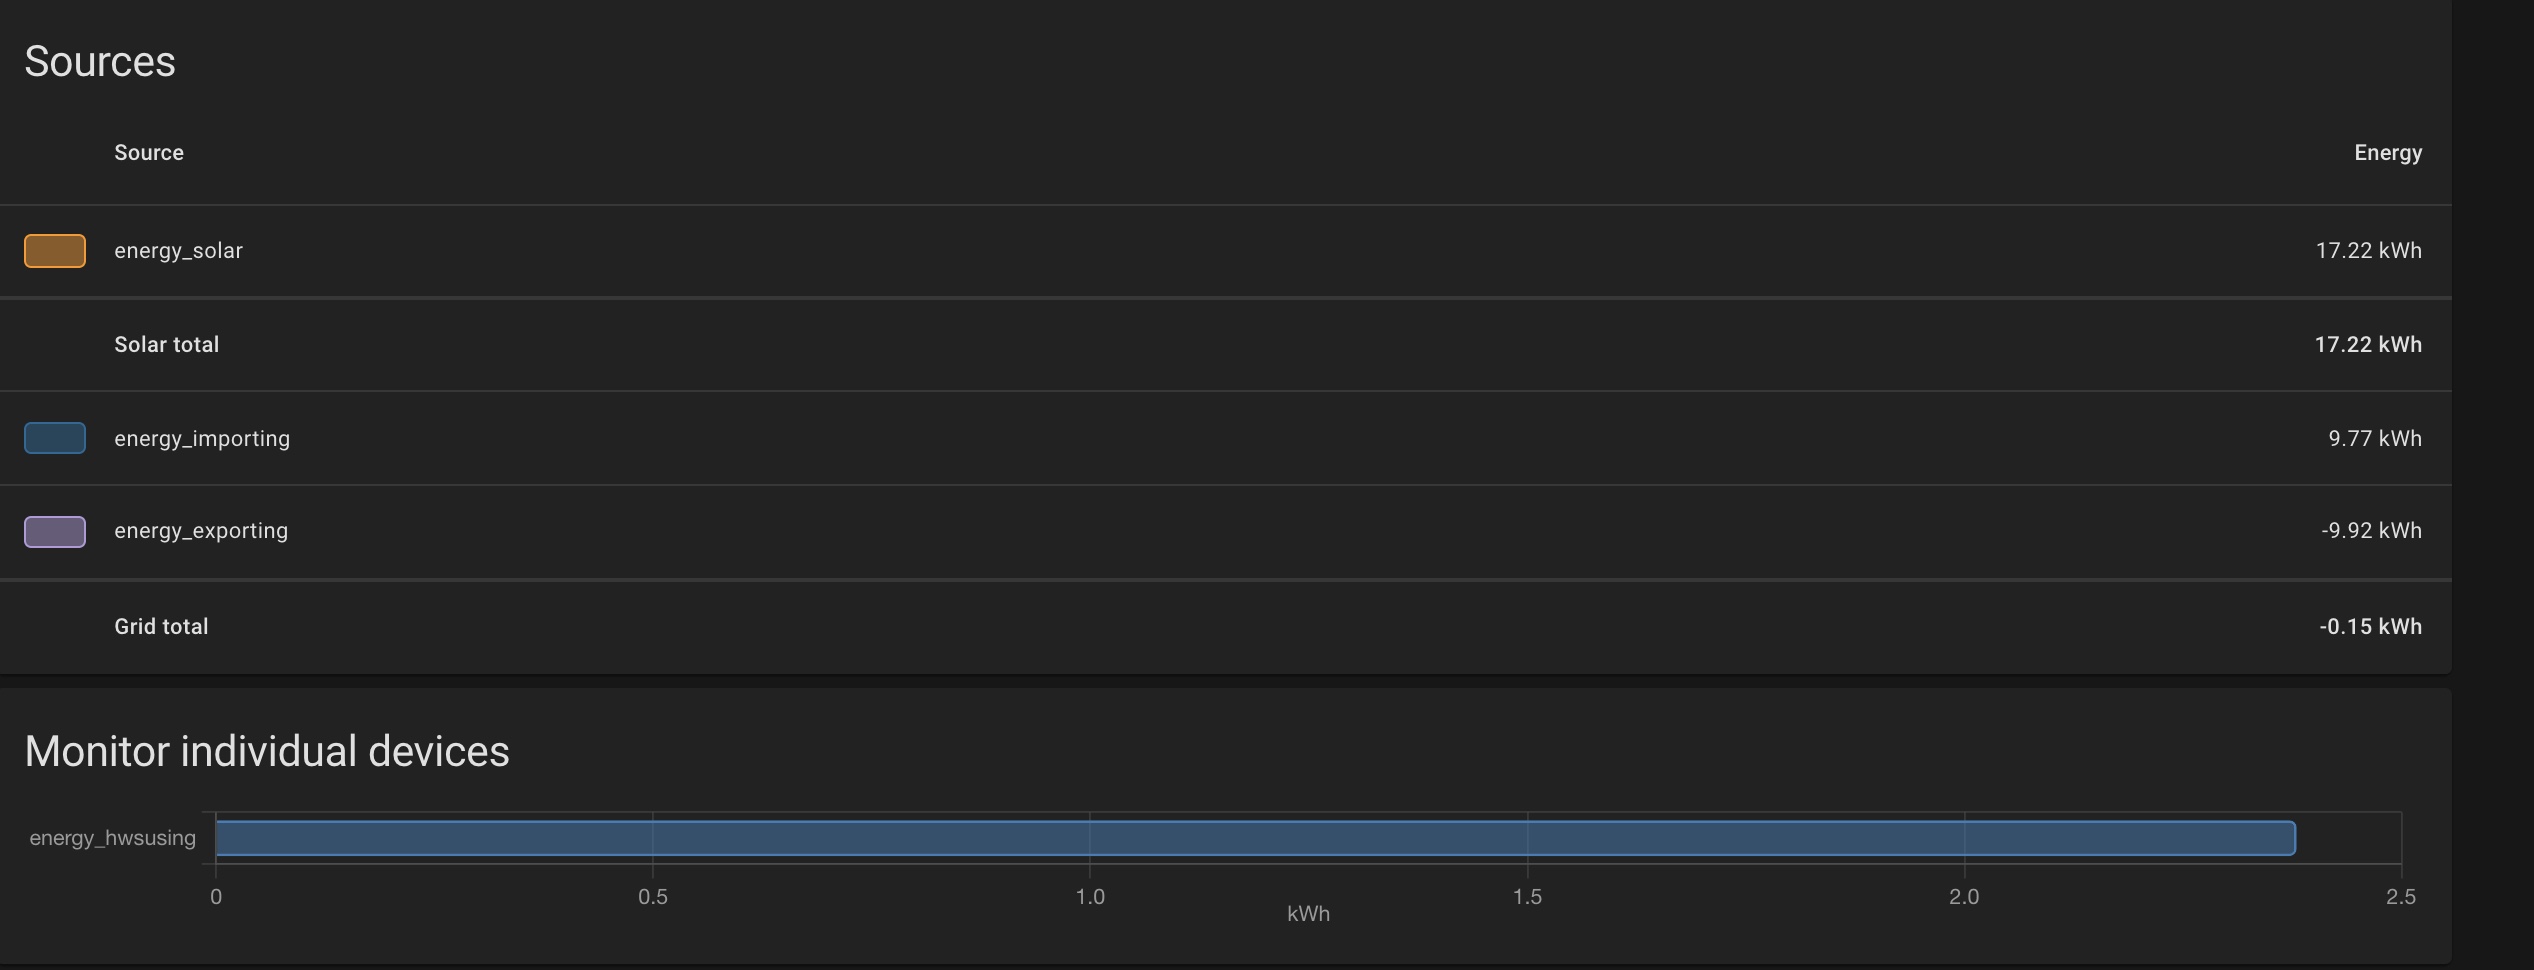
This is what you will see in your sensors after restarting Home Assistant

image
image
image
image

Don’t freak out if its night time and your production doesnt show kWh yet, as you will only importing at this very moment. Once the direction of power/energy changes from import to export or vice versa, the energy sensor formatting should fix itself once the power figure no longer equals 0

It is good idea to click on each of these sensors to confirm that recording is working and the graph is charting. Pay particular attention to the energy sensors. Energy sensors should only ever increase.

image image
image image

This should be the bare minimum you need to do to use the ‘grid consumption’ and ‘return to grid’ features in the energy dashboard.

image

For ‘Solar Production’, the today_s_ENERGY_production sensor is the ONLY enphase sensor that will work with energy dashboard by default without modifying home assistant and creating extra power and energy sensors. This is due to the state_class: total_increasing attribute that ONLY this sensor appears to have. This is fine as this is the only Enphase sensor that needs this attribute.

image

NOTE: ENERGY DASHBOARD WILL TAKE 1.2 HOURS (1h12m) TO RECORD AND DISPLAY THE LAST HOUR OF DATA.

29 Likes

Yes, this is what I’ve been doing with the envoy sensors since the beta.

One change you might want to make is to the two Integration sensors. If you add method: left (like below) you should get a more accurate measurement. That’s because energy generation/use is ‘spiky’ and not some linear change.

 - platform: integration
   name: Grid Export Energy
   source: sensor.grid_export_power
   unit_prefix: k
   unit_time: h
   method: left
4 Likes

This step is optional and may not apply to you
If your overnight production is usually 0, You can skip this step and use sensor.envoy_SERIALNUMBER_lifetime_energy_production for solar production

image

the production lifetime sensor is the ONLY enphase sensor that work with energy dashboard by default as this number only increases in value and will never reduce in value much like a car odometer

The next thing i wanted to address and fix was the overnight production that seems to be common with Enphase Envoy.

In my case, i was seeing a steady 4W of production even when the sun was down which just defies logic.

image

This is the explanation given at https://community.enphase.com/s/question/0D52G00004Z9tYC/why-does-the-array-production-still-show-power-produced-on-each-panel-at-night-time-the-energy-tab-seems-to-work-ok

Naturally your system is not producing at night. The appearance of night time production is a result of what we call backfill. When the Envoy and the microinverters cannot talk for extended periods of time the microinverters try to hold a basic record of “I produced x much power from x date to x date”. When they can finally talk it tells the Envoy this and the system averages it over that period of time. This gives the appearance of production during the night but it is not really producing during the night. Without the communication between microinverter and Envoy you lose all the data that is collected in real time with things like temperature, AC voltage, DC voltage, and a host of other data including the proper production numbers for each interval.

Here is what I did to fix it in my configuration.yaml file.

  - sensor:
        name: Solar Power Corrected
        state_class: measurement
        icon: mdi:solar-panel
        unit_of_measurement: W
        device_class: power
        state: >
            {% set value = states('sensor.envoy_SERIALNUMBER_current_power_production') | int %}
            {% if value  <= 4 -%}
              0
            {% elif is_state('sun.sun','below_horizon') %}
              0
            {%- else -%}
              {{ value }}
            {%- endif %}

What does this do?
This replaces any values less than or equal to 4 with a 0 which I am fine with.

The next thing I had to do to get the engery dashboard to be able to select this is add the following non-template sensor.

  - platform: integration
    name: Solar Energy Corrected
    source: sensor.solar_power_corrected
    unit_prefix: k
    unit_time: h
    method: left

What does this do?
It takes the live immediate Power figure and converts it to an Energy over time figure so that the energy dashboard can use it.

Here is a screenshot showing all 3 Energy sensors I created in use.

image

5 Likes

The next thing I wanted to do was get costs to be calculated.

First thing I did was change the currency to my local currency in Configuration / General / Currency.
If you dont do this, it will show in EUR by default.

I found out about an integration called Utility Meter - Home Assistant

I set that up by adding the following in my configuration.yaml

utility_meter:
  daily_energy:
    source: sensor.grid_import_energy
    name: Daily Import Meter
    cycle: daily
    tariffs:
      - offpeak
      - shoulder
      - peak
  daily_energy_export:
    source: sensor.grid_export_energy
    name: Daily Export Meter
    cycle: daily
    tariffs:
      - buyback

This sets up the the following sensors/meters

image

Where I live, I have 3 tarrifs and a daily supply charge.

image

Then a 25% discount is applied to all 3 tariffs as well as the daily supply charge.

image

I then setup a new template sensor to calculate the correct 3 tariff prices inclusive of my 25% discount:

template:
  - sensor:
      - name: Tariff Price
        unit_of_measurement: AUD
        state: >
            {% if is_state('utility_meter.daily_energy', 'peak') %}
                {{ 0.541145 * 0.75 }}
            {% elif is_state('utility_meter.daily_energy', 'shoulder') %}
                {{ 0.277145 * 0.75 }}
            {% else %}
                {{ 0.177045 * 0.75 }}
            {% endif %}

My energy retailer has the following complicated tariff schedule.

Weekdays
Shoulder = Weekdays 7am to 5pm
Peak = Weekdays 5pm to 9pm
Shoulder = Weekdays 9pm to 10pm
Off-peak = Weekdays 10pm to 7am

Weekends
Shoulder = Weekends 7am to 10pm
Off-peak = Weekends 10pm to 7am

I then had to setup the following automations to automatically switch the tarrif at the correct time of day/week in automations.yaml.

  alias: Tariff Shoulder
  trigger:
  - platform: time
    at: 07:00:00
  action:
  - service: utility_meter.select_tariff
    data:
      tariff: shoulder
    target:
      entity_id:
      - utility_meter.daily_energy

  alias: Tariff Peak Weekday
  trigger:
  - platform: time
    at: '17:00:00'
  condition:
  - condition: time
    weekday:
    - mon
    - tue
    - wed
    - thu
    - fri
  action:
  - service: utility_meter.select_tariff
    data:
      tariff: peak
    target:
      entity_id:
      - utility_meter.daily_energy

  alias: Tariff shoulder Weekday
  trigger:
  - platform: time
    at: '21:00:00'
  condition:
  - condition: time
    weekday:
    - mon
    - tue
    - wed
    - thu
    - fri
  action:
  - service: utility_meter.select_tariff
    data:
      tariff: shoulder
    target:
      entity_id:
      - utility_meter.daily_energy

  alias: Tariff Offpeak
  trigger:
  - platform: time
    at: '22:00:00'
  action:
  - service: utility_meter.select_tariff
    data:
      tariff: offpeak
    target:
      entity_id:
      - utility_meter.daily_energy

The key takeaway from these automations is that I am calling the service named utility_meter.select_tariff and telling that service to change the tariff to shoulder for example.

This sensor shows what the current tarrif is set to

image

The end result is this sensor

image

We can then tell the energy dashboard to use this sensor for the current price.

As the export price never changes, I have decided to use a static rate in the Energy Dashboard

Which will then allow energy dashboard to calculate costs like this

It will also split up your usage into tariffs like this

image

This is all that was needed for Energy Dashboard to calculate costs.

The rest below is extra information I was interested in calculating and charting.

I next created the following sensors to show the real cost per day inclusive of export credit, daily service charge and discount.

  - sensor:
      - name: Today Energy Total Cost
        device_class: monetary
        state_class: measurement
        unit_of_measurement: AUD
        state: >
          {{ (states('sensor.daily_energy_peak') | float * (0.541145 * 0.75) +
              states('sensor.daily_energy_shoulder') | float * (0.277145 * 0.75) +
              states('sensor.daily_energy_offpeak') | float * (0.177045 * 0.75) +
              states('sensor.daily_energy_export_buyback') | float * -0.095 +
              (1.0439 * 0.75)) | round(2) }}
  - sensor:
      - name: Yesterday Energy Total Cost
        device_class: monetary
        unit_of_measurement: AUD
        state: >
          {{ (state_attr('sensor.daily_energy_peak','last_period') | float * (0.541145 * 0.75) +
              state_attr('sensor.daily_energy_shoulder','last_period') | float * (0.277145 * 0.75) +
              state_attr('sensor.daily_energy_offpeak','last_period') | float * (0.177045 * 0.75) +
              state_attr('sensor.daily_energy_export_buyback','last_period') | float * -0.095 +
              (1.0439 * 0.75)) | round(2) }}

This is my result

image

Click on the sensor and see when the cost changes

image

I then took it one step further and added another sensor to calculate and estimate cost right now based on the most recent grid power consumption.

  - sensor:
        name: Instant Cost Per Hour
        state_class: measurement
        unit_of_measurement: AUD
        device_class: monetary
        state: >
            {% set hourly = (1.0439 * 0.75) / 24 %}
            {% set gridout = states('sensor.grid_export_power') | int %}
            {% set gridin = states('sensor.grid_import_power') | int %}
            {% if gridout > 0 %}
              {{ ((gridout/1000) * -0.095 | float + hourly) | round(2) }}
            {% else %}
              {{ ((gridin/1000) * states('sensor.tariff_price') | float + hourly) | round(2) }}
            {% endif %}

which gives me this sensor which includes my daily service charge and negative means im making credit rather than being charged.
This sensor is just an estimate for ‘at a glance’ POWER consumption and is not as accurate as ENERGY.

image

I have done some further development with the costs calculations.
See this link for more if you’re interested. Using Home Assistant to calculate my energy bill using data from my Solar Inverter

7 Likes

Amazing, thanks for sharing! I have an Envoy and you have saved me having to work it out myself :slight_smile:

2 Likes

Here is currently what almost a whole day of data looks like for Enphase Envoy using the sensors I have created in the posts above.

4 Likes

I use an alternate method that’s a little more accurate:

 - sensor:
        name: Solar Power Corrected
        state_class: measurement
        icon: mdi:solar-panel
        unit_of_measurement: W
        device_class: power
        state: >
            {% set value = states('sensor.envoy_SERIALNUMBER_current_energy_production') | int %}
            {% if is_state("sun.sun", "below_horizon")%}0{%else%}{{ value}}{%endif%}
            
4 Likes

Oh yes, this is good. Thanks.

1 Like

Cheers for this. I will apply the left method and see what I get.

Here is what i found about different sums from Riemann sums review (article) | Khan Academy

Trapezoidal
image

Left
image

I must admit, your posts are the ones that helped me the most with this issue.
You deserve most of the credit here.

1 Like

It’s interesting that I don’t have any phantom solar generation reported at night, I might have a different model or set up going on here with the envoy

I have an envoy S, and 15 x IQ7A micros it also monitors the solar production from anther old solar system.

1 Like

Could be something silly like crosstalk with other AC power cables.
My Microinverters are IQ7A-72-2-INT and My Envoy is ENV-S-WM-230.
Here is what my http://envoy.local/home looks like

image

1 Like

Please forgive my newby ignorance - I don’t have a sensor called sensor.envoy_SERIALNUMBER_current_energy_prodcution - I have one called sensor.envoy_current_energy_prodcution

Should I use that instead or am I doing this wrong?

FYI - I also have a Pulse counting device called a Flukso and have managed to get it working using that, however I’d like to also use the Enphase Envoy directly in case the Flukso dies.


You may either have an older or newer Enphase integration than what I have.

To see what envoy sensors are in your system, go into Developer Tools.

image

and type in sensor.envoy and see what the list shows.

Mine will look different because I have added some lines to customize.yaml to make them easier to read.

sensor.envoy_SERIALNUMBER_current_energy_consumption:
  friendly_name: Consumption Now
sensor.envoy_SERIALNUMBER_current_energy_production:
  friendly_name: Production Now

After removing the integration and re-adding it, i noticed it has now correctly renamed these 2 sensors as power (instead of energy) which is what these should have been named as in the first place.

sensor.envoy_SERIALNUMBER_current_power_consumption:
sensor.envoy_SERIALNUMBER_current_power_production:

… So my now updated code should be: (pretty much did a find/replace on current_energy and replaced with current_power)

template:
  - sensor:
        name: Grid Import Power
        state_class: measurement
        icon: mdi:transmission-tower
        unit_of_measurement: W
        device_class: power
        state: >
            {{ [0, states('sensor.envoy_SERIALNUMBER_current_power_consumption') | int - states('sensor.envoy_SERIALNUMBER_current_power_production') | int ] | max }}

  - sensor:
        name: Grid Export Power
        state_class: measurement
        icon: mdi:transmission-tower
        unit_of_measurement: W
        device_class: power
        state: >
            {{ [0, states('sensor.envoy_SERIALNUMBER_current_power_production') | int - states('sensor.envoy_SERIALNUMBER_current_power_consumption') | int ] | max }}

  - sensor:
        name: Solar Power Corrected
        state_class: measurement
        icon: mdi:solar-panel
        unit_of_measurement: W
        device_class: power
        state: >
            {% set value = states('sensor.envoy_SERIALNUMBER_current_power_production') | int %}
            {% if value  <= 4 -%} 
              0
            {%- else -%}
              {{ value }}
            {%- endif %}

Dont stress if you dont see a serial number. It might just be a subtle difference between our systems.

1 Like

I’m thinking my old solar system that envoy also monitors keeps enough vampire load from its inverter to keep it a negative figure at night so maybe that’s why it’s not showing any solar at night for me

Yes my system must be different to yours - I only have a single Consumption and Production Sensor - the only thing with serial numbers are the 18 inverters. Mine also shows negative numbers being produced at night hence why I use the sun.sun if statement to zero out at night.

Do you have access to the installer menu which allows you access to many hidden menus etc?

Username is installer and you’ll need to run a Python script program once with your Envoy serial number to get the password. Heres a link to the script GitHub - sarnau/EnphaseEnergy: Various collected information about Enphase Energy solar system

3 Likes

Ah, I do not have the installer password.

As per this link Enphase Envoy - Home Assistant … it appears I didnt need it.

All I did to set this up was

image

image

image

Once that was done, I ended up with this

image

I have 22 microinverters and 4 values for production and 4 for consumption.
Here is what 1 lot of 4 values are.

image

I knew it existed but have been resisting the urge to log in and look around in there, my installer is a great guy and I have my reasons for not wanting to poke around in there if I don’t need to.

1 Like

You can see per panel generation, plus real-time generation/consumption.

I haven’t (yet) worked out how to use this real-time info via the installer menus, however I use pulse counters using a device called a Flukso and display real-time usage/generation via mqtt and a few Homeassistant cards:

I am currently using real-time figures based on the sensors I mentioned

They will with either be called
(new version integration)
sensor.envoy_SERIALNUMBER_current_power_consumption:
sensor.envoy_SERIALNUMBER_current_power_production:
OR
(old version integration)
sensor.envoy_SERIALNUMBER_current_energy_consumption:
sensor.envoy_SERIALNUMBER_current_energy_production:

I noticed they updated this file in late July which is when the names changed
https://github.com/home-assistant/core/pull/53653/commits/2e7602a66eb3929ebc44aad157899ffc0d3be4b4

How frequently do the real-time values change for you? If I use sensor.envoy_current_energy_consumption: mine update about once a minute.

My pulse counters update 1,000 times a minute.

Thanks for the link - I’ll reload Ephase integration in the morning and will try again