How to fix statistics data (e.g. energy data)

Hey I have managed (I think) to solve the issue which was bothering me for a long time and I have decided to share the solution with you guys. I hope that someone finds it helpful.

Problem

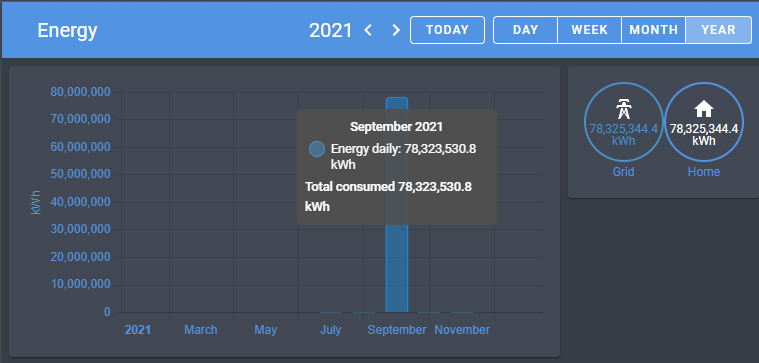
I have OWL energy sensor which sends the data via RF433. The problem is that sometimes the received values are not correct. Pretty often I get “0” as the energy_total and once the value jumped significantly by 78M.

I don’t have the sensor data to investigate what has happened that day and what were the actual sensor values. The sensor data which I show below is the data from utility_meter.

image

Solutiuon

Skip known invalid values (e.g. “0”)

This solution can be applied for any value which can be quickly recognized as invalid like 0 for energy or more than 400 for outside temperature.

My entity for energy total sensor is called sensor.owl_energy_total and to filtering out 0 states I have created another sensor (template one) with very simple condition:

sensor:
  - platform: template
    sensors:
      energy_total:
        friendly_name: "Energy total"
        device_class: energy
        unit_of_measurement: kWh
        value_template: >
          {% if states('sensor.owl_energy_total') | float == 0 %}
           {{ states('sensor.energy_total') }}
          {% else %}
           {{ states('sensor.owl_energy_total') | float | multiply(0.001) | round(1) }}
          {% endif %}

This way you can be sure that sensor.energy_total entity will always have values not equal 0.

Fix invalid statistics data

Please create a backup/snapshot before proceeding with below steps.

You will need some database explorer/viewer tool. Which you will choose depends on the DB you use in you HA. Since SQLite is the default one I will use the “SQLite Web” add-on.

  1. Check when exactly the issue happened.
    I think that the best way to check the day is to go to Energy tab, switch to mothly view and go to prev months (if there is a need).
    image

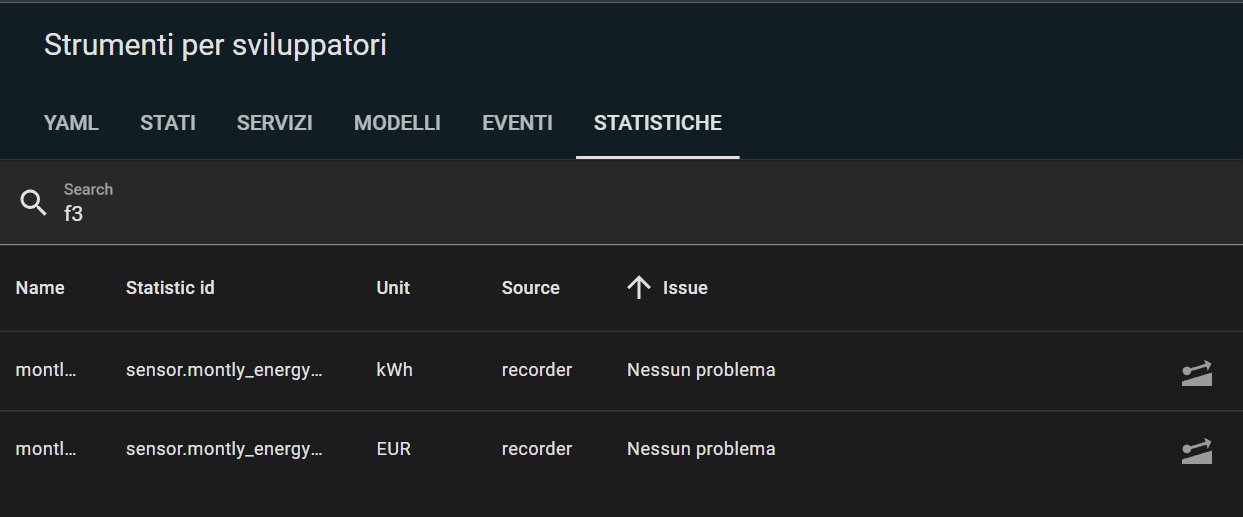
  2. Go to the DB explorer and check the entity metadata_id. You can find it in statistics_meta table.
    image

  3. Get the exact IDs for table entries.
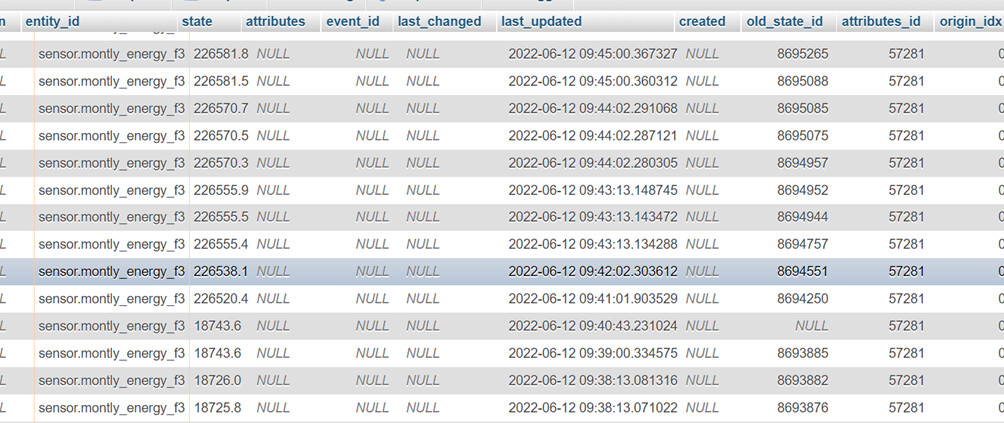
    Switch to “Query” tab and type similar query (you need to update the ID and dates). Sample result at the beginning of this post.

    select id, created, state, sum  from statistics
    where
      metadata_id == 10
      and created between '2021-09-04' and '2021-09-05'
    
  4. Fix the state values
    Here we have the tricky part. First I was hoping that updating the state column values will be enough but it turned out it isn’t. Pasting here an example query to update these values anyway.

    We assume here that the first invalid value was’t affecting the state so it will be the same as the prev row.

    image

    update statistics set state = round(state - 78323324.8, 1)
    where 
      metadata_id == 10
      and id between 17667 and 17891;
    
  5. Fixing sum values
    Initially I have decided to change the values starting from the point where the issue happened onwards - in more or less the same way how I have fixed state values above. So I have tried to reduce the values in all records after 17653 (2021-09-04 06:12:01). But then it turned out that my most recent readings (last day) has this enormous spike.

    I have tried to find the current entity state value somewhere in the .storage dir but I couldn’t find it and I didn’t bother to look at the utility_meter code to check where does it keep its state.

    The other solution was to update the previous states (the ones <= 17653) and this worked perfectly.

    78323328.5 - 592.4 = 78323324.8

    update statistics set sum = sum + 78323324.8
    where 
      metadata_id == 10
      and id <= 17653;
    

Note:
I recommend to experiment on external DB before applying any DB changes in your HA. Here you have saved SQL fillde which you can use: DB Fiddle - SQL Database Playground.

Here is a simple SQL for adding table with sample data (in case above link stops working)

CREATE TABLE statistics  (
  id INTEGER NOT NULL,
  created DATETIME,
  metadata_id INTEGER,
  start DATETIME,
  mean FLOAT,
  min FLOAT,
  max FLOAT,
  last_reset DATETIME,
  state FLOAT,
  sum FLOAT,
  PRIMARY KEY (id)
);

INSERT INTO `statistics` (`id`,`created`,`metadata_id`,`start`,`mean`,`min`,`max`,`last_reset`,`state`,`sum`)
VALUES
  (17233,"2021-09-03 00:12:01.562213",10,"2021-09-02 23:00:00",null,null,null,"2021-09-02 23:00:00.010124",0.5,577.9999999999978),
  (17247,"2021-09-03 01:12:01.484162",10,"2021-09-03 00:00:00",null,null,null,"2021-09-02 23:00:00.010124",0.7,578.1999999999979);

I have created as well a simple JS script for converting exported JSON data from “SQLite Web” to SQL INSERT statement. Script available here, you just need to paster the JSON there.

Related problems mentioned on the forum

24 Likes

Hey,
thank you for this solution. It worked like a charm.

In my case, state is an always increasing meter, so i had to fix it in a little different way.
It is not necessary to fix anything in the state column at all.
To fix the sum-value, the calculation is a bit different:
321072.3 - 8026.8 - (313044.8 - 313038.7) = 313039.4

Query:

update statistics set sum = sum + 313039.4
where 
  metadata_id == 10
  and id <= 17441;

4 Likes

Yeah such calculation in your case make sense as the state column seems to be correct through all the rows so you can calculate exactly the diff between first broken row and the last correct one. That wasnt the case for me so I have said that I just assume that there was no diff between the two rows.

I’m glad that the solution was useful. I hope that at some point we will have the UI for fixing that kind of stuff (although it can be hard to do). Long time ago I was using Domoticz where you able to remove the individual readings from the sensor. Here you need to fix all of the previous/following values, so it can be tricky.

I wonder how common are such problems. The part which really sucks is that when such issue occurs then your data for longer periods stays broken forever.

1 Like

Great post thanks, similar to merlinb I only had to fix the sum value.

I did this differently by subtracting a calculated offset instead of adding one, and all the daily trends looked good again, or so I thought. However as soon as the Energy graphs updated at the next hour there was this large jump in the sum value again for the last timestamp.

I suppose I could have added an offset to all the other values, but then I would have had a large difference for the first timestamp. Is there a way to stop this jump in values from happening?

This is exactly what I was trying to say here (I will rephrase/update it as it’s not clear):

If you go your way you need somehow to edit the current state of entity kept somewhere. I think that most of the current states you can find in this file:
image

It is a JSON file containing the array of states in the following format:
image

But as I have mentioned I use utility_meter entity (which then I use as Energy input/source). I think utility_meter keeps the internal state somewhere else (I might be wrong), at least I was not able to find it there. TBH I haven’t tried to stop the HA and edit this file.

I suggest to follow my way of solving this problem. I know that the big values don’t look very nice (that is why I have tried initially the other way) but at least it works.

Hi, is the code correct? does not count me after adding this code. You haven’t made any changes?

@nemezis336 The listing which I gave comes exactly from my configuration so I can confirm it works

Of course you need to change all the entity names in it.

The logic is pretty simple. If the owl_energy_total value is 0 then return energy_total (it’s own, same/unchanged) value, if not then provide the new value from owl_energy_total. Please note that I multiply there by 0.001 to convert Wh to kWh and at the end I round the output.

It was my mistake, I already have kW. So far it looks good.
obraz

I have tried to find the current entity state value somewhere in the .storage dir but I couldn’t find it and I didn’t bother to look at the utility_meter code to check where does it keep its state.

I just want to point out that for utility_meter simple SERVICE UTILITY_METER.CALIBRATE does the trick without the need to modify the database.

1 Like

SERVICE UTILITY_METER.CALIBRATE
How can this work? Could you show an example please?

@maxwroc Thank you so much for your post; it helped me a lot!

1 Like

Is ther maybe a simplier solution to fix those spikes?

Dear all.
I’m facing a similar situation with wrong values in energy dashboard.
I had some problems due to current drops, resulting in a corrupted DB. I fix some way, and everything looks good now, except the very first data on Dec. 2nd 2021, where there is a spike I’m not able to detect within the DB.

Could you please help me figuring out how to solve my problem?
Thanks in advance

Simone


Sorry for having disturbed you.
Looks like I had some balance data from a previous DB: ordering them by “start” column did the trick and I found the actual problem.

Sorry !

I’ve written a query which will work if you have MariaDB backend. I’ve set a cron to execute it daily through mysql cli client (because I was lazy to create a proper script with an automation).

Remember to replace solaredge to your sensor (entity_id) if you’re changing to different provider.

update statistics
  join (
    select * from (
      select bug.id, fix.state, fix.sum, 
        row_number()  over (partition by bug.id order by fix.start desc) as rn 
      from statistics as fix
        join (
          select b.id, b.state, b.sum, b.start, b.metadata_id from statistics as b
          where b.state=0
        ) as bug
        on fix.start < bug.start and fix.metadata_id = bug.metadata_id
      where 
        fix.state != 0 
        and fix.metadata_id = (
          select id from statistics_meta 
          where statistic_id = 'sensor.solaredge_lifetime_energy'
        )
    ) as fix_rows 
    where fix_rows.rn = 1
  ) as fixes 
  on statistics.id = fixes.id
set 
  statistics.state = fixes.state,
  statistics.sum = fixes.sum
;

It copies last valid row to the one which data has been missed

1 Like

This can be also fixed using build in HA mechanism How to fix Energy Dashboard data (statistic data) · macxq/foxess-ha Wiki · GitHub . Of course when amount of discrepancies is low :wink:

3 Likes

Hello all, since goggling around for this issue show a lot of results about SQL query, I want to share my experience hoping to make some people happy :slight_smile: and avoid messing data around, because you can fix this very easy.

I had a spike of 200~kWh logged in this morning, don’t know why, but I was able to fix this directly from the interface of HA without any SQL messing.

This was my ugly/demoralizing graph this morning…


looking at SQL this was the raw data (not needed to check at all… but gone there following google hints)

As you can see, the meter jumped from 18k to 226k, so not an HA issue.
Just open Developer Tools, go statistics and click on the “ramp” icon to the right

navigate to the point the graph gone broken and enter a new value (0 or estimated)


Enter the new value (0,09kWh was the right number for me)

And It’s all done :slight_smile:


As you can see, graphs returned to normal.
(BTW: I had to fix cost statistics too, same procedure).

Hope this helps

5 Likes

@azerbinati This is exactly the same way which @macxq shared a post above you. But it is good to have the details here as well - just in case the link stops working in the future.

It is true - at some point HA devs added a way to fix the stats easily (TBH I don’t know when they have done it, I haven’t noticed any mentions about it in any release notes).

Although for me the initial stats are still broken (very first record)

The first recode available via “Adjust sum” UI is the following
image

It looks like it uses the sum (instead of state) value to show the first record

3 Likes

I tried to fix the statistics table by first editing the “state” field and then the “sum” field. The data seems correct right after the change but then within 1h the same difference that I entered in the last hour data reappears.
Is the state saved somewhere? Is there any variable I need to reset after reclaiming the data in SQLite?
I specify that the data I need to fix is not the main energy tab but the individual utilities immediately below it (which are a UPS and a 3d printer).
Thanks

I had the same problem. And the solution is that you need to update the “statistics_short_term” as well. I belive the “statistics”, both “state” and “sum” are calculated from the last hours of “statistics_short_term”. As this is a mutch more detalied datasett.

2 Likes