Lovelace: mini graph card

Hi, I think i’ve read through all posts related to hovering, but I couldn’t find anything. I have three graphs with my power measurement of the last hour, day and month. I would like to hover over a point and see it’s value but I don’t want to see the current state all the time as it would be 3 times the same. Does anyone know how to do that?
Thanks

This doesn’t look like a mini graph card. Could you clarify?

sorry wrong topic, i thought i opend another one

It is possible for a stock history-graph card

Sure, but that’s not why I’m posting here.

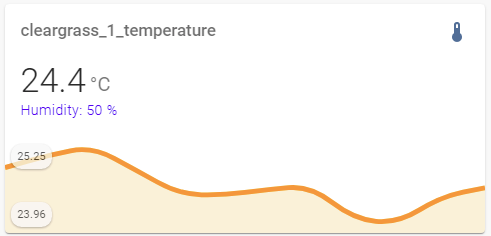
How to display an additional info on the card:
image

code
type: 'custom:mini-graph-card'
entities:
  - sensor.cleargrass_1_temp
show:
  labels: true
card_mod:
  style: |
    .states.flex::after {
      color: blue;
      content: "Humidity: {{states('sensor.cleargrass_1_humidity')}} % \A CO2: {{states('sensor.cleargrass_1_co2')}} ppm";
      white-space: pre;
      background-color: rgba(50,50,50,0.1);
      padding: 5px 5px 5px 5px;
      border-radius: 5px;
    }

Another case is here:
изображение


In case of several entities:
there are 2 diff ways:

code
type: vertical-stack
cards:
  - type: custom:mini-graph-card
    entities:
      - entity: sensor.xiaomi_cg_1_temperature
      - entity: sensor.xiaomi_cg_2_temperature
        show_state: true
    show:
      labels: true
    card_mod:
      style: |
        .states.flex > .state::after {
          content: "{{states('sun.sun')}}";
          margin-left: 70px;        
        }

  - type: custom:mini-graph-card
    entities:
      - entity: sensor.xiaomi_cg_1_temperature
      - entity: sensor.xiaomi_cg_2_temperature
        show_state: true
    show:
      labels: true
    card_mod:
      style: |
        .states.flex > .state::after {
          content: "{{states('sun.sun')}}";
          margin-right: 20px;        
        }
        .states.flex > :first-child {
          width: 66.66%;
        }
        .states.flex > :last-child {
          width: 33.33%;
          margin-left: 0px;
        }

Find more card-mod examples.

2 Likes

Is anybody using theme variables with color_thresholds?

I am trying to create a greyscale theme, so I am replacing hardcoded values for my thresholds with:

color_thresholds:
  - color: var(--label-badge-green)
    value: 50
  - color: var(--label-badge-yellow)
    value: 70
  - color: var(--label-badge-red)
    value: 100

It works fine for distinct values, but gradients between values become black.

That is not supported unfortunately

As in completely unachievable? Or something that should be a feature request rather than a forum post?

If its simply a question of replacing a variable name with a value before calculating the transition then I might be able to look into doing a pull request myself. But it will take quite some time to understand the current code. But if you can tell already that it won’t be possible due to hard limitations of the framework or similar then I won’t waste my time.

Technically feasible (border hacky though…) but not a feature. Also mini-graph-card is not having new features added. It’s mostly in maintenance mode. You can checkout apexcharts-card which supports what you are looking for.

Sounds nice if ApexCharts works. But I am having the samme issues with that card.

type: 'custom:apexcharts-card'
experimental:
  color_threshold: true
series:
  - entity: sensor.netatmo_office_temperature
    color_threshold:
      - value: 10
        color: var(--label-badge-blue)
      - value: 20
        color: var(--label-badge-green)
      - value: 30
        color: var(--label-badge-red)

Just shows a completely black line

Post it where you can get help.

Is it possible to change the color of the line/bar based on an attribute of the entity?

Not possible, I think.

Does anyone know if it’s possible to have a chart that always has the start position at midnight ?

I have a sensor that has rolling totals for my energy consumption today, and resets at midnight - Ideally I would like to chart this so the starting point on the chart is always midnight otherwise the charts end up looking a bit confusing :stuck_out_tongue:

Try apexcharts-card

1 Like

In regards to night mode:

Where do the “input_number” and “sensor” go? I tried in the configuration.yaml but was unsuccessful.

I know the automations go in the automations.yaml, correct?

That is exactly where they should go, but it depends on your setup. You can have these entries split up and stored over multiple files or all in one. The simple way, especially for beginners, is to store them in configuration.yaml.

My guess would be, that you didn’t set them up correctly. You have to look in your configuration.yaml, if there are already some sensors set and add it to this entry. If none are set, you have to setup the sensor domain…

# configuration.yaml
input_number:
  night_time:
    name: Night Time
    icon: mdi:theme-light-dark
    min: 0
    max: 1
    step: 1

sensor:
  - platform: template
    sensors:
      day_night:
        friendly_name: "Day/Night"
        value_template: >-
          {% if is_state('sun.sun', 'above_horizon') %}
            Day
          {% else %}
            Night
          {% endif %}
        icon_template: >-
          {% if is_state('sun.sun', 'above_horizon') %}
            mdi:weather-sunny
          {% else %}
            mdi:weather-night
          {% endif %}

Is there a reason why everyone is using custom binary sensors or inputs to create the sun down/up graph?
Edit 2: Ah I get it now having read the github link below more - the binary sensors are a work around :slight_smile:

I attempted to do it natively in mini-graph and it works on mobile and not in the web browser. It is strange…
Edit: it works on the browser too, when I set cache: false and refreshed the page. See Binary sensor not properly shown · Issue #505 · kalkih/mini-graph-card · GitHub

This the card:

type: 'custom:mini-graph-card'
name: Living Room
show:
  labels: true
entities:
  - entity: sensor.dining_and_living_room_temperature
    name: Wiser
  - entity: sensor.multi_sensor_2_temperature
    name: Aqara
    show_state: true
  - entity: sun.sun
    y_axis: secondary
    color: gray
state_map:
  - value: above_horizon
  - value: below_horizon

Thanks for the help. I have it working now. I didnt put the “input_number:” and “sensor:” in the yaml.

1 Like