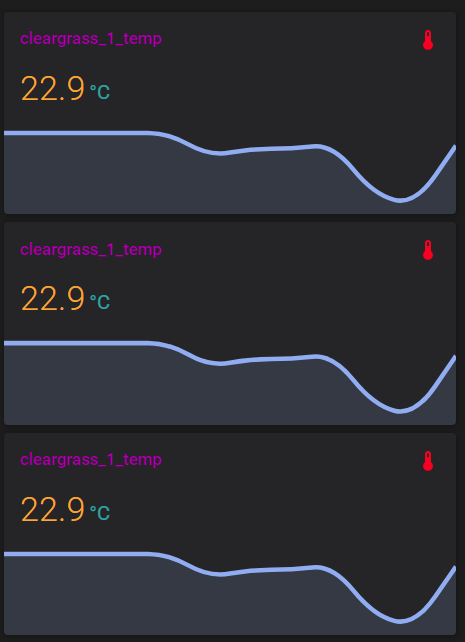
Styling the card with “card-mod”:
Changing background color:
Note: this style may be used to make a card transparent.

type: 'custom:mini-graph-card'
entities:
  - sensor.cleargrass_1_temp
show:
  labels: true
card_mod:
  style: |
    ha-card {
      --ha-card-background: rgba(50,50,50,0.2);
    }
Background image:

type: 'custom:mini-graph-card'
entities:
  - sensor.cleargrass_1_temp
show:
  labels: true
card_mod:
  style: |
    ha-card {
      background-image: url("/local/images/blue_low_2.jpg");
      background-size: 100% 100%;
    }
All text is colored:

type: 'custom:mini-graph-card'
entities:
  - sensor.cleargrass_1_temp
show:
  labels: true
  average: true
  extrema: true
card_mod:
  style: |
    ha-card {
      color: red;
    }
Colored title & icon:

type: 'custom:mini-graph-card'
entities:
  - sensor.cleargrass_1_temp
show:
  labels: true
  average: true
  extrema: true
card_mod:
  style: |
    .header.flex .name.flex {
      color: green;
    }
    .header.flex .icon {
      color: red;
    }
Resized icon:

type: 'custom:mini-graph-card'
entities:
  - sensor.cleargrass_1_co2
show:
  labels: true
  average: true
  extrema: true
card_mod:
  style: |
    .header.flex .icon {
      --mdc-icon-size: 60px;
    }
Colored state & min/max/avg info:

type: 'custom:mini-graph-card'
entities:
  - sensor.cleargrass_1_temp
show:
  labels: true
  average: true
  extrema: true
card_mod:
  style: |
    .states.flex {
      color: orange;
    }
    .info.flex {
      color: red;
    }
Colored state value, colored unit:

type: 'custom:mini-graph-card'
entities:
  - sensor.cleargrass_1_temp
show:
  labels: true
  average: true
  extrema: true
card_mod:
  style: |
    .states.flex .state .state__value.ellipsis{
      color: orange;
    }
    .states.flex .state .state__uom.ellipsis{
      color: cyan;
    }
Colored info: different colors:

type: 'custom:mini-graph-card'
entities:
  - sensor.cleargrass_1_temp
show:
  labels: true
  average: true
  extrema: true
card_mod:
  style: |
    .info.flex .info__item .info__item__type {
      color: red;
    }
    .info.flex .info__item .info__item__value {
      color: green;
    }
    .info.flex .info__item .info__item__time {
      color: cyan;
    }
Colored info: only max:

type: 'custom:mini-graph-card'
entities:
  - sensor.cleargrass_1_temp
show:
  labels: true
  average: true
  extrema: true
card_mod:
  style: |
    .info.flex div.info__item:nth-child(3) {
      color: red;
    }
Colored info: only max, different colors:

type: 'custom:mini-graph-card'
entities:
  - sensor.cleargrass_1_temp
show:
  labels: true
  average: true
  extrema: true
card_mod:
  style: |
    .info.flex div.info__item:nth-child(3) .info__item__type {
      color: red;
    }
    .info.flex div.info__item:nth-child(3) .info__item__value {
      color: green;
    }
    .info.flex div.info__item:nth-child(3) .info__item__time {
      color: cyan;
    }
Colored labels:

type: 'custom:mini-graph-card'
entities:
  - sensor.cleargrass_1_temp
show:
  labels: true
  average: true
  extrema: true
card_mod:
  style: |
    .graph .graph__container .graph__labels {
      color: red;
    }
Colored labels (different colors):

type: 'custom:mini-graph-card'
entities:
  - sensor.cleargrass_1_temp
show:
  labels: true
  average: true
  extrema: true
card_mod:
  style: |
    .graph .graph__container .graph__labels .label--max {
      color: green;
    }
    .graph .graph__container .graph__labels .label--min {
      color: red;
    }
How to style if secondary Y-axis is present:
Let’s add one more graph and set a style to labels:

type: 'custom:mini-graph-card'
entities:
  - entity: sensor.cleargrass_1_temp
    name: Temp
    show_state: true
  - entity: sensor.cleargrass_2_co2
    name: CO2
    show_state: true
    y_axis: secondary
show:
  labels: true
  name: false
  icon: false
  average: false
  extrema: false
  labels_secondary: true
card_mod:
  style: |
    .graph .graph__container .graph__labels {
      color: red;
    }
Also we can style a color for the legend:

type: 'custom:mini-graph-card'
entities:
  - entity: sensor.cleargrass_1_temp
    name: Temp
    show_state: true
  - entity: sensor.cleargrass_2_co2
    name: CO2
    show_state: true
    y_axis: secondary
show:
  labels: true
  name: false
  icon: false
  average: false
  extrema: false
  labels_secondary: true
card_mod:
  style: |
    .graph .graph__legend {
      color: red;
    }
Now let’s tune up colors for Y-axis & legend for every graph:

type: 'custom:mini-graph-card'
entities:
  - entity: sensor.cleargrass_1_temp
    name: Temp
    show_state: true
    color: red
    state_adaptive_color: true
  - entity: sensor.cleargrass_2_co2
    name: CO2
    show_state: true
    color: green
    state_adaptive_color: true
    y_axis: secondary
show:
  labels: true
  name: false
  icon: false
  average: false
  extrema: false
  labels_secondary: true
card_mod:
  style: |
    .graph .graph__container .graph__labels.--primary.flex {
      color: red;
    }
    .graph .graph__container .graph__labels.--secondary.flex {
      color: green;
    }
    .graph .graph__legend div:nth-child(1) {
        color: red;
    }
    .graph .graph__legend div:nth-child(2) {
        color: green;
    }
Changing font-size:
For each element:

type: 'custom:mini-graph-card'
entities:
  - sensor.cleargrass_1_temp
show:
  labels: true
  average: true
  extrema: true
card_mod:
  style: |
    .header.flex .name.flex {
      font-size: 10px;
    }
    .states.flex .state .state__value.ellipsis {
      font-size: 15px;
      align-self: center;
    }
    .states.flex .state .state__uom.ellipsis {
      font-size: 18px;
      align-self: center;
    }
    .info.flex .info__item .info__item__type {
      font-size: 12px;
    }
    .info.flex .info__item .info__item__value {
      font-size: 18px;
    }
    .info.flex .info__item .info__item__time {
      font-size: 8px;
    }
    .graph .graph__container .graph__labels {
      font-size: 18px;
    }
For legend:

type: 'custom:mini-graph-card'
entities:
  - entity: sensor.cleargrass_1_temp
    name: Temp
    show_state: true
  - entity: sensor.cleargrass_2_co2
    name: CO2
    show_state: true
    y_axis: secondary
show:
  labels: true
  name: false
  icon: false
  average: false
  extrema: false
  labels_secondary: true
card_mod:
  style: |
    .graph .graph__legend {
      font-size: 8px;
    }
Hiding dates for MAX & MIN data:

type: 'custom:mini-graph-card'
entities:
  - sensor.cleargrass_1_temp
show:
  labels: true
  extrema: true
card_mod:
  style: |
    .info.flex .info__item .info__item__time {
      display: none;
    }
Hiding MAX or MIN data:

type: 'custom:mini-graph-card'
entities:
  - sensor.cleargrass_1_temp
show:
  labels: true
  extrema: true
card_mod:
  style: |
    .info.flex div.info__item:nth-child(1) {
      color: transparent;
    }
    .info.flex div.info__item:nth-child(2) {
      color: red;
    }
Another example - how to show “avg” & “max” labels:

        type: custom:mini-graph-card
        entities:
          - sensor.xiaomi_cg_1_temperature
        show:
          labels: true
          average: true
          extrema: true
        style: |
          .info.flex div.info__item:nth-child(1) {
            display: none;
          }
          .info.flex div.info__item:nth-child(2) {
            text-align: left;
          }
Hiding a unit for special cases:


type: 'custom:mini-graph-card'
entities:
  - sensor.cleargrass_1_temp
show:
  labels: true
card_mod:
  style: |
    .states.flex .state .state__uom.ellipsis {
      {% if states('sensor.cleargrass_1_temp') in ['unavailable','unknown'] %}
        display: none;
      {% endif %}
    }
state_map:
  - value: unavailable
    label: Sensor off
  - value: unknown
    label: Sensor off
Animation - blinking name, resized & rotating icon:
post


Display an additional info on the card:
post

Display additional text items (prefixes & suffixes):
post

Playing with animated curve:
post

One style for all graphs in a stack:
post

Solid fill:
All credits to @menloperk !
post

Update 15.08.22: does not seem to work in Safari & iOS Companion App.
Place state values in one line:
post

Show a graph for the 2nd sensor on the bottom:
post

Set a color for the last bar:
post

Place 2 sensors’ states on the left side:
post

Display states as a part of the legend:
post

Display a unit under the state:
post

Display a state & extrema data on the same line:
post

All credits to @reste_narquois !
Fixing an issue with a card inside state-switch:
post
Placing a UoM before a state’s value:
post

Imitating statistics card:
post

How to nicely align legend’s elements:
post

Styling labels’ background:
post

How to change graph’s color dynamically:
post


